Analysis of bio-electro-chemical signals from passive sweat-based wearable electro-impedance spectroscopy (EIS) towards assessing blood glucose ...
←
→
Page content transcription
If your browser does not render page correctly, please read the page content below
Analysis of bio-electro-chemical signals from
                                          passive sweat-based wearable electro-impedance
                                          spectroscopy (EIS) towards assessing blood
                                          glucose modulations
                                          Devangsingh Sankhala1 , Madhavi Pali2 , Kai-Chun Lin2 , Badrinath Jagannath2 , Sriram
                                          Muthukumar*3 , and Shalini Prasad*2
                                          1 Department
arXiv:2104.01793v1 [eess.SP] 5 Apr 2021

                                                       of Electrical Engineering, The University of Texas at Dallas, 800 W Campbell Rd, Dallas 75080 TX,
                                          USA
                                          2 Department of Bioengineering, The University of Texas at Dallas, 800 W Campbell Rd, Dallas 75080 TX, USA
                                          3 EnLiSense LLC, 1813 Audubon Pond Way, Allen 75013 TX, USA

                                          ABSTRACT

                                          There has been a recent tremendous interest in label-free detection of biomarkers which is a critical enabler of point-of-need
                                          diagnostics.A low-power, small form factor, multiplexed wearable system is proposed for continuous detection of glucose in
                                          passively expressed sweat using electrochemical impedance spectroscopy (EIS) measurement. The wearable EIS system
                                          consists of a sensing analog front end integrated with a low-volume (1-5 µL) ultra-sensitive flexible biosensors. A passive
                                          sweat sensor was designed integrating glucose oxidase electrochemical system on an active semiconducting material. The
                                          non-faradaic EIS response of the biosensor was used to calibrate the analog front end’s response using ratiometric Discrete
                                          Fourier Transform (DFT) for a shorter measurement time. In this work, a stringent assessment of a continuous glucose sensing
                                          platform is performed in a bottom-up approach, going from the biosensor to the system system to the interaction with a human
                                          subject. The active semiconductor-based biosensors are dosed with glucose concentrations ranging from 5-200 mg/dL and
                                          detection is performed using the analog front end. In addition, detailed analysis of battery life and performance of a wearable
                                          EIS system is discussed to define a figure of merit for an optimally integrated design. Moreover, a continuous glucose detection
                                          test is performed on a healthy human subject cohort to investigate the stability of sensor-system mechanism for an 8-hour
                                          period and a time-series based, auto-regressive (AR) model was created for the system.

                                          Introduction
                                          There is a significant interest in wearable biosensing platforms in the recent times. Constant improvements are being made in
                                          developing accurate and robust sensing mechanisms for various biomolecules of interest that demonstrate temporal dynamics.
                                          Wearable biosensors are enablers for point of need tracking of chronic conditions and can be beneficial both to the user as well
                                          as the healthcare professional in guided therapy1 . Glucose is a key biochemical marker with temporal dynamics in context
                                          to monitoring chronic health condition of diabetic patients. Current technologies to monitor blood glucose in small and/or
                                          wearable form factors still require frequent finger pricks or needle based interstitial blood glucose monitoring methods such as
                                          the Abbott Freestyle Libre or the Dexcom G6 to be integrated with pedometers and other lifestyle management tools towards
                                          achieving patient actionable glycemic control. Glucose biosensors, found commercially as well as in literature, implement a
                                          microneedle-based, chronoamperometry2–5 and square-wave voltammetry6 biosensor compatible for wearable devices, due to
                                          ease of electrical circuit implementation. These sensors may provide good sensitivity at the cost of larger sample volumes of
                                          interstitial fluid or sweat to adhere to acceptable CGM standards7 . Moreover, due to larger settling time of current, density
                                          gradients cause undesirable convective disruption of the diffusion layer8 . In addition, large settling time of an amperometric
                                          sensing scheme results in relatively higher current consumption.
                                              There is an immense opportunity in designing a wearable electronic system towards supporting such point-of-need sensing
                                          applications with low-volume, true no-needle insertion mechanisms. A case study of such a system is performed here by
                                          coupling a low-volume passive sweat biosensor9 with a rapid response electrochemical impedance spectroscopy (EIS)-based
                                          system10 . The proposed glucose reporting mechanism utilizes passively expressed system sweat towards achieving quantitative
                                          decision making; therefore low sample volume makes it prone to erroneous measurement in a real-world scenario. Error can
                                          be defined as a property of the system which introduces a deterministic undesirable offset in the measured outcome of the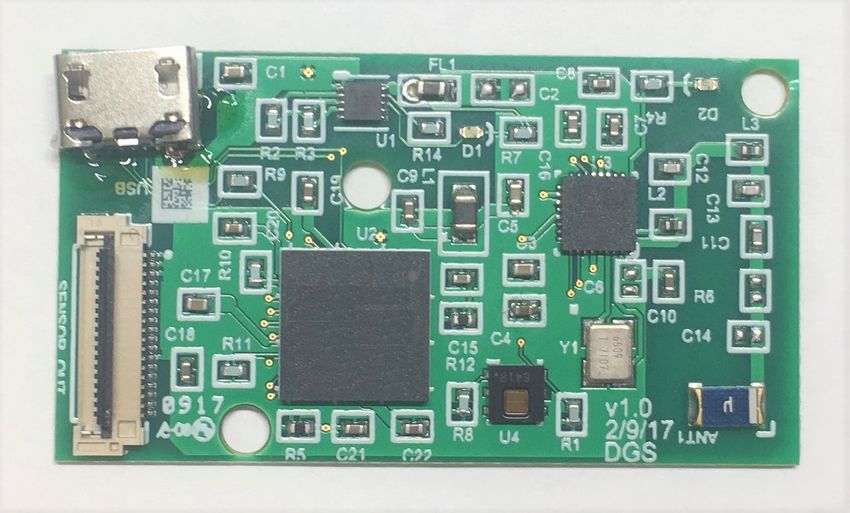
device. In this context, deterministic offset would mean an offset that can be mathematically represented using a polynomial.
On the other hand, noise is a probabilistic property of the system which introduces a random offset in the measured outcome of
the system and is modeled as a probability distribution function. The presence of relatively higher noise and error affects the
battery performance of a device as it would require more samples to average or filter out the undesirable signal counterpart. In
this work, the sensor’s impedance change is reported and correlated to the conventional statistical methods to establish good
sensitivity. Continuous sensing of glucose dose concentration and differentiation of normal and hyperglycemic rate of change
of glucose is demonstrated in a healthy cohort of 20 subjects, using an auto-regressive model, in comparison to an interpolated
sweat glucose time series.

Results
Calibration of the system using lumped elements
The proposed system was tested for individual channel offset on the calibration channel of a universal dummy cell (Gamry
Instruments). Fig. 2 shows the variation of measured impedance of the universal dummy cell using n = 3 replicates of that same
system. It is seen that the measured impedance. The accuracy of the device is demonstrated in Fig.2a over n = 3 devices over
a single channel. The expected calibration impedance at 100Hz was 4kΩ. However, a systematic negative offset of 50Ω is
observed with a variability of 50Ω on the measured impedance. This accounts for a 1.25% inter-device variation along with a
−1.25% error. The precision of a single device replicate is observed by taking n = 100 measurements for all four channels
using the universal dummy cell. The peak inter-channel variability of 150Ω is observed.

Calibration dose response of the system
Glucose dose concentrations ranging from 5-200 mg/dL were made in synthetic sweat buffer with pH values 4, 6 and 8 were
introduced on a functionalized sensor and the impedance at 100Hz was recorded to demonstrate proof of binding interaction
on the sensor surface. Fig. 3a shows the response of the system as standard error of mean of the percentage change function
of impedance impedance to varying pH and dose concentrations with a linear fit. Eqn. 1 shows the mathematical percentage
change of the measured impedance used to plot dose response. The system response shows 3% standard error on most of the
dose concentrations thus demonstrating precision of measurement.
                                           Z − Zbaseline
      Percentage change in Z = %∆Z =                                                                                           (1)
                                             Zbaseline
    Box-whisker plots were created as shown in Fig 3b to investigate the variability of the system response for a given dose
concentration irrespective of buffer pH. The true variability of the sensor response was observed to be 10% inter-sample
variation in the form of inter-quartile region height of each of the glucose dose concentrations. It can be observed that even with
a larger variability, the median divides the inter-quartile region symmetrically, demonstrating a Gaussian distribution. However,
there is a need to model this variation as a mathematical relationship to allow accurate detection as well as differentiation of
glucose dose concentrations across the dynamic range.

Identification of sources of noise and error
Noise is an undesirable measured quantity that accompanies a true measured quantity. This introduces an amount of uncertainty
in the accuracy and repeatability of the measurement device. Sources of noise have been well characterized for CMOS devices
in the past11, 12 . Primarily, the two major sources of noise discussed in academic as well as industrial design are thermal noise
and flicker noise for complementary metal-oxide-semiconductor (CMOS) transistors. Thermal noise is a result of electrical
fluctuations caused by thermal energy12 . This electron motion is popularly known as Brownian motion. The RMS noise voltage
is expressed as in Eqn. 2 where k is the Boltzmann constant, T is the absolute temperature in kelvin and R is the resistance of
the device under test. Thus, thermal noise will increase with rise in temperature. In CMOS transistors, this noise is a summation
of the noise generated by the gate and channel resistance. In case a capacitor is connected in parallel with the resistive noise
source, the RMS thermal noise is denoted as in Eqn. 3. Thus, thermal noise can be controlled using a shunt capacitor13 .
                     √
       v̄n,thermal = 4kT R                                                                                                     (2)

                     r
                         kT
      v̄n,thermal,RC =                                                                                                         (3)
                         C
Flicker noise or popularly known as 1/f noise is the resultant of attractive forces at the silicon-oxide interface in a CMOS
transistor giving rise to several energy states11, 13 . The RMS flicker noise is expressed as in Eqn. 4 where K is a statistically

                                                                                                                              2/14
calculated, process dependent parameter, W and L are the dimensions of the transistor, Cox is the capacitance of oxide film per
square and f is the frequency of interest. Thus, 1/f noise is a function of frequency, and is a source of error for low frequency
circuits.
                 s
                     K     1
       v̄n,1/ f =        .                                                                                                    (4)
                   W LCox f

    A noise model proposed by Hassibi and others14 is used to provide a noise treatment for the biosensors mentioned in
this work. For a non-faradaic electrode-electrolyte interface, the valence of the electrolyte is z. In addition, the measurement
is performed for a single frequency, thus the bandwidth of the system is 1 Hz. Fig 1c shows the incremental circuit model
established using impedance measurements in Munje et. al.9 and this work. Three noise sources due to Rs , RASA and Rct can be
identified using previously mentioned noise equations. Moreover, the measurement device’s response time of 13 ms is smaller
than the biosensor’s response time of 5 minutes. Based on these assumptions14 , a noise model was proposed for the biosensor
used in this work as shown in Fig. 1d, which was derived from Fig. 1c9 by dividing the cross-section of the sensor in three parts.
    Since an active semiconducting film is a partially conductive film with some resistance based on its doping levels, it is prone
to a noise voltage similar to a resistor and can be modeled as a thermal noise source. However, considering semi-conducting
properties of the film in mind15 , it can be assumed that there is a presence of 1/ f noise due to this film, which is a result of
charge carrier generation as well as recombination. However, since a capacitance CASA exists in parallel with the noise sources,
this noise can be modeled as a kT /C noise of the active semiconducting film. Considering the biosensing electrical double
layer and charge transfer resistance, these are modeled to be circuit components for an ideal polarized electrode (IPE), however,
they are imperfect in a real scenario. Thus, the noise of this region can be assumed to be a variation in the current density of the
charge carriers depending upon the strength of the electrical potential, which in turn depends on the location of the slip plane.
However, since the ion motion is slower than an electron’s motion, a function M(ω) is used to model the frequency dependent
effect of this current noise source. The solution resistance is a bulk effect and can be assumed to be a resistor, thus the thermal
noise effect. The final expression of the noise voltage would be a summation of all these noise sources as given in Eqn. 5.
                                                           1       kT    K     1
      v̄2 = 4kT (Rs + Relectrode ) + 2zqI.M(ω).(Rct ||         )+     +      .                                                  (5)
                                                         jωCdl    CASA W LCox f
    The veracity of this model is confirmed using a noise test for 30 minutes on a non-functionalized sensor surface wet with
1X phosphate saline buffer(PBS) using a high-speed potentiostat (Zurich Instruments, Switzerland). Fig. 2c shows the variation
of noise spectra at an interval of 5 minutes. The noise voltage follows a trend inversely proportional the the frequency and is
maximum at t=5 minutes, whereas it decreases with time and is at a minimum at t=30 minutes at 100 Hz excitation frequency.
Thus, as the introduction of PBS reaches an equilibrium, the noise amplitude of the system start decreasing with respect to 100
Hz excitation frequency. The RMS noise voltage is shown in Fig. 2b.
    Mean absolute relative difference (MARD)16 was used to emphasizes that noisy measurements are a function of the true
measurement and a summation of systematic bias and coefficient of variation, to establish reliability of the wearable biosensor.
This expression is given as in Eqn. 6 where Ĝ is the noisy measurement, G is the true measurement, %b is the systematic bias
obtained from the measurement system’s properties, %cv is the coefficient of variation among each sample for the given dose
step and εn is a standard random variable. Thus, the systematic bias will be a constant offset correction where as the standard
variable which accounts for variation from external environmental effects in a band limited by %cv.

      Ĝ = G(1 + %b + %cv × εn )                                                                                                (6)

    This approach can be used to characterize sources of variability in system performance. Systematic offset can be observed
as a result of device accuracy and precision, offset of the measurement device and specific signal threshold of the biosensor.
Coefficient of variation arises from sample-to-sample variation and is calculated as a ratio of standard deviation to mean for
a given dose concentration. In addition, environmental factors such as temperature, relative humidity, variation in volume
dispensed, etc. play an important part in the system’s response. However, it would be an extensive effort to characterize for
each of them separately and superimpose. A standard normal variable can be used to account for all these variations. Thus,
variation is accounted for statistically, whereas systematic offsets are accounted for by observation and nullified by software
when using Eqn. 6.

Performance metrics for wearable devices
There is a need to encompass all important specifications as one numerical expression to represent the performance of an
electrical design in question relative to other alternative designs. This numerical expression is called the figure of merit (FOM).

                                                                                                                              3/14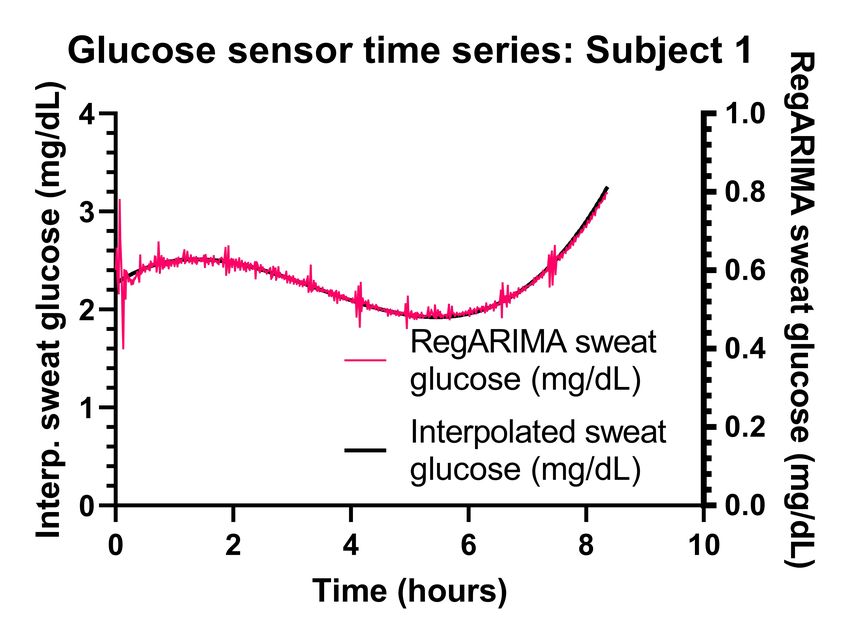
Variable     Source of error                                 Value               Comments
               Non-functionalized biosensor electrical         0.35% to 2%         Variation of RMS noise of the sensor with
     %b
               noise (thermal + 1/ f )                                             respect to excitation voltage = 10 mV RMS
               Instrumentation loop offset                    -1.25%               Offset in impedance mesaurement for Zcal =
                                                                                   3990Ω at f = 100Hz
               Biosensor specific signal threshold            11%                  Y-intercept=11% for sensor output impedance
                                                                                   response from Fig. 3a at buffer pH = 4.
               Biosensor-dependent sample-to-sample            8% to 10%           Variation @ fs = 100Hz observed in Fig. 3b.
               variation
    %cv
               Instrumentation loop variability               -0.4% to -1.5%       Sample-to-sample variation of impedance
                                                                                   mesaurement for Zcal = 3990Ω at f = 100Hz

Table 1. A simplified MARD model for the proposed wearable platform was created using sources of error as a percentage
component of the device under test in a real world environment in the presence of noise.

Such a design comparison is very popular among data conversion designs17 and is defined as the energy required for one data
conversion. For deciding an expression for the figure of merit of a design, the system was split into the measurement device and
the biosensor and their inherent properties were observed.
    For the measurement device, the ultimate objective to be achieved would be very similar to a data conversion system, i.e.
achieving a low power consumption per every measurement performed. Similarly, the capability of the device to measure with
minimal power will be observed by varying operating conditions. A battery operated device is generally operated at a very low,
sleep-mode supply current. However, the device requires a comparatively larger amount of current to operate in an active state.
Thus, for such an uneven distribution of current, an average over the time taken by the device to execute the program from
start to end. Thus, the battery selection for a fixed average current is performed as follows. Let the sleep current of the device
in question is Isleep for time tsleep and the active current of the device is Iactive for time tactive . Since the device completes one
program cycle, the total time for one program cycle ttotal is the summation of tsleep and tactive .

      ttotal = tsleep + tactive                                                                                                    (7)

                        tsleep             tactive
      Iavg = Isleep ×          + Iactive ×                                                                                         (8)
                        ttotal              ttotal
    The figure of merit (FOM) of an electrical device can be defined as the energy spent to convert a physical sensor signal
at an instant of time. However, to demonstrate the increased throughput capacity of the device against power consumption,
parameters n and p were included, where n as number of sensors channels available by design and p is the number of points per
one measurement cycle. Here, one measurement cycle implies measuring all points until settling for amperometric designs, or
one sweep from lowest to highest frequency in impedance spectroscopy designs. For the proposed design, the figure of merit is
                                                   1
calculated for n = 4, p = 10, NBIT S = 16, fs =        as one conversion period. The voltage is assumed to be 3.7V as of a
                                                 13ms
standard lithium polymer battery. Thus, an FOM of 19nJ/point, or 190nJ/sweep was obtained.
                        npVbatt Iavg
      FOMdevice =                                                                                                                  (9)
                        fs × 2NBIT S
    A biosensor is expected to demonstrate a large dynamic range with a low order curve fit equation for lesser computation
requirement and low power consumption. Moreover, it is expected that the biosensor is sensitive to the very low concentrations
of biomarkers of interest. Thus, the figure of merit (FOM) of a biosensor can be defined as in Eqn. 10, where a relative
percentage value of the specific signal threshold and linear dynamic range are considered. thus, higher the FOM, higher the
ease of integration irrespective of dissimilar sensor, measurement device or electrochemical technique used or any combination
of the former.
                       %LDR
      FOMsensor =                                                                                                                 (10)
                       %SST
   The above mentioned figures of merit of individual system sub-blocks define the efficiency of the device to perform
under trade-offs under the designer’s control. However, if these are inconsistent between two sub-blocks of a system, the

                                                                                                                                 4/14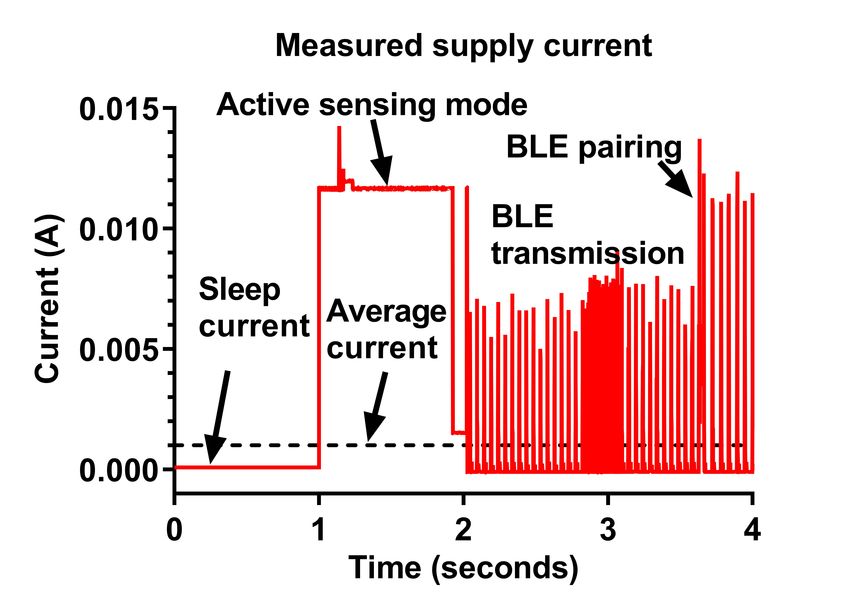
integrated system may function inaccurately due to a cumulative effect of errors generated by individual sub-blocks. To ensure
maximum integrability of the measurement device and the biosensor, an attempt was made to mathematically define a statistical
relationship between sub-block accuracy. Accuracy A of a quantity is defined as the difference between the actual value x of the
quantity and the ideal or true value X of the quantity as shown in Eqn. 11. Similarly, mismatch between two quantities x1 and
x2 is the difference between the actual ratio of the quantities and the desired ratio of the two quantities as shown in Eqn. 12. For
the proposed biosensor, the FOM of 11.87 if obtained for %LDR = 95% and %SST = 8%.
           x−X   ∆x
      A=       =                                                                                                               (11)
            X    X

         x2 X2
           −
         x    X1
      δ= 1                                                                                                                     (12)
           X2
           X1
Both the accuracy and mismatch numbers should be zero for a perfectly non-erroneous measurement, which is a highly unlikely
in the presence of sources of variation and noise. Thus, this specification helps a system integrator to analyze the quality of
sub-blocks available and investigate methods of error compensation, either by hardware or software. For the proposed system
system, for simplicity it is assumed that the since the measurement device and the biosensor are made of different materials, the
offsets are uncorrelated, thus additive. The accuracy of the measurement device is 1.25% as per Fig. 2a whereas the accuracy of
the biosensor is 10% as per the Fig. 3b. Thus, the mutual mismatch as a resultant of coupling both would be δ = −0.875% as
per Eqn. 12. For an optimal system level design, δ → 0 thus demonstrating the robustness of integration.

Continuous measurement testing
The dose calibration response of the sensor describes the accuracy of the system at a given steady state. In contrast, real-world
applications demand the need for providing a steady sensor output irrespective of change in environmental conditions. A
method of conversion of impedance measurements to real-time glucose measurements would bridge the gap between the sensor
output and the much-needed user information to be generated. Such a multi-variable problem can be solved using predictive
methods for time-series based analysis. Various models such as auto-regression18, 19 and neural network based approach20–24
have been used, as they consider the previous input, the previous output and the current input of the system. Also, these models
have been created using interstitial fluid (ISF) based continues glucose monitoring systems (CGM), hence these are not based
on non-invasively sampled data sets.
    A more simplistic approach is the application of time-series analysis to measurements provided by the proposed system.
The system was put on N=20 human subjects for a period of 8 hours, wherein their glucose sensor output, skin temperature,
skin humidity was measured continuously while 4 sweat samples were collected per subject. The sweat sample was used to
measure sweat glucose levels using a reference method. Since only 4 reference points were available considering the limitations
of the IRB, an interpolation curve was created using the 4 reference points to match the length of output of the system.

      y = X1 β1 + ... + X10 β10 + µt                                                                                           (13)

      (1 − φ1 L − ... − φ10 L10 )µt = (1 + θ1 L + θ2 L2 + θ3 L3 )εt                                                            (14)

    ARIMA(p,d,q) is one of the most commonly used curve fit functions used for time-series analysis, where p is the order of
auto-regressive (AR) terms, d is the number of integrating terms and q is the number of moving -average (MA) terms. For the
above data set, p was determined using the number of significant peaks in the auto-correlation plot of the primary predictors
impedance magnitude (Zmod) and first differential of impedance magnitude (dZmod), which shows a change in sensor response
with change in glucose concentration as per dose calibration. Figs. 4a,4d show 2 extreme cases among the 20 data set, wherein
the auto-correlation plot shows 5 initial lag peaks for subject 1 and 10 initial lag peaks for subject 2, which exceed the 3σ
confidence interval. Hence, the maximum peaks defined p = 10. The ARIMA(10,0,3) regression curve fit used for the above
data sets is given in Eqn. 13 and Eqn. 14, where y is the output, X are the input values for the predictors, β are the coefficients
obtained from regression ARIMA fit, µt is the variance, L is the lag operator, θ are the moving average coefficients and εt is
Gaussian white noise.
    The coefficients of the ARIMA(10,0,3) curve fit are shown in Table 2. The p-value for a given predictor defines its
significance in predicting the output time series, which is the interpolated sweat glucose value. If p < 0.05, then the predictor

                                                                                                                               5/14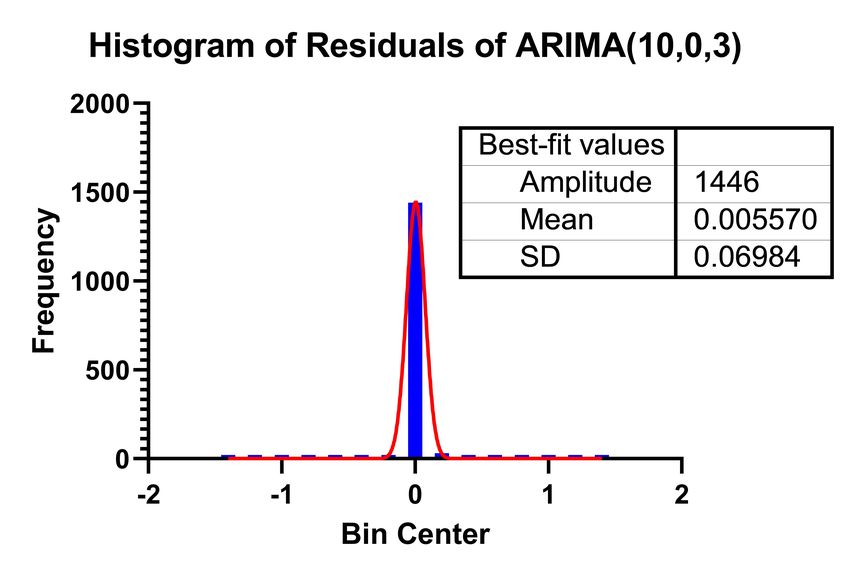
is assumed to be significant as it rejects the null hypothesis, else the predictor can be assumed to be non-significant, hence
can be removed from the curve fit expression. In this case, predictors AR4 can be safely assumed to be not contributing to the
prediction. The AIC of this curve fit was −3131.438, ensuring good curve fit and low prediction error. This is corroborated by
the ARIMA outputs plotted against the interpolated glucose values in Figs. 5a, 5b. The error histogram is shown in Fig. 5c,
demonstrating a low predicted sweat glucose error with respect to the interpolated sweat glucose measurements.

           Predictor            Value                 Std. Error           t-stat               p-value
           Intercept            2.2236                0.0011792            1885.6396            0
           AR1                  1.1696                0.016376             71.4217              0
           AR2                  -0.79248              0.015316             -51.7426             0
           AR3                  0.71839               0.044644             16.0916              2.9197e-58
           AR4                  0.10234               0.044076             2.322                0.020235
           AR5                  -0.22962              0.032213             -7.1282              1.0166e-12
           AR6                  0.1                   0.034417             2.9055               0.0036662
           AR7                  -0.20436              0.034488             -5.9257              3.109e-09
           AR8                  0.11278               0.03253              3.4668               0.00052668
           AR9                  -0.075336             0.032725             -2.3021              0.021328
           AR10                 0.085203              0.026248             3.246                0.0011702
           MA1                  -0.60583              0.017528             -34.5629             9.1092e-262
           MA2                  0.7133                0.024382             29.255               3.8771e-188
           MA3                  -0.40103              0.050977             -7.8668              3.6377e-15
           Beta(Zimag)          -0.00025308           4.887e-06            -51.7866             0
           Beta(Zmod)           0.00054978            1.1027e-05           49.8589              0
           Beta(Zphase)         -0.023363             0.0014868            -15.7133             1.2261e-55
           Beta(Zreal)          -0.00047466           9.8819e-06           -48.033              0
           Beta(dZimag)         -5.2582e-06           6.8561e-07           -7.6694              1.7285e-14
           Beta(dZmod)          -7.0023e-06           1.5741e-07           -44.4853             0
           Beta(dZphase)        -0.0045203            0.0022546            -2.0049              0.044974
           Beta(dZreal)         1.1458e-05            6.5176e-07           17.5794              3.5439e-69
           Beta(rh)             -0.022069             0.00070336           -31.3763             4.2615e-216
           Variance             0.0075866             0.00025797           29.4091              4.2045e-190

Table 2. Values of ARIMA regression coefficients along with standard error, t-statistic and p-value as obtained from fitting on
test data sets.

   Specification                  Jalal et. al.3               Lee et. al.2                This work
   Sensing mechanism              chronoamperometry            chronoamperometry with EIS
                                                               potential pre-stabilization
   Front end                      LMP91000 + reference MAX4617 (analog mux) + ADuCM350
                                  generator + DAC + passive MAX7405 (8th order filter)
                                  2nd order filter             + AFE4490 (amperometric
                                                               front end)
   Sensor     +    electronic     200 s (OCP) + 200 s 60 s (pre stabilization) + 180 s + 13 ms
   response time                  (chronoamp)                  180 s
   Processor                      TI MSP430F5229               ATMEGA328                   ADuCM350
   Sensing algorithm              hysteresis (hard thresholds) temperature and PPS based auto-regression
                                  on OCP + chronoamperom- normalization (guarantees
                                  etry                         accuracy )
   Battery size                   1000 mAh                     N/A                         300 mAh
   Peripherals                    Bluetooth, BMS, EEPROM Bluetooth, BMS, SpO2, BLE, BMS, temperature,
                                                               PPG, temperature            RH

               Table 3. Electrical comparison of specifications of system level designs reported in literature.

                                                                                                                          6/14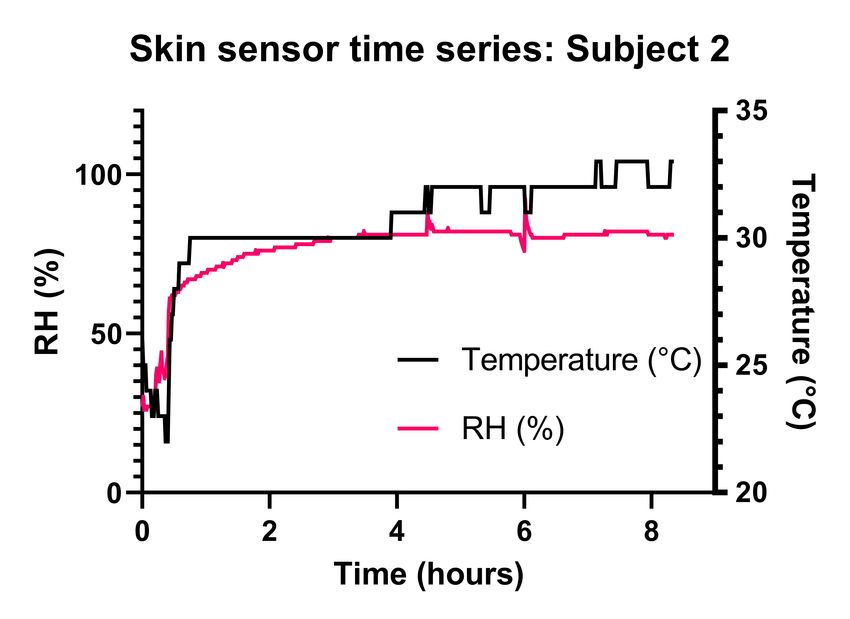
Discussion
Various electrochemical techniques such as cyclic voltammetry, chronoamperometry and impedance spectroscopy techniques
exist for the characterization of electrochemical cells and have been successfully employed for biosensing applications. However,
there has been less interest in design impedance spectroscopy device due to increased complexity required for phase as well
as magnitude detection on the hardware aspect. Moreover, added hardware increases the size and power consumption on a
system level scale for most designs. Thus, the first wearable, electrochemical impedance spectroscopy system is proposed for
glucose detection in sweat with a battery lifetime of 215 hours. Moreover, a small form factor of the device is demonstrated by
implementing a monolithic SoC with an EIS dedicated front-end with four channel sensing. Table 3 compares the electrical
specifications and system level mechanism in general to highlight the advantages of using an impedance based spectroscopy
design over an amperometric design.
The proposed biosensor is capable of sensing glucose concentrations in sweat from 10 mg/dL to 200 mg/dL in various
synthetic sweat buffers of various pH values. Moreover, the stability of the sensor response is established not only from a
conventional statistical approach, but also using sample-to-sample variation observations and demonstrates a 20% variability
similar to safe limits on a Clarke Error Grid. In addition, for the first time, a semi-quantitative method of detecting rate of
change of glucose is proposed for aiding real-time diagnostic efforts using a slope feature extraction algorithm on the impedance
response of the sensor. This algorithm also demonstrates a rate-of-change occurrence probability-based reduction in time
complexity, leading to low power operation on a wearable platform.
From a system level perspective, this work is a first attempt to dive into the specifics of interdisciplinary system integration
for biosensing applications. A simplistic noise model for the biosensor is demonstrated along with noise measurements
to correlate with change of noise behavior in time based on conventional electrical circuit noise analyses. The analysis is
tested against noise measurements made on a high-speed potentiostat and mathematically verified. In addition, the accuracy
of the measurement device is identified and coupled to a source of error which corroborates the MARD based analysis of
sample-to-sample variability. Finally, a mismatch expression is proposed to demonstrate low mismatch due to coupling of the
biosensor and the measurement device with a mismatch coefficient of -0.875%.
Methods
Sensor fabrication
Fig. 1a shows the cross-sectional view of the chemi-impedance biosensor and the formation of the immunoassay on the
functionalized surface. The biosensor substrate is a 100 µm thick,flexible nanoporous polyamide substrate (GE Lifesciences,
NJ). Gold electrodes were patterned using shadow mask and deposited using e-beam cryo-evaporator. ZnO thin films were
sputtered onto patterned in the area between the two gold electrodes to get maximum overlap using an AJA Orion RF magnetron
with a 99.999% ZnO target (Kurt J. Lesker) at room temperature9 .
Materials for implementing glucose assay
Poly-amide substrates with 0.2 µm pore size were obtained from GE Healthcare Life Sciences (Piscataway, NJ, USA). The
linker molecule dithiobis [succinimidyl propionate] (DSP) and its solvent dimethyl sulfoxide (DMSO) were ordered from
Thermo Fisher Scientific Inc. (Waltham, MA, USA). The monoclonal glucose oxidase antibody was obtained from Thermo
Fisher Scientific Inc. (Waltham, MA, USA). Glucose oxidase from Aspergillus niger and D(+)-glucose was obtained from
Sigma-Aldrich (St. Louis, MO, USA). The glucose antibody was diluted in 1X phosphate buffered saline (PBS, Thermo Fisher
Scientific Inc., Waltham, MA, USA). Synthetic sweat was prepared as per the recipe stated in M.T. Mathew et al. The pH range
is varied by varying the concentration of the components. Human sweat was purchased from Lee Biosolutions Inc. (St. Louis,
MO, USA), where it was collected from single human donor with pH ≈ 4–5. No preservatives have been added to this product
and it was stored unfiltered at below - 20 °C9 .
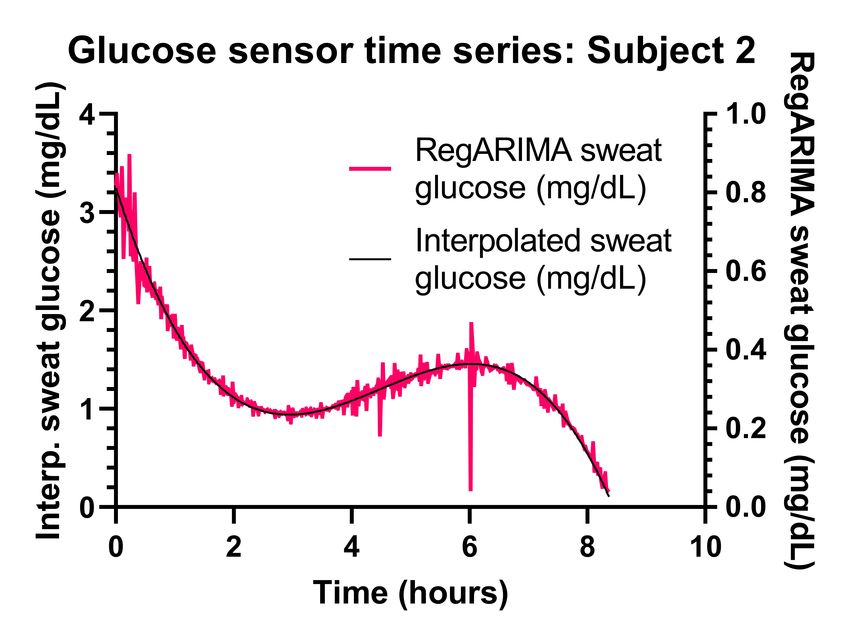
Wearable EIS device disassembly
The wearable EIS device used for experiments in this work is shown in Fig. 1f. The design is primarily divided into two
parts: a mother board and a daughter board. The motherboard houses the integrated circuits required for measurement and
communication. The daughter board houses four flexible biosensors using slide-in connectors. The daughter board connects
to the motherboard using a slide-in connector as well. The motherboard is further divided into four subsections. The first
subsection is the ADuCM350 system-on-chip (SoC) (Analog Devices Inc.) which is the heart of the wearable platform. It
is equipped with an impedance analyzer block which gives the real and imaginary part of an unknown impedance using a
ratiometric discrete Fourier transform (DFT) accelerator. The second subsection is the nRF8001 (Nordic Semiconductor
ASA) Bluetooth Low Energy (BLE) chip-set which communicates with a mobile application. The third subsection is the
temperature and RH sensing which was implemented using HDC1080 (Texas Instruments Inc.). The fourth subsection is the
7/14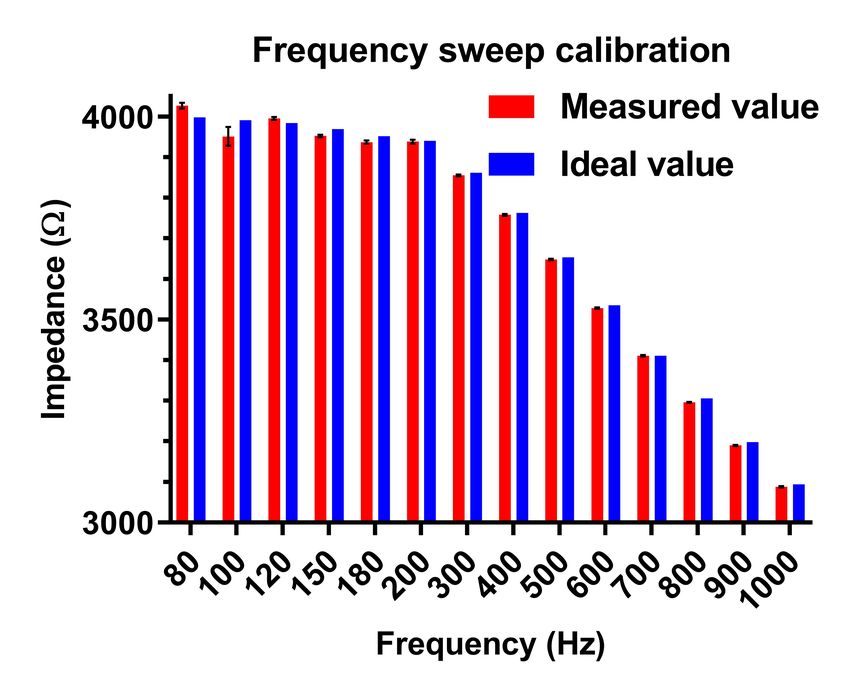
power management system implemented using BQ24040 (Texas Instruments Inc.). This subsections supplies power to the other
subsection either using a lithium battery or USB and manages the charge-discharge cycle of the lithium battery.

Glucose sensor experimental protocol
Gold surface was functionalized with 3 µL of 10 mmol DSP linker after incubation for 2 hours. The PBS wash was carried out
followed by 15 min incubation of 3 µL of 10 µg/mL glucose oxidase antibody. Thereafter, 3 µL of 1 mg/mL glucose oxidase
enzyme obtained from Aspergillus Niger is dispensed. Serial dilutions of glucose in synthetic sweat were prepared to range
from 5 mg/dL to 200 mg/dL, which were dispensed after antibody incubation. Each glucose concentration was incubated for 5
minutes on the sensor surface prior to measurement. Sensor calibration response was obtained in human sweat with increased
glucose concentration doses from 5 mg/dL to 200 mg/dL with n=4 replicates of chips. Two test sample chips with 5 mg/mL
and 200 mg/mL glucose concentration doses on each were also measured. The average readings were then compared with the
values obtained from calibration dose response in human sweat. These EIS measurements were performed by recording current
flow using ADuCM350 after applying 10 mV AC voltage with a frequency of 100 Hz.

Human subject enrollment
Human subjects for sweat sample collection and on-body continuous measurement in compliance with the protocol approved
by Institutional Review Board (IRB) at the University of Texas at Dallas (IRB number 19-146). A written and informed consent
was obtained from all participants of this study. A study was performed on 20 subjects to collect sedentary sweat glucose, skin
temperature and RH over a period of 8 hours in compliance with the (IRB number 19-146) approved at the University of Texas
at Dallas. All subjects belonged to the age range of 18-40 years with no prior diagnosis of diabetes mellitus. Each subject was
made to follow the following schedule: The subject will come in at T0 and has breakfast at T0.5 and blood glucose measures
are taken at T0 and T1, where n is the number of hours for a time instant Tn. The subject will have lunch at T3, and the blood
glucose will be observed at T4. A final blood glucose measure will be taken at T8 to capture the fall in blood glucose over the
duration of experiment. The output of the proposed device and prediction system was validated against the interpolated sweat
glucose sample collected separately using a MacroDuct®sweat collector at above mentioned time points.

On-body measurement of human subjects
A written and informed consent was taken from all participants prior to sample collection. All enrolled subjects wore the devices
during the duration of the testing and continuous measurements were recorded in compliance with the protocol approved by
the IRB committee. The wearable sweat sensor device was placed on the antebrachial region (lower forearm) of the subject.
The human subjects were neither allowed to exert themselves physically nor their skin was excited using a sweat induction
method such as iontophoresis. This ensured a full passive generation of sweat to be sampled by AWARE. Continuous on-body
measurements sampled every minute for the duration of the testing and depending on the availability of the subject. The
concentration profile of the biomarker was reported over the entire time period of recording.

Acknowledgements
The authors acknowledge David Kinnamon and Paul Rice for technical support on sensor fabrication and mechanical design.

Author contributions statement
S.P. and S.M. conceived the experiments, K.C.L. and J.B. performed glucose sensor dose calibration, M.P. conducted the human
subject data collection and validation, D.S. conducted the electrical characterization test experiments, curated all human subject
data and created the AR model, all authors analyzed the results and reviewed the manuscript.

Additional information
Drs. Shalini Prasad and Sriram Muthukumar have a significant interest in Enlisense LLC, a company that may have a
commercial interest in the results of this research and technology. The potential individual conflict of interest has been reviewed
and managed by The University of Texas at Dallas, and played no role in the study design; in the collection, analysis, and
interpretation of data; in the writing of the report, or in the decision to send the report for publication. Authors D.S, M.P., K.C.L.
and J.B. declare no competing financial interests.

References
 1. Wang, J. Glucose biosensors: 40 years of advances and challenges. Electroanal. 13, 983 (2001).

                                                                                                                                8/14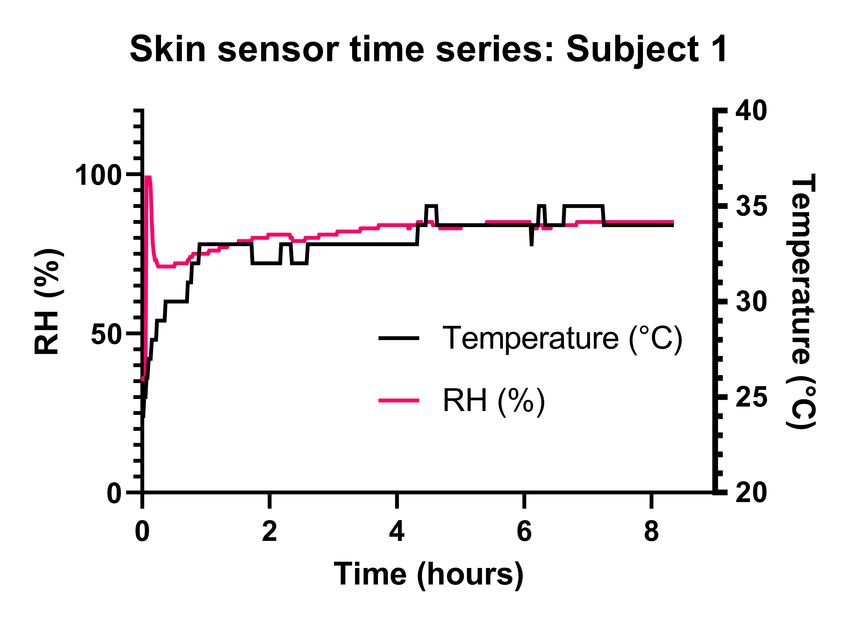
2. Lee, H. et al. A graphene-based electrochemical device with thermoresponsive microneedles for diabetes monitoring and
    therapy. Nat. nanotechnology 11, 566 (2016).
 3. Jalal, A. H., Umasankar, Y., Gonzalez, P. J., Alfonso, A. & Bhansali, S. Multimodal technique to eliminate humidity
    interference for specific detection of ethanol. Biosens. Bioelectron. 87, 522–530 (2017).
 4. Kim, J. et al. Noninvasive alcohol monitoring using a wearable tattoo-based iontophoretic-biosensing system. ACS Sensors
    1, 1011–1019 (2016).
 5. Gao, W. et al. Fully integrated wearable sensor arrays for multiplexed in situ perspiration analysis. Nat. 529, 509 (2016).
 6. Kinnamon, D., Selvam, A. P., Prasad, S. & Muthukumar, S. Electronic bracelet for monitoring of alcohol lifestyle. In 2016
    IEEE SENSORS, 1–3 (2016). DOI 10.1109/ICSENS.2016.7808598.
 7. Battelino, T. et al. Clinical targets for continuous glucose monitoring data interpretation: recommendations from the
    international consensus on time in range. Diabetes care 42, 1593–1603 (2019).
 8. Bard, A. J., Faulkner, L. R., Leddy, J. & Zoski, C. G. Electrochemical methods: fundamentals and applications, vol. 2
    (wiley New York, 1980).
 9. Munje, R. D., Muthukumar, S. & Prasad, S. Lancet-free and label-free diagnostics of glucose in sweat using zinc oxide based
    flexible bioelectronics. Sensors Actuators B: Chem. 238, 482 – 490 (2017). DOI https://doi.org/10.1016/j.snb.2016.07.088.
10. Sankhala, D., Muthukumar, S. & Prasad, S. A four-channel electrical impedance spectroscopy module for cortisol
    biosensing in sweat-based wearable applications. SLAS TECHNOLOGY: Transl. Life Sci. Innov. 0, 2472630318759257 (0).
    DOI 10.1177/2472630318759257. PMID: 29447045.
11. Hooge, F. N. 1/f noise sources. IEEE Transactions on Electron Devices 41, 1926–1935 (1994). DOI 10.1109/16.333808.
12. Johnson, J. B. Thermal agitation of electricity in conductors. Phys. Rev. 32, 97–109 (1928). DOI 10.1103/PhysRev.32.97.
13. Razavi, B. Design of Analog CMOS Integrated Circuits (McGraw-Hill, Inc., New York, NY, USA, 2001), 1 edn.
14. Hassibi, A., Navid, R., Dutton, R. W. & Lee, T. H. Comprehensive study of noise processes in electrode electrolyte
    interfaces. J. Appl. Phys. 96, 1074–1082 (2004). DOI 10.1063/1.1755429.
15. Barhoumi, A. et al. Correlations between 1/f noise and thermal treatment of al-doped zno thin films deposited by direct
    current sputtering. J. Appl. Phys. 115, 204502 (2014).
16. Noujaim, S. E., Horwitz, D., Sharma, M. & Marhoul, J. Accuracy requirements for a hypoglycemia detector: An analytical
    model to evaluate the effects of bias, precision, and rate of glucose change. J. Diabetes Sci. Technol. 1, 652–668 (2007).
    DOI 10.1177/193229680700100509. PMID: 19885133.
17. Walden, R. H. Analog-to-digital converter survey and analysis. IEEE J. on Sel. Areas Commun. 17, 539–550 (1999). DOI
    10.1109/49.761034.
18. Leal, Y. et al. Real-time glucose estimation algorithm for continuous glucose monitoring using autoregressive models. J.
    diabetes science technology 4, 391–403 (2010).
19. Reifman, J., Rajaraman, S., Gribok, A. & Ward, W. K. Predictive monitoring for improved management of glucose levels.
    J. diabetes science technology 1, 478–486 (2007).
20. Dash, D., Ferrari, P., Dutta, S. & Wang, J. Neurovad: Real-time voice activity detection from non-invasive neuromagnetic
    signals. Sensors 20, 2248 (2020).
21. Mhaskar, H. N., Pereverzyev, S. V. & van der Walt, M. D. A deep learning approach to diabetic blood glucose prediction.
    Front. Appl. Math. Stat. 3, 14 (2017).
22. Naumova, V., Pereverzyev, S. V. & Sivananthan, S. A meta-learning approach to the regularized learning—case study:
    Blood glucose prediction. Neural Networks 33, 181–193 (2012).
23. Sivananthan, S. et al. Assessment of blood glucose predictors: the prediction-error grid analysis. Diabetes technology &
    therapeutics 13, 787–796 (2011).
24. Pappada, S. M. et al. Neural network-based real-time prediction of glucose in patients with insulin-dependent diabetes.
    Diabetes technology & therapeutics 13, 135–141 (2011).

                                                                                                                          9/14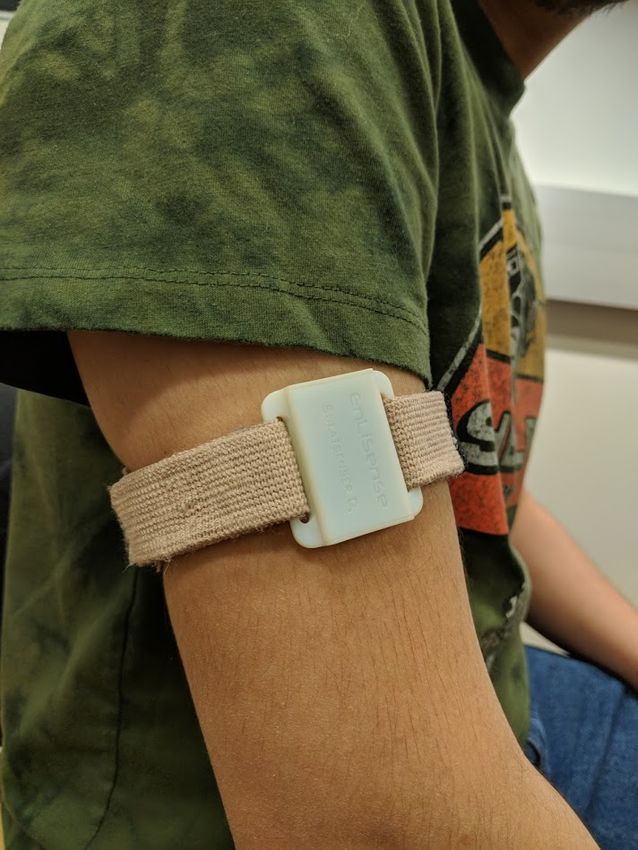
Antigen
Antigen Antibody
Antibody
Antigen Linker
Linker
Antibody
Electrode
Electrode
Polyamide
Polyamide
Linker
Electrode
Polyamide
Active
Active CC
ASA
ASA
Sensing
Sensing RR
ASA
ASA
Area
Area RR
ASA
ASA
CC
ASA
ASA
Active CASA 4kTR
4kTRZnO
ZnO
(ASA)
(ASA)
Sensing RASA
CASA
surface
surface
Area RASA
Electrode
Electrode
Skin
Skin
4kTRZnO k/(WLC
k/(WLC f)f)
(ASA) oxox
surface
Electrode CC
Skin
dldl k/(WLCoxf)
Polyamide
Polyamide CC
dldl RR
ctct 2zqI.M(ω)
2zqI.M(ω)
Cdl RR
ctct
Polyamide Cdl Rct 2zqI.M(ω)
Rct
Epidermis
Epidermis
Epidermis 4kT(R
4kT(R
electrode +R
electrode+R
s)s)
Antibody 4kT(Relectrode+Rs)
Antigen
RR
electrode
electrode
Relectrode RR
electrode
Relectrode electrode
+R
+R
+Rss
Linker +Rs +R
+R ss s
Electrode
Polyamide
(a) (b) (c) (d)
A
RASA
RASA CASA
4kTRZnO
Temp Glucose
PH k/(WLC
RH oxf) I2C level
Glucose
Glucose
Switch matrix
ANT Y sensor Cortex M3 (mg/dL)
level
level
4 Sensors
Cdl Rct 2zqI.M(ω) processor
Rct ACI SPI (mg/dL)
(mg/dL)
LiPo
DC/ battery
4kT(R +Rs) LDO USB AFE charger
DC electrodeLi-ion
battery
Relectrode
Relectrode+Rs
+Rs
(e) (f) (g)
Figure 1. 1a Detection mechanism of the glucose immunoassay on the sensor surface is created using glucose oxidase
antibody-antigen interaction in the presence of glucose oxidase enzyme. 1b Cross section of the sensor surface. 1c Equivalent
incremental circuit modeling arising from sensing mechanism. 1d Equivalent circuit model with respective sources of noise
added to the sensing mechanism. Disassembly of the wearable EIS device. 1e Block diagram of the proposed EIS device. 1f
The motherboard used for EIS experiments is equipped with an ADuCM350 SoC and nRF8001 Bluetooth Low Energy (BLE)
Glucose chip-set. The slide-in connector on the bottom allows for connecting sensors. 1g Wearable EIS device worn as a band.
level
(mg/dL)
10/14(a) (b)
Noise spectrum of sensor
10 -1
t = 5 mins
RMS Noise voltage (V)
10 -2
t = 10 mins
10 -3 t = 15 mins
Max noise at @100Hz
10 -4 t = 20 mins
t = 25 mins
10 -5
t = 30 mins
LSB of ADC
10 -6
10 -7
1 10 100 1000 10000
Frequency (Hz)
(c) (d)
Figure 2. Impedance of a universal test cell was measured using n = 3 replicates of the wearable EIS device. 2a Spread of
measured impedance across all device replicates at frequencies ranging from 80 Hz to 1 kHz demonstrate reasonable accuracy
with respect to the PSPICE simulated impedance. 2d Current consumption was measured for the proposed EIS device using
the Agilent N6705B power analyzer. Various operating modes of the device are shown with their characteristic current
consumptions. 2c Noise spectrum of a biosensor measured using a high speed potentiostat while introducing PBS on the
non-functionalized sensor surface. 2b Measured RMS noise amplitude of the sensor surface at 100 Hz shows a decrease in
cumulative sensor noise with time.
11/14(a) (b)
Figure 3. 3a Calibration dose response of the system using synthetic sweat buffer of various pH. 3b A box-whisker plot is
used to observe the true variability of a given dose concentration as a composite of all buffers used in the work.
12/14(a) (b)
(c) (d)
3
(e) (f)
Figure 4. 4a Autocorrelation plot for Zmod for subject 1. 4b Autocorrelation plot for Zmod for subject 2. 4c
Autocorrelation plot for dZmod for subject 1. 4d Autocorrelation plot for dZmod for subject 2. 4e Skin temperature and
relative humidity for subject 1. 4f Skin temperature and relative humidity for subject 2.
13/14(a) (b)
(c)
Figure 5. 5a Comparison of interpolated vs. RegARIMA sweat glucose concentrations for subject 1. 5b Comparison of
interpolated vs. RegARIMA sweat glucose concentrations for subject 2. 5c Histogram of residuals for ARIMA(10,0,3) model.
14/14You can also read