Analyzing the Support for Large Group Collaborations using Google Maps
←
→
Page content transcription
If your browser does not render page correctly, please read the page content below
1

                    Analyzing the Support for Large Group
                     Collaborations using Google Maps
                              Pedro Antunes1, Antonio Ferreira1, Gustavo Zurita2, Nelson Baloian3

                                           1
                                        Faculty of Sciences, University of Lisbon, Portugal
            2
                Management Control and Information Systems Department, Business School, Universidad de Chile, Chile
                                 3
                                   Department of Computer Science, Universidad de Chile, Chile

                                                                             The data collection was obtained from an experiment in
   Abstract—Group support systems are becoming quite popular.             which a team was requested to attain an urban design assign-
They are also instigating large groups of people into collaborative       ment. To complete the assignment, the team members had to
practices. But research on large group collaborations is still very       walk around a city area, finding design ideas to improve the
scarce, making it difficult to assess the benefits and drawbacks.         city living, sharing their ideas with the others, and then con-
This paper describes an empirical study with a group of 48 par-
                                                                          verging into a list with the 10 best ideas. Thus the collabora-
ticipants who used Google Maps to accomplish a collaborative
design task. The main research goal was to obtain quantitative
                                                                          tive setting involved what has been designated
and qualitative insights about large group collaborations. Vari-          geocollaboration: the integration of spatial data with decision
ous dimensions of group collaboration were studied, including             models, blending together the concepts of Geographical In-
group size, shared awareness, task monitoring, and coordination.          formation System (GIS) and GSS [5-7]. We will not discuss
The obtained results indicate that large groups face very signifi-        the specific characteristics of geocollaboration, as they have
cant coordination problems and difficulties converging and han-           been discussed elsewhere [3, 8].
dling the volume of information. But the study also points out               The analytic work in this paper is based on a collection of
that large group collaborations stimulate participation and task          quantitative and qualitative data gathered from questionnaires
synergy through positive reinforcements, constant feedback and
                                                                          filled out by the participants, and is grounded on a subset of
peer pressure.
                                                                          the design dimensions defined by Driskell [9] considering, in
  Index Terms—Group support systems, geocollaboration, large-             particular, group size, shared awareness, task monitoring, and
group collaboration.                                                      coordination.
                                                                             The paper is organized as follows. In the next section we
                         I. INTRODUCTION                                  provide a brief overview of the related work. Section 3 de-
The study of large group collaborations is relatively recent,             scribes the adopted research methodology. Section 4 describes
with researchers traditionally favoring smaller groups. For in-           the experiment. Sections 5 and 6 are dedicated to data analy-
stance, one of the most comprehensive reviews of Group Sup-               sis. Finally, Section 7 discusses the obtained results and future
port Systems (GSSs) reports that only 4% of the 200 studies               research directions.
considered group sizes with 10 or more people, and that 40%
used group sizes with 4 or fewer members [1].                                                  II. RELATED WORK
   Nevertheless, GSSs have in general been considered benefi-             In this section we overview the main research lines underlying
cial for medium and larger groups, from 6 up to 20 people [1].            the relatively few studies on large group collaborations that
One reason explaining the lack of studies with large groups is            have been reported in the literature.
that traditional GSSs present important technical and logistical             One research line is related with conversational knowledge.
problems to experimental research [2, 3].                                 Wagner [10] analyzed how various technologies support con-
   The emergence of a new generation of GSSs, where we may                versational knowledge creation and sharing, from email to
include Wikipedia, Facebook, LinkedIn, Doodle, Dropbox,                   Wikis. He characterizes collaboration support as a constant
Twitter, Zoho, Google Docs, and Google Maps, among others,                cycle of brainstorm/aggregate/feedback actions, emphasizing
completely changed the research panorama. All these systems               the difficulties finding knowledge, filtering knowledge from
rely on the Web infrastructure to support collaboration [4] and           noise and dynamically changing knowledge.
are popular, widely accessible, and always operational. Thus,                Computer-mediated communication and virtual communi-
many of the traditional logistical problems have been tamed.              ties of practice share many research issues with conversational
   In this paper we report on an empirical study in which                 knowledge. But their main focus is understanding the benefits
Google Maps was used to support a large team (48 partici-                 and drawbacks brought by the technology to social and cultur-
pants). The main purpose of this study was to obtain insights             al practices, encompassing issues such as group establishment,
on the impact of a large group on collaboration support, in-              community sustainability, power relationships, behavioral pat-
cluding the identification of technical and conceptual limita-            terns, and identity [11, 12].
tions.                                                                       Another research line is focused on social cognition to un-
                                                                          derstand how people remember, think, and reason as a group
  This paper was supported by the Portuguese Foundation for Science and   [13]. One important function considered by this perspective is
Technology (PTDC/EIA/102875/2008) and Fondecyt.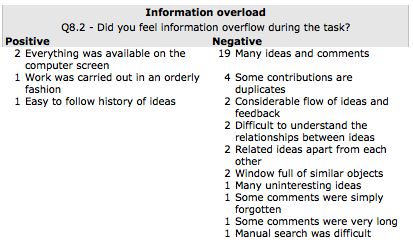
2

coordination. Sarma et al [14] identify several emergent coor-       ban design; b) the fact that people would need to wander
dination patterns ranging from communication and data/task           around and be dispersed in an urban area favors the ac-
management, information discovery and contextualization,             ceptance and use of information technology, and also facili-
and finishing with the ultimate goal designated continuous co-       tates the activity of larger groups, in contrast with room
ordination, which is yet to be determined by research.               meetings where people communicate in a face-to-face fashion
   Studies on virtual teams also give many insights about the        and the lack of space may be an issue; and c) the task would
mechanisms behind large group collaborations. For instance,          be conducted using Google Maps because it allows annota-
Hara et al [15] used social network analysis to identify four        tions to be associated with places, and also because of its con-
factors affecting scientific collaborations: incentives, socio-      tinuous availability and popularity, requiring only the minimal
technical infrastructure, work connections, and compatibility.       amount of user training.
These factors may serve to explain why in some cases collabo-           From these guidelines, we devised a naturalistic experiment
ration succeeds whereas in others it fails. Mark et al [16] also     and collected data from the questionnaires that the participants
highlight the important role of information bridges, that is,        filled out at the end, containing a mixture of questions that re-
people that help articulating work.                                  quired quantitative as well as open answers.
   The studies on Collaborative Virtual Environments (CVE)              We organized the questionnaires and the subsequent analy-
emphasize the technological challenges brought by large              sis in five major categories, namely group size, information
group collaborations. For instance, Benford et al [17] discuss       overload, awareness, usability, and participation, grounded on
the impacts caused by scalability and distributed architectures.     a subset of the design dimensions defined by Driskell [9].
Large-scale collaborative games are perhaps the most demand-            The strategy we adopted to analyze the results consisted in
ing type of CVE. Benford et al [18] highlight again the tech-        starting with an analysis of quantitative data and then using
nical difficulties in designing these systems.                       the open questions to validate the results and find additional
   The organizational studies of face-to-face and GSS meet-          insights. The responses to the open questions were sequential-
ings also contribute to understand large group collaborations.       ly analyzed and coded in two rounds, the first one aiming to
Thorpe and Albrecht [19] provide a good summary of this re-          identify relevant codes and the second one to revise codes and
search line, emphasizing three critical problems: defining clear     improve the quality of the coding process.
objectives for GSS use, aligning the technical possibilities of         The adopted coding strategy was a mix between grounded
GSS with the organizational goals, and obtaining critical mass       and start list [25]: the categories emerged during the coding
in GSS adoption.                                                     process but they were confined to two master codes, namely
   The research community has also been studying classroom           positive and negative factors. After the second round, the
collaborations but the studies typically contemplate small           number of occurrences of each code was counted. This served
teams (up to 5 students) working in large communities [20].          to quantitatively point out which codes were more relevant to
Alexander [21] recognizes that the lack of synergy is one of         the analysis.
the main problems with classroom collaboration.
   Collaborative design by large groups has also been investi-                           IV. THE EXPERIMENT
gated. In this context, Chiu [22] identified some of the funda-      In this section we describe in detail the experiment that was
mental technological requirements of design groups, namely           conducted to study the impact of a large group on collabora-
maintaining data consistency, supporting team awareness, and         tion support. The experiment involved students from an un-
visualizing processes.                                               dergraduate course undertaking a collaborative design
   We finish this overview of related work with a reference to       assignment to identify problems and/or opportunities in the
the paradox of group size. As posited by Oliver and Marwell          urban area where they study, and to propose innovative solu-
[23], the effect of group size on group activity is cost-based. If   tions based on information technology (IT). They were asked
the costs of collective action rise with group size, then large      to accomplish the assignment using Google Maps. This as-
groups will act less frequently than smaller ones. If the costs      signment was requested during the third week of classes of a
vary little with group size, then large groups will act more fre-    course given during the second semester of 2010.
quently than smaller groups. So, the impact of a large group
on collaboration support will definitely depend on the costs         A. Sample
brought by the technology.                                           The sample consisted of 48 students (26 were male; average
                                                                     age was 22.8) taking an undergraduate course on Computer
                      III. METHODOLOGY                               Science, in the eight semester of the career of Information and
To obtain insights on the impact of a large group on collabora-      Management Control Engineering, at the Faculty of Econom-
tion support we chose a group decision-making type of task.          ics and Business of Universidad de Chile. The general objec-
The use of GSS for this type of task has been found beneficial       tive of this course is to apply traditional and innovative IT in
for larger groups as participants tended to feel more satisfied      the implementation of organizational strategies.
and involved than when collaborating with fewer people [9,              It is expected that students at the end of the course are able
24].                                                                 to: a) detect problems and identify opportunities in the differ-
   We also considered a geocollaborative context, having in          ent components of the value chain of an organization, that may
mind the following points: a) the task would take place in a         be supported through IT; b) manage an IT strategy that can
naturalistic environment, where it is easier for people to be        introduce competitive advantages into an organization; c) de-
more interested and participative, which led to the topic of ur-
3
sign IT solutions; and d) develop communication and team- ordination mechanism for selecting the best ideas was indicat-
work skills. ed or recommended. The students were just told they should
The students who participated in the experiment had already use Google Maps. Roles, consensus, task awareness and coor-
passed through courses on programming, information systems dination mechanisms had to be resolved by themselves.
and databases. They were also knowledgeable about group-
D. Task Performance
ware tools; in particular, they were previously instructed on
how to use Google Maps, during 20 minutes, as training for Following the instructions, the students walked around the city
using groupware tools. area, identifying problems and opportunities, sharing their ide-
These students should be considered good users of compu- as with the others, and jointly setting-up a list of the best ide-
ting technology for the following reasons: a) 15 students use as. Most pictures were taken with mobile phones and uploaded
notebooks in classes, 7 use netbooks, 25 have smartphones, all in Google Maps later. The resulting documentation of the ac-
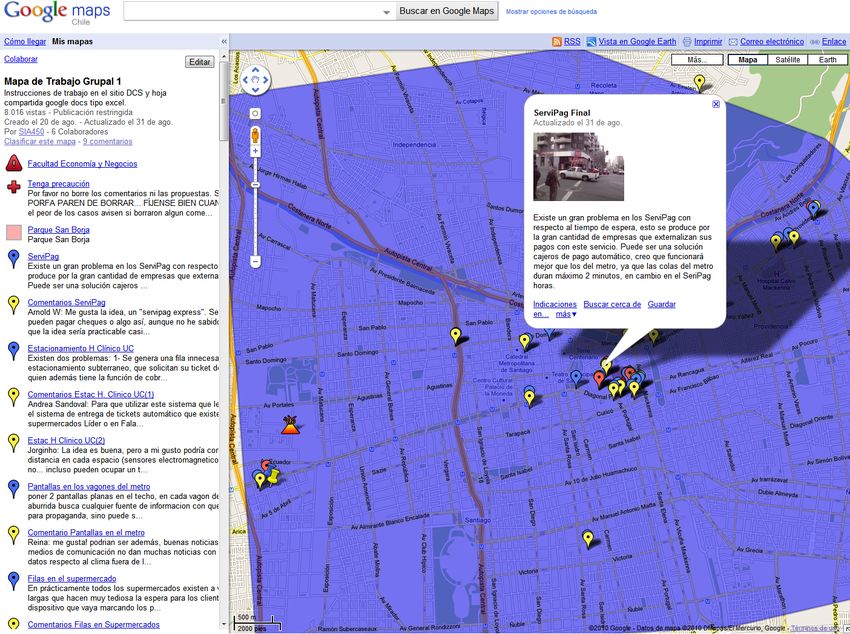
of them have a PC at home, and they also have access to com- tivities done with Google Maps may be seen in Figure
puters at the Faculty; b) they regularly use basic software, 1Error! Reference source not found..
such as text editors and spreadsheets, and specialized software
like business process management tools, statistical software,
database management systems and programming languages;
and c) they use several social media tools like Twitter, Face-
book, MSN and others.
B. Task Description
The task was performed collaboratively outside regular clas-
ses. All students were part of a single team. The teacher ex-
plained the task in the classroom, recommending the students
to carefully observe the area surrounding the faculty and to
identify problems, opportunities and ideas that may be ad-
dressed using IT.
The proposed ideas could be of various types, for example,
how IT may help people managing their daily life, improving
customer services in different places, supporting diverse tasks
performed by citizens while moving, and more.
The problems, opportunities and ideas should be georefer- Figure 1. A Google map collaboratively georeferenced by the 48 students. On
enced in Google Maps. Each student should deliver at least the left side, the list of problems, ideas and comments. Georeferences are dis-
played on the right side. Images are associated with problems.
two ideas. The students were also asked to discuss and give
their opinions on the classmates’ ideas; and they also had to During the week given to accomplish the task, the students
collaboratively choose the ten best ideas by mutual agreement. had three sessions where they all met face-to-face. During the
A document was given to the students describing the task: last 10 minutes of the second session, the students proposed
“Task Instructions. Go to the field (not necessarily with and agreed on the ways to specify an idea (title, related discus-
a computer) to analyze an urban area and bring new ideas sion, use of color conventions, and how to elect the best ide-
about technology use (these are mere examples of possi- as). Some ideas were also discussed during these sessions.
ble technologies, more creative ones are welcomed: pub- The students worked with the computers available at the
licity, vending machines, information kiosks, interactive Faculty and their own portable computers. Only five students
traffic information, etc.).” indicated having used smartphones to georeference a problem
in situ. The link to the georeferenced map of ideas created by
The document also detailed several task requirements: the students can be found in http://tiny.cc/vdce4.
“Task Details. 1) you must work on a specific area of E. Task Evaluation
Santiago; 2) you must use Google Maps in collaborative The course’s lecturer evaluated the group outcomes consider-
mode to georeference ideas; 3) the problems and ideas ing the quality of the best ideas chosen by the students. The
may be commented and supplemented with text, sketches individual outcomes were also evaluated in the following way:
and photos, as much as necessary to emphasize their im- minimum contribution of two ideas; quality of proposed ideas;
portance; 4) the whole work must be performed collabo- involvement in the discussion; and quality of the responses to
ratively; 5) you must take a picture of the place or the questionnaire. The final mark for the whole team was 6 (in
context where you identify a problem, georeferencing the the range of 1 to 7).
picture; and 6) the list of the 10 best ideas must be ac-
cepted by consensus by all of the participants.” F. Questionnaire
The students had one week to perform the task. Our study is based on a questionnaire responded by the partic-
ipants. Both quantitative and qualitative data have been col-
C. Technical Setup lected and analyzed. The analysis has been fairly grounded on
The students were given no instruction regarding the type of the design dimensions defined by Driskell [9], considering in
hardware to be used for this task. Neither a certain type of co-4
particular the group size, shared awareness, task monitoring Tables 2 and 3 while the qualitative results are summarized in
and coordination. Tables 4 up to 10.
The questionnaire consisted of 36 questions. Of these, seven TABLE 2. LIKERT RESULTS
questions required answers using a 5-point Likert scale1, four
questions required yes/no answers, and the remaining 25 ques-
tions were open. The list of questions is presented in Table 1.
TABLE 1. QUESTIONNAIRE
TABLE 3. YES/NO RESULTS
In the following, we discuss the combination of qualitative
and qualitative insights regarding group size, information
overload, awareness, usability and participation.
A. Group Size
98% of the respondents say that the group size impacts the
task. This is the highest correlation in the set of quantitative
questions shown in Table 2.
Q3.2 aimed to identify the main positive and negative fac-
tors brought by the group size. The obtained results, shown in
Table 4, identify more negative than positive factors, thus con-
firming the perceived correlation. The most significant nega-
tive factors are the impact of group size on task coordination,
difficulties reaching consensus and information losses due to
uncontrolled rewrites of the participants’ ideas and comments.
TABLE 4. GROUP SIZE
V. RESULTS
48 students participated in the experiment and answered the
questionnaire. The open questions generated a corpus with
about 33.600 words and 163.000 characters (without spaces). B. Information Overload
Thus on average each open question received an answer with 73% of the respondents felt information overflow. This may
135 characters, which indicates that the students carefully con- be associated with the group size and is consistent with 98%
sidered the assessment. The quantitative results are shown in of the respondents saying that group size impacts the task.
Q8.2 gives a better understanding of the problem (Table 5).
The qualitative responses indicate that the flow of ideas was
1
The Likert scale was the following: 5 – strongly agree; 4 – agree; 3 – very high, making it difficult to follow and easy to forget. Al-
neither agree nor disagree; 2 – disagree; and 1 – strongly disagree.5
so, the number of repeated ideas was considered high. Very that the tool eases collaboration. This indicates a mild senti-
few comments were given on the positive side. The most rele- ment towards the Google Maps’ usability.
vant observation was that the participants liked having all in- Q1.2 gives more insights about ease of use (Table 7). It re-
formation visible on the computer screen. veals several technical issues contributing to the perceived low
TABLE 5. INFORMATION OVERLOAD
usability. The most frequently cited one is a usability problem
related with uploading photos. Two other ones concern diffi-
culties discerning comments when their locations are very
proximate, and lack of information regarding who deleted oth-
ers’ comments.
Within the collection of negative factors, we also find refer-
ences to more conceptual problems regarding the task organi-
zation. In particular, the participants pointed out a disparity
between mapping and commenting ideas, the fact that com-
munication is not the primary focus of Google Maps, and the
need to improvise collaboration strategies, since the tool does
not offer clear support in that area.
TABLE 7. USABILITY: EASE OF USE
C. Awareness
The participants positively evaluated awareness support. 100%
of the respondents say that they could perceive the others’
comments and even 36% strongly agree with that statement.
Q6.2 gives more qualitative insights on awareness (Table
6). As expected, most of the comments were very positive, es-
pecially regarding the constructive approach that lead the par-
ticipants towards improving the others’ ideas, the focus on
good ideas, and the synergy towards task execution. The nega-
tive factors were mostly related with information overload.
We also note that the participants liked using colors and icons
to distinguish comments from ideas, and also having an unob-
trusive perspective of the ideas and comments being produced.
Question Q7 inquired further about the strategies adopted to Q4.2 reveals a large set of negative and positive factors re-
maintain awareness. The results (not tabulated) indicate a di- garding collaboration support, although with clear emphasis
versity of adopted strategies: using the left panel to follow on the negative side (Table 8). Within the negative factors,
comments, using the map to find new comments, checking on- two of them were very preeminent: the group had to develop a
ly the last comment, and using colors to identify new infor- coordination mechanism (using Google Docs), since the tool
mation. However, the most cited mechanism was a sheet built does not support one natively; and the problem that any partic-
with Google Docs to coordinate the group activities. Several ipant may modify or delete comments without control or roll-
participants referred that they checked the sheet various times back.
a day.
TABLE 8. USABILITY: COLLABORATION SUPPORT
TABLE 6. AWARENESS
D. Usability
For the purposes of this research we define usability as a com-
bination of ease of use and collaboration support. The com-
bined average score obtained by questions Q1.1 and Q4.1 was Within the positive factors, the most significant ones were
3.88 in a 5-point Likert scale (standard deviation 0.90), which the support for sharing ideas, obtaining and giving immediate
is relatively low. Furthermore, only 15% respondents strongly feedback about the ideas, and avoiding face-to-face interac-
agree that the tool is easy to use; and only 21% strongly agree tions.6
Q4.2 also highlights that besides having to devise an alter-
native scheme to collaborate the participants also had to des-
ignate a facilitator to manage the task.
E. Participation
We assessed participation as a combination of task involve-
ment, feeling being represented in the task outcomes and the
perceived value of tool usage. The combined average score
obtained by questions Q2.1, Q5.1 and Q17 was 4.25 in a 5-
point Likert scale (standard deviation 0.84).
Task involvement was the most positive factor identified by
the participants, with 100% saying that they felt involved. But
perceived value and representation were also very high, with Figure 2. Quantitative overview of evaluation results.
92% and 88% respondents saying these factors were high or
very high. These results show that participation is the most positive
The qualitative comments obtained with Q2.2 highlight the factor associated with the tool. The main reasons were at-
most significant contributors to perceived value (Table 9): the tributed by the participants to the geographical context
tool gives context to the problem, helps locating problems, and brought by the tool to the problem, associated with mental im-
offers a mental image of the task. aging and global perspective. But we should also emphasize
that the tool seems to promote a constant involvement in the
TABLE 9. PARTICIPATION: PERCEIVED VALUE task through paced information feedback, to a point where the
participants felt peer pressure towards task accomplishment.
The participants also regarded in a very positive way the
tool’s awareness support. Again, awareness seems to be a
combination between technical features and social constructs.
Within the list of technical features we highlight the use of
icons and colors to differentiate ideas from comments, and the
capacity to overview the task information in one single win-
dow. The social constructs resound the positive factors
brought by participation, such as the capacity to promote task
involvement and synergy. It thus seems that awareness and
Q5.2 points out several positive contributions to the partici-
participation positively reinforce each other.
pants’ involvement in the task (Table 10): there was a constant
The most negative factors affecting the tool usage were
flow of feedback information between the participants and
group size and information overload. Although the tool sup-
strong involvement in the ideas. It is also interesting to note
ports large groups, it also seems to become affected by clut-
that the tool seems to promote peer-pressure and a fast pace
tered information and “laggy” interactions. Information
towards accomplishing the task goals.
overload emerges as the most significant problem associated
TABLE 10. PARTICIPATION: TASK INVOLVEMENT with the tool, having received 90% negative assessments, the
most polarizing of the criteria that have been analyzed.
But what is perhaps more surprising is that the tool seems to
be affected by the lack of coordination mechanisms capable to
manage large groups and considerable information flows. This
is quite surprising if we consider that coordination manage-
ment has been one of the foundational problems addressed by
CSCW research, for which many solutions have already been
experimented.
Of course the experimental results also highlight that specif-
ic measures should be taken to support large groups. It is par-
VI. DETAILED ANALYSIS ticularly clear that the tool needs to promote strategies to reach
In Figure 2 we present a quantitative analysis of the results consensus among large groups. And the results also point out
obtained by the experiment. It shows the differentials between very clearly that a large amount of information is difficult to
the positive and negative factors discussed in the previous sec- follow and act upon. Thus again, the tool needs to promote
tion, considering the number of occurrences of each coded strategies to handle large amounts of information.
statement, and averaging the several criteria adopted to ana- The tools’ usability also tends towards the negative side.
lyze usability and participation. However, in this case we should bring forward again the dis-
tinction between collaboration support and ease of use. Re-
garding collaboration support, the differential ratio is 70% on
the positive and 30% on the negative side, while regarding
ease of use the positive and negative factors are 50% for each
side. We thus may say that the tool was regarded as having7
many usability problems that, to some extent are compensated synergy, positive reinforcements, the constant feedback, the
by many advantages brought by collaboration support. The diversity of ideas, the peer pressure, and the fast pace set for
most important drawbacks brought by the participants consid- collaboration. And all of these positive factors seem to be re-
er, again, the lack of basic mechanisms necessary to coordi- lated with the group size.
nate users and manage shared information. The usability criteria used in our research, which we de-
In Figure 3 we present a qualitative summary of the exper- fined as a combination of ease of use and collaboration sup-
imental results. This summary was constructed by analyzing port, specifically addresses the challenges raised by combining
the participants’ responses at a second level of analysis, seek- the positive effects derived from large group collaborations
ing for more generic meaning. In this second level of analysis with the negative effects caused by having so many interac-
we identify four fundamental forces influencing the tool’s per- tions, large amounts of data and unsatisfactory data manage-
ception by the participants: global view, contextualization, in- ment. Future research in this area could attempt to derive a
formation flows and coordination. model and measuring instrument to formally evaluate the im-
The global view is mostly influenced by the capacity to pact of group size on the usability of collaborative systems.
know the others’ ideas while having access to that information This research also points out some important challenges as-
in a non-linear way, supported by geographical references. sociated with the integration of map-based and communica-
However, having too many ideas makes it difficult to analyze tion-based collaborations. The experimental results indicate
and respond. that maps provide a global and dynamic view of the problem,
The relationships between mapping and communication allow placing ideas in context, offer a strategy to aggregate
contribute to contextualize the information, but we find the comments, and at the same offer non-linear access to infor-
drawback that ideas may extend beyond one single place, or mation. But the results also indicate that the users still find it
not be at all related with a place. The information flows con- unnatural to organize their discussions in a spatial context, es-
tribute to create synergy among the group, where feedback in- pecially when the discussions extend beyond a specific loca-
formation serves to build ideas upon the contributions from tion. Further technical developments are also necessary to
others, and serves to sustain the participants’ commitment to improve access to large amounts of information in small dis-
the task. play areas.
Coordination also emerges in this qualitative perspective as
a striking problem, not only because of technical limitations, REFERENCES
which impel the participants to build social strategies to over- [1] J. Fjermestad and S. Hiltz, "An assessment of group support
come them, but also because converging seems to be a diffi- systems experimental research: Methodology and results," Journal
cult social process. of Management Information Systems, vol. 15, pp. 7-149, 1999.
[2] P. Antunes, V. Herskovic, S. Ochoa, and J. Pino, "Structuring
Dimensions for Collaborative Systems Evaluation," ACM
Computing Surveys, vol. to appear, forthcoming.
[3] P. Antunes and P. André, "A Conceptual Framework for the
Design of Geo-Collaborative Systems," Group Decision and
Negotiation, vol. 15, pp. 273-295, 2006.
[4] G. Mark, "Large-scale distributed collaboration: Tension in a new
interaction order," in Computerization movements and technology
diffusion: From Mainframes to Ubiquitous Computing, M. Elliot
and K. Kraemer, Eds. Medford, NJ: Information Today, Inc., 2008,
pp. 289-310.
[5] P. Antunes , C. Sapateiro, G. Zurita, and N. Baloian, "Integrating
Spatial Data and Decision Models in a E-Planning Tool," in
Groupware: Design, Implementation, and Use. 16th CRIWG
Conference on Collaboration and Technology, Maastricht, The
Netherlands. vol. 6257 Heidelberg: Springer-Verlag, 2010, pp. 97-
112.
Figure 3. Qualitative overview of the evaluation results. [6] P. Antunes, G. Zurita, and N. Baloian, "A Model for Designing
Geocollaborative Artifacts and Applications " in Groupware:
Design, Implementation, and Use. 15th Collaboration
VII. DISCUSSION AND FUTURE RESEARCH Researchers’ International Workshop on Groupware, CRIWG
2009, Douro, Portugal. vol. 5784, L. Carriço, N. Baloian, and B.
We finally discuss the outcomes of this study and their possi- Fonseca, Eds. Heidelberg: Springer-Verlag, 2009, pp. 278-294.
ble implications for future research. Our first observation is [7] A. MacEachren, G. Cai, R. Sharma, I. Rauschert, I. Brewer, L.
that the impact of group size on the tool’s functionality is very Bolelli, B. Shaparenko, S. Fuhrmann, and H. Wang, "Enabling
significant. As the group size increases, the problems start to Collaborative Geoinformation Access and Decision-Making
through a Natural, Multimodal Interface," International Journal of
emerge. And they do not only appear as technical problems Geographical Information Science, vol. 19, pp. 293-317, 2005.
but also as social issues. The lack of coordination support is [8] M. Armstrong, "Requirements for the Development of GIS-Based
representative of the former, while the difficulties dealing with Group Decision Support Systems," Journal of the American
large amounts of information and converging towards a com- Society for Information Science, vol. 45, pp. 669-677, 1994.
[9] J. Driskell and E. Salas, "Groupware, Group Dynamics, and Group
mon ground are representative of the later. Performance," in Creating High Technology Teams C. Bowers, E.
So, currently, Google Maps seems most adequate for small Salas, and F. Jentsch, Eds. Washington, DC: American
group collaboration. Yet, there are plenty opportunities linked Psychological Association, 2006, pp. 11-34.
with large group collaborations. From the experiment reported
in this paper, it is striking to observe the value attributed to8
[10] C. Wagner, "Wiki: A Technology for Conversational Knowledge
Management and Group Collaboration," Communications of the
Association for Information Systems, vol. 13, pp. 265-289, 2004.
[11] C. Johnson, "A survey of current research on online communities
of practice," The Internet and Higher Education, vol. 4, pp. 45-60,
2001.
[12] S. Wilson and L. Peterson, "The Anthropology of Online
Communities," Annual Review of Anthropology, vol. 31, pp. 449-
467, 2002.
[13] E. Chi, "The Social Web: Research and Opportunities," Computer,
vol. September, 2008.
[14] A. Sarma, D. Redmiles, and A. van der Hoek, "The Coordination
Pyramid: A Perspective on the State of the Art in Coordination
Technology," IEEE Computer, to appear.
[15] N. Hara, P. Solomon, S. Kim, and D. Sonnenwald, "An Emerging
View of Scientific Collaboration: Scientists’ Perspectives on
Collaboration and Factors that Impact Collaboration," Journal of
the American Society for Information Science and Technology, vol.
54, pp. 952-965, 2003.
[16] G. Mark, S. Abrams, and N. Nassif, "Group-to-Group Distance
Collaboration: Examining the “Space Between”," in Proceedings
of the eighth conference on European Conference on Computer
Supported Cooperative Work, Helsinki, Finland, 2003, pp. 99-118.
[17] S. Benford, C. Greenhalgh, T. Rodden, and J. Pycock,
"Collaborative virtual environments," Communications of the
ACM, vol. 44, pp. 79-85, 2001.
[18] S. Benford, D. Rowland, M. Flintham, A. Drozd, R. Hull, J. Reid,
J. Morrison, and K. Facer, "Life on the Edge: Supporting
Collaboration in Location-Based Experiences," in Proceedings of
the SIGCHI conference on Human factors in computing systems,
Portland, Oregon, 2005, pp. 721-730.
[19] J. Thorpe and C. Albrecht, "Characteristics of Large Group
Support Systems," in Proceedings of the 37th Hawaii International
Conference on System Sciences, Hawaii, 2004.
[20] K. Fisher, R. Phelps, and A. Ellis, "Group Processes Online:
Teaching collaboration through collaborative processes,"
Educational Technology & Society, vol. 3, pp. 484-495, 2000.
[21] P. Alexander, "Virtual teamwork in very large undergraduate
classes," Computers & Education, vol. 47, pp. 127-147, 2004.
[22] M. Chiu, "An organizational view of design communication in
design collaboration," Design Studies, vol. 23, pp. 187-210, 2002.
[23] P. Oliver and G. Marwell, "The Paradox of Group Size in
Collective Action: A Theory of the Critical Mass," American
Sociological Review, vol. 53, pp. 1-8, 1988.
[24] A. Dennis, J. Valacich, and J. Nunamaker, "An experimental
investigation of the effects of group size in an electronic meeting
environment," IEEE Transactions on Systems, Man and
Cybernetics, vol. 20, pp. 1049-1057, 1990.
[25] M. Miles and A. Huberman, Qualitative Data Analysis. Thousand
Oaks, California: SAGE, 1994.You can also read