Chronic Jet Lag Exacerbates Jejunal and Colonic Microenvironment in Mice - Frontiers
←
→
Page content transcription
If your browser does not render page correctly, please read the page content below
ORIGINAL RESEARCH
                                                                                                                                                 published: 01 June 2021
                                                                                                                                         doi: 10.3389/fcimb.2021.648175

                                             Chronic Jet Lag Exacerbates
                                             Jejunal and Colonic
                                             Microenvironment in Mice
                                             Qing Li , Bo Wang , Hong-Yi Qiu , Xiu-Juan Yan , Li Cheng , Qian-Qian Wang
                                             and Sheng-Liang Chen *

                                             Division of Gastroenterology and Hepatology, Renji Hospital, Shanghai Institute of Digestive Disease, School of Medicine,
                                             Shanghai Jiao Tong University, Shanghai, China

                                             Background: Evidence suggests that circadian rhythm disorder is associated with a
                                             variety of gastrointestinal diseases, and the circadian rhythm plays a key role in
                                             maintaining the homeostasis of intestinal flora. The underlying mechanisms are still not
                                             completely identified. This study was aimed to explore whether jet lag-caused circadian
                                             disruption influences gut microbiome and its metabolites.
                           Edited by:
                  Andrew T. Gewirtz,         Methods: Mice were synchronized with 12-h light/dark cycles (control group) or
              Georgia State University,      subjected to daily 8-h advance of the light/dark cycle for every 3 days (jet-lagged
                        United States
                                             group). Four months later, fecal samples and jejunal contents were collected and
                       Reviewed by:
              Christopher B. Forsyth,        analyzed by 16S rRNA gene sequencing. In addition, fecal samples were subjected to
        Rush University, United States       metabolome analysis with ultra-performance liquid chromatography coupled to tandem
                         Ankur Naqib,
        Rush University, United States
                                             mass spectrometry (UPLC-MS/MS).
                Robin Michelle Voigt,        Results: The results of 16s rRNA sequencing showed that chronic jet lag led to
        Rush University, United States
                                             decreased microbial abundance, richness, and diversity in both feces and jejunal
                   *Correspondence:
                    Sheng-Liang Chen         contents. ANOSIM analysis revealed significant difference between control and jet-
               slchenmd@hotmail.com          lagged groups. As the colonic microbiome, the abundance of Bacteroidetes phylum
                                             was significantly decreased and that of Actinobacteria phylum was increased in jet-lagged
                  Specialty section:
        This article was submitted to
                                             mice. Jet lag increased the ratio of Firmicutes to Bacteroidetes, an indicator for the
   Microbiome in Health and Disease,         imbalance of gut microbiota. Metabolome analysis of fecal samples showed that the levels
              a section of the journal
                                             of tryptophan and its derivatives were decreased in jet-lagged mice. In addition,
             Frontiers in Cellular and
               Infection Microbiology        fecal levels of secondary bile acids changed under jet lag conditions. Correlation
          Received: 08 January 2021          analysis identified associations between tryptophan (and its derivatives) levels and
            Accepted: 29 April 2021          colonic microbiota.
           Published: 01 June 2021

                                 Citation:
                                             Conclusions: This study presents a comprehensive landscape of gut microbiota and its
                 Li Q, Wang B, Qiu H-Y,      metabolites in mice subjected to chronic jet lag. The results suggest that circadian
        Yan X-J, Cheng L, Wang Q-Q           disruption may lead to changes in fecal and jejunal microbiota and fecal metabolites.
         and Chen S-L (2021) Chronic
      Jet Lag Exacerbates Jejunal and        Moreover, our results demonstrate a novel interplay between the gut microbiome
   Colonic Microenvironment in Mice.         and metabolome.
Front. Cell. Infect. Microbiol. 11:648175.
       doi: 10.3389/fcimb.2021.648175        Keywords: colon, jejunum, jet lag, metabolites, microbiota

Frontiers in Cellular and Infection Microbiology | www.frontiersin.org               1                                          June 2021 | Volume 11 | Article 648175
Li et al.                                                                                                                       Gut Microbiota and Metabolites

INTRODUCTION                                                                           2) bile acids, synthesized in the liver from cholesterol and
                                                                                       transformed by intestinal microbiota into the secondary bile
Many modern human life activities, such as nocturnal social                            acids (Sayin et al., 2013); and 3) tryptophan (Try) and its
activities, shift work, and jet lag (JL), can cause circadian rhythm                   derivatives, including indole, kynurenine, and downstream
disturbance and thus increase the risk of developing                                   products [e.g., 5-hydroxytryptamine (5-HT)] (Agus et al., 2018).
cardiovascular diseases, metabolic syndromes, and cancer, as a                         Several studies have demonstrated interactions between microbial
result of influencing the circadian clock (Rijo-Ferreira and                            metabolites and circadian rhythms (Alvarez et al., 2020;
Takahashi, 2019). Moreover, a large population in the world is                         Matenchuk et al., 2020). However, currently very few studies
suffering from sleep disorders, which may lead to circadian                            have examined the global changes in gut microbial metabolites
misalignment (Potter et al., 2016). Night shift is associated                          upon circadian rhythm disturbance.
with more severe gastrointestinal (GI) symptoms (Caruso                                    In the present study, using a mouse model of long-term (4
et al., 2004). Circadian rhythm disturbance can also impair                            months) JL (Thaiss et al., 2014), we investigated the influence of
intestinal barrier function and aggravate alcohol-induced                              circadian disruption on intestinal microbiome of both the middle
hepatic pathology and inflammation (Summa et al., 2013; Gao                             (the jejunum) and lower (the colon) digestive tract. We also
et al., 2019).                                                                         observed the changes in microbial metabolites in jet-lagged mice
    The intestinal microorganisms are the second genome of the                         and explored the correlation of gut microbiota
human body with a number that is 10 times larger than that of                          and metabolomics.
total somatic and germ cells of mammals (Hooper and
Macpherson, 2010). The homeostasis of intestinal microbiota is
essential for GI function and human health. They can also
                                                                                       MATERIALS AND METHODS
interact with the brain via gut microbiota-brain axis (Mayer
et al., 2015). It has been demonstrated that host circadian                            Animals
disruption can result in the dysbiosis of the gut (such as the                         Male C57BL/6J mice (8–10 weeks old) were purchased from
large intestine) microbiota (Thaiss et al., 2014; Gao et al., 2019).                   Shanghai Laboratory Animal Center, Chinese Academy of
Small intestinal microbes also have essential physiological effects                    Science (Shanghai, China). The animals were housed in a
on the host (Tuganbaev et al., 2020). Research has shown that the                      constant temperature room (22–24°C) and allowed to
jejunum, as the middle third of the small intestine, contains a                        acclimatize to the animal facility environment for 2 weeks
distinctive bacterial population that differs from that in the                         before the experimentation, with food and water ad libitum. In
colon, which plays a major role in absorption of carbohydrates,                        the normal rhythm group, mice were kept under strict 12 h light/
amino acids, small peptides, and vitamins from nutritional                             12 h dark cycles with lights being turned on at 6 a.m. and turned
sources (Sundin et al., 2017). However, little is known about                          off at 6 p.m. In the JL group, jet lag was induced according to the
the effect of circadian disruption on jejunal microorganisms.                          procedure described in earlier studies (Thaiss et al., 2014), in
    Gut microbes are regarded as a metabolic “organ” or a virtual                      which mice were subjected to daily 8-h advance of the light/dark
endocrine organ (Evans et al., 2013). Indeed, bioactive molecules                      cycle for every 3 days. Briefly, mice were shifted between normal
produced or transformed by gut microorganisms interact with the                        light conditions (lights on at 6 a.m. and off at 6 p.m.) and an 8-h
host physiology and trigger responses locally and remotely                             time in advance (lights on at 10 p.m. and off at 10 a.m.) every 3
(Michaudel and Sokol, 2020). It was demonstrated that gut                              days. During the process of modelling, both control mice and jet-
microbiota had their own diurnal oscillations in composition                           lagged mice were fed with a standard chow diet (Purina
and function, and the microbes and their metabolites might be                          Laboratory Rodent Diet #5001). After 4 months, the stool
associated with the detrimental consequences of circadian                              samples and jejunal contents of mice were collected into sterile
disturbance for host metabolism (Thaiss et al., 2014; Alvarez                          1.5 mL Eppendorf microcentrifuge tubes (Corning, NY, USA).
et al., 2020). Microbiota-generated metabolites bridge the host-                       The collection of mouse jejunal contents was conducted in the
microbiota interactions and may be essential for human                                 clean bench. The jejunum was cut open with a sterile ophthalmic
physiology. They may also affect the susceptibility of the host to                     scissor and the contents were collected gently with sterile
obesity, diabetes, and immune-mediated diseases (Thaiss et al.,                        tweezers. The fresh pellets and jejunal contents were
2014; Rooks and Garrett, 2016). Currently, the role of the                             immediately frozen in liquid nitrogen and stored at -80°C. All
following three kinds of microbial metabolites in host-                                experimental protocols conformed to the National Institutes of
microbiota interactions have attracted attention of researchers:                       Health (NIH) Guidelines for the Care and Use of Laboratory
1) short-chain fatty acids (SCFAs), produced by gut bacteria                           Animals and were approved by the School of Medicine, Shanghai
during the fermentation of dietary fibers (Tan et al., 2014);                           Jiao Tong University.

Abbreviations: JL, Jet lag; IBD, inflammatory bowel disease; Try, tryptophan;           16S rRNA Gene Sequencing and
IAId, indole-3-carboxaldehyde; CA, cholic acid; NorCA, norcholic acid; MCA,
muricholic acids; LCA, lithocholic acid; UDCA, ursodeoxycholic acid; HDCA,
                                                                                       Data Analysis
hyodeoxycholic acid; OTU, operational taxonomic unit; LDA, linear discriminant         DNA was extracted from the samples using a QIAamp Fast DNA
analysis; LEfSe, effect size; PCA, principal component analysis, PCoA, principal       Stool Mini Kit (Qiagen, CA, USA) according to Manufacturer’s
coordinate analysis; NMDS, nonmetric multidimensional scaling.                         instructions. The concentration of bacterial DNA was measured

Frontiers in Cellular and Infection Microbiology | www.frontiersin.org             2                                   June 2021 | Volume 11 | Article 648175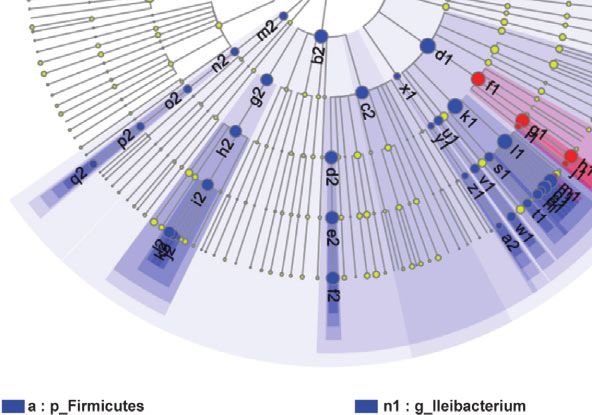
Li et al.                                                                                                              Gut Microbiota and Metabolites

using a NanoDrop 2000 spectrophotometer (Thermo Scientific,                   standards were added to the wells on the left. Finally, the plate
USA). Afterwards, the 16S rRNA genes were amplified with the                  was sealed for analysis. All the standards were obtained from
bacterial primer pair 338F-806R flanking the V3–V4 region                     Sigma–Aldrich (MO, USA).
using FastPfu Polymerase. Amplicons were then purified by gel
extraction (AxyPrep DNA GelExtraction Kit, Axygen                            UPLC-MS/MS
Biosciences, CA, USA) and quantified using QuantiFluor-ST                     An ultra-performance liquid chromatography coupled to
(Promega, Madison, WI, USA). Paired-end sequencing was                       tandem mass spectrometry (UPLC-MS/MS) system
performed using an Illumina MiSeq system (Illumina, CA,                      (ACQUITY UPLC-Xevo TQ-S, Waters Corp., MA, USA) was
USA). High-throughput pyrosequencing of PCR products was                     used to analyze 11 targeted metabolites of interest. We used
then performed on the free online platform of Majorbio Cloud                 UPLC columns including an ACQUITY HPLC BEH C18 1.7 µm
Platform (www.majorbio.com).                                                 VanGuard pre-column (2.1 × 5 mm) and an ACQUITY HPLC
    Sequencing reads were demultiplexed and filtered.                         BEH C18 1.7 µm analytical column (2.1 × 100 mm) to perform
Operational taxonomic units (OTUs) were picked at 97%                        chromatographic separation of fecal samples at a constant
similarity cutoff, and the identified taxonomy was then aligned               temperature of 40°C. The injection volume of sample was 5 µL.
using the Greengenes database (Version 13.8). The relative                   The mobile phases: eluent A was 0.1% formic acid in water, and
species abundance in each group was evaluated based on the                   eluent B was acetonitrile/IPA (70:30). The gradient elution
rank-abundance curves, and alpha-diversity index (Shannon and                condition was: 0–1 min (5% B), 1–11 min (5–78% B), 11–13.5
Simpson) was analyzed. For beta-diversity analysis, principal                min (78–95% B), 13.5–14 min (95–100% B), 14–16 min (100%
component analysis (PCA), principal coordinate analysis                      B), 16–16.1 min (100-5% B), 16.1–18 min (5% B). The flow rate
(PCoA), and nonmetric multidimensional scaling (NMDS)                        was set at 0.40 mL/min. For mass spectrometer, capillary: 1.5
were performed using Quantitative Insights into Microbial                    (ESI+), 2.0 (ESI-) Kv; source temperature: 150°C; desolvation
Ecology (QIIME) 1.9.1. Difference between groups was tested                  temperature: 550°C; desolvation gas flow: 1000 L/h. The quality
using analysis of similarities (ANOSIM). For the analysis of                 control samples were prepared along with the test samples and
differences in bacterial composition, we used student t test with            run after each 14 samples to ensure reproducibility.
P < 0.05 as a threshold. The calculated P value underwent False                  For data analysis, the raw data files generated by UPLC-MS/MS
Discovery Rate (FDR) correction and FDR P < 0.05 was                         were processed with MassLynx software (Version 4.1, Waters, MA,
considered statistically significant. From phylum to genus, the               USA) to perform peak integration, calibration, and quantitation for
biomarkers in the two groups were quantitatively analyzed by the             each metabolite. The powerful package R studio was used for
linear discriminant analysis (LDA) effect size (LEfSe) analysis.             statistical analysis. PCA, partial least square discriminant analysis
The LEfSe analysis, with the LDA threshold of >2, was performed              (PLS-DA), and orthogonal partial least square discriminant analysis
using the non-parametric Kruskal-Wallis (KW) test to recognize               (OPLS-DA) were used for classification and identification of
the most differently abundant taxa.                                          differently altered metabolites. Potential biomarkers of differential
                                                                             metabolites were characterized by variables with a variable influence
Sample Preparation for Targeted                                              on projection (VIP) > 1 and P < 0.05 in the Student t test or
Metabolomics Profiling                                                        Wilcoxon test. Z-transform was conducted to observe the
Targeted metabolomics analysis of fecal samples was performed                distribution of different metabolites between groups. The pathway
by Metabo-Profile Biotechnology (Shanghai, China), according                  enrichment analysis was performed using pathway impact and
to the methods described previously (Choi et al., 2020; Xie et al.,          hypergeometric test. Also, Spearman’s rank correlation analyses
2021). Briefly, the fecal samples were thawed on ice. About 5 mg              were conducted to explore the correlation between metabolites and
of each sample was added to 25 mL of ultrapure water and                     gut microbiota.
homogenized with zirconium oxide beads for 3 min before
addition of methanol (120 mL) containing the internal
standard to extract the metabolites. Then the samples were                   RESULTS
homogenized for another 3 min and centrifuged at 18,000g for
20 min. The supernatants (20 mL for each sample) were                        Effect of JL on Colonic Microbiota
transferred to a 96-well plate. The following procedures were                We used 16S rRNA high-throughput sequencing to determine
performed on an Eppendorf epMotion Workstation (Eppendorf                    whether circadian disruption influenced colonic microbiota.
Inc., Hamburg, Germany). The freshly prepared derivative                     Sequencing analysis of fecal microbe revealed 551,482 raw reads.
reagents (20 mL) were added to each well. The plate was sealed,              Based on the 97% similarity level, all the effective reads were
and the derivatization was carried out at 30°C for 60 min. After             clustered into operational taxonomic units (OTUs). According to
derivatization, 330 mL of ice-cold 50% methanol solution was                 the histogram of species analysis on OTU level (Figure 1A), the
added to dilute the samples. Then, the plate was stored at –20°C             Con and JL groups had 345 identical OTUs. In addition, 128 OTUs
for 20 min, followed by centrifugation (at 4000g) at 4°C for                 exclusively belonged to the Con group, while only 82 OTUs
30 min. Thereafter, 135 mL of the supernatant for each sample                belonged to the JL group. Rank-Abundance curves (Figure 1B)
was transferred to a new 96-well plate with 10 mL of internal                showed that the relative abundance of colonic microbiota was
standards in each well. Serial dilutions of derivatized stock                decreased in the JL group. Moreover, as shown in Figures 1C, D

Frontiers in Cellular and Infection Microbiology | www.frontiersin.org   3                                    June 2021 | Volume 11 | Article 648175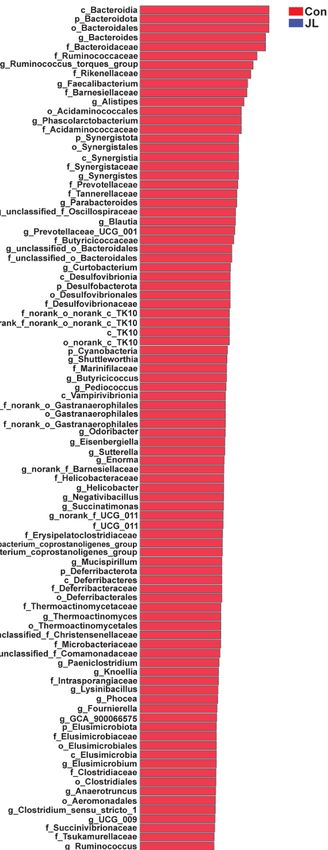
Li et al.                                                                                                                       Gut Microbiota and Metabolites

                          A                                                       B

                          C                                                       D

                          E                            F                     G                         H

  FIGURE 1 | Comparison of bacterial components, abundance, a-diversity (Shannon index and Simpson index), ANOSIM analysis, and b-diversity (PCA, PCoA, and
  NMDS) based on OTU level in colonic microbiota of normal rhythm mice (Con; n = 6) and jet-lagged mice (JL; n = 5). (A) The number of OTUs in Con and JL
  groups. The identical OTUs in two groups were marked in dark blue. (B) Rank-abundance curves indicate the abundance of colonic microbiota of two groups.
  (C) Shannon index, and (D) Simpson index of Con and JL groups. (E) ANOSIM analysis between two groups. (F) PCA, (G) PCoA, and (H) NMDS analysis of colonic
  microbiota. Values are presented as the means ± SEM. a-diversity was assessed by student’s t test and b-diversity was assessed by ANOSIM analysis.

on a-diversity analysis, the community diversity of the colonic                   (P = 0.011, FDR P = 0.16) and Prevotellaceae_Ga6A1_group (P =
microbiota was decreased in JL group. Quantitative analysis showed                0.011, FDR P = 0.16) showed a tendency to decrease in the JL group
that Shannon index was decreased by 11.9% (P = 0.040). Simpson                    (Figure 2C). These results suggested that JL suppressed the
index showed a tendency to increase (by 65.1%, P = 0.078). As                     abundance, richness, and diversity of colonic microbiota but
shown in Figure 1E, the results of ANOSIM indicated that the                      increased the F: B ratio. Finally, LEfSe analysis was performed to
colonic microbial structure was significantly different between the                identify specific bacteria associated with JL. The results showed that
two groups (R = 0.813 and P = 0.003). b-diversity analysis (PCA,                  Erysipelotrichales, Erysipelotrichaceae, Bacilli, Ileibacterium,
PCoA, NMDS) revealed a distinct clustering of colonic microbiota                  Turicibacter, Actinobacteriota, and Bifidobacteriaceae dominated
in the two groups (ANOSIM analysis; P = 0.003; Figures 1F–H).                     in the JL group (Figures 3A, B).
Next, the phylum-level analysis indicated that the relative
abundance of Bacteroidetes phylum was significantly decreased                      Effect of JL on Jejunal Microbiota
(P = 0.002, FDR P = 0.016). The abundance of Actinobacteria                       The results of 16S rRNA high-throughput sequencing showed
was increased in the JL group (P = 0.00002, FDR P = 0.00032) and                  that jejunal microbiota might also be affected by JL. Sequencing
that of Firmicutes showed a tendency to increase (P = 0.014, FDR                  analysis revealed 569,943 raw reads. According to a 97%
P = 0.070) for FDR P were greater than 0.05 (Figure 2A). As shown                 similarity level, all effective reads were clustered into OTUs.
in Figure 2B, the ratio of Firmicutes to Bacteroidetes (F:B) was                  Figure 4A shows species distribution in the Con and JL groups
increased in the JL group (P = 0.031). On genus level, we chose the               on OTU level. The two groups have 913 identical OTUs. Further,
top 18 abundance genus for analysis. The relative abundance of                    216 OTUs exclusively belonged to the Con group, while 77 OTUs
Bifidobacterium (P = 0.000078, FDR P = 0.0054) was significantly                    belonged to JL group. Rank-abundance curves revealed that the
increased in the JL group. The abundance of Turicibacter (P = 0.003,              richness of the jejunal microbiota was decreased by JL
FDR P = 0.086), Ileibacterium (P = 0.0067, FDR P = 0.15) and                      (Figure 4B). In addition, a-diversity analysis showed an overt
Eubacterium_fissicatena_group (P = 0.018, FDR P = 0.18) showed a                   difference in jejunal microbiota between the Con and JL groups.
tendency to increase. The abundance of norank_f_Muribaculaceae                    Shannon index was significantly decreased by 29.6% (P = 0.029)

Frontiers in Cellular and Infection Microbiology | www.frontiersin.org        4                                        June 2021 | Volume 11 | Article 648175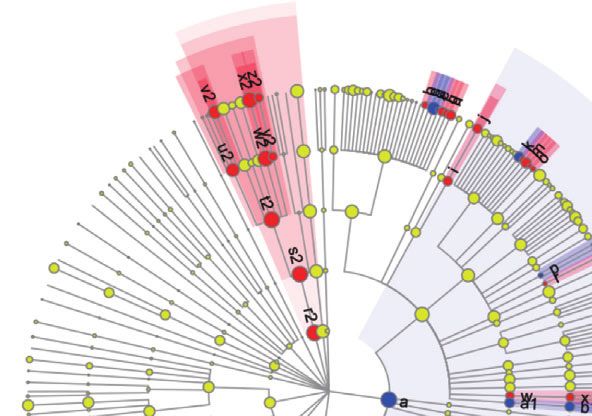
Li et al.                                                                                                                            Gut Microbiota and Metabolites

                              A                                                                      B

                              C

  FIGURE 2 | The differences of colonic microbiota between Con (n = 6) and JL (n = 5) groups. (A) Community barplot on phylum level of each group. (B) Ratio of
  Firmicutes to Bacteroidota. (C) Community barplot on genus level (top 18) of Con and JL groups. Differences were assessed by student’s t test.

(Figure 4C), while Simpson index was markedly increased by                           P = 0.34), and Faecalibacterium (P = 0.018, FDR P = 0.34)
167.7% (P = 0.036) in the JL group (Figure 4D). As is shown in                       showed a tendency to decrease after JL. All the P values were
Figure 4E, the results of ANOSIM analysis revealed a significant                      greater than 0.05 after FDR correction, indicating the changes of
difference between two groups (R = 0.2773, P = 0.033). b-                            jejunal microbiota caused by chronic JL may be relative slight
diversity analysis showed an obvious clustering of jejunal                           compared with colonic microbiota. Furthermore, LEfSe analysis
microbiota composition between Con and JL groups using                               was performed to recognize the specific microbiota related to JL
PCoA and NMDS analyses (Figures 4G, H), while no obvious                             (Figures 6A, B). Five types of bacteria dominated in JL group,
separation of the two groups was observed using PCA analysis                         including Erysipelotrichaceae, Erysipelotrichales, Ileibacterium,
(Figure 4F). These results suggested that JL could affect the                        Turicibacter, and Faecalibaculum. These results indicated that,
abundance, richness, and diversity of jejunal microbiome.                            besides colonic microbiota, the bacterial community of jejunum
According to the community analysis, JL tended to decrease                           might also be affected by chronic JL treatment.
the relative abundance of Bacteroidota phylum (P = 0.046, FDR
P = 0.18) in the jejunal microbiota. The abundance of Firmicutes                     Influence of JL on Fecal Metabolites
showed a tendency to increase in the JL group, with no                               The fecal metabolome represents a functional readout of the
statistically significant difference (Figure 5A). Chronic JL                          activity of gut microbiome, and thus can serve as an intermediary
caused an increase in the ratio F: B (P = 0.032) (Figure 5B).                        phenotype reflecting the host-microbiome interactions (Liu
Further, on the genus level, Figure 5C showed that the                               et al., 2020). We subsequently analyzed the fecal metabolites of
abundance of Ileibacterium (P = 0.046, FDR P = 0.34) showed                          Con and JL mice using a targeted UPLC-MS/MS based
a tendency to increase in the JL group, while the abundance of                       metabolomics approach. As shown in Figure 7A, the relative
Streptococcus (P = 0.028, FDR P = 0.34), Bacteroides (P = 0.010,                     abundance of fecal metabolites in JL mice was different from that
FDR P = 0.34), Ruminococcus_torques_group (P = 0.027, FDR                            in the Con group. The abundance of amino acids (14.11% vs

Frontiers in Cellular and Infection Microbiology | www.frontiersin.org           5                                         June 2021 | Volume 11 | Article 648175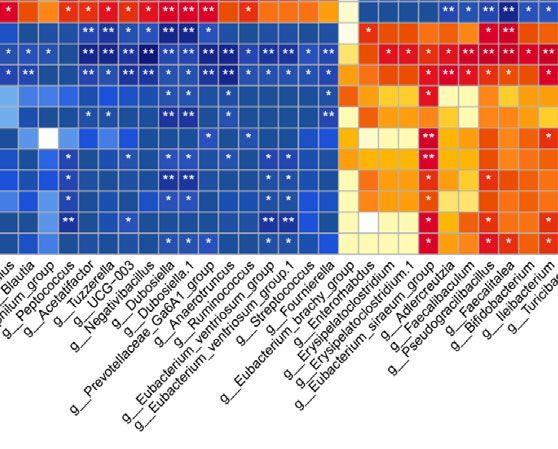
Li et al. Gut Microbiota and Metabolites
A B
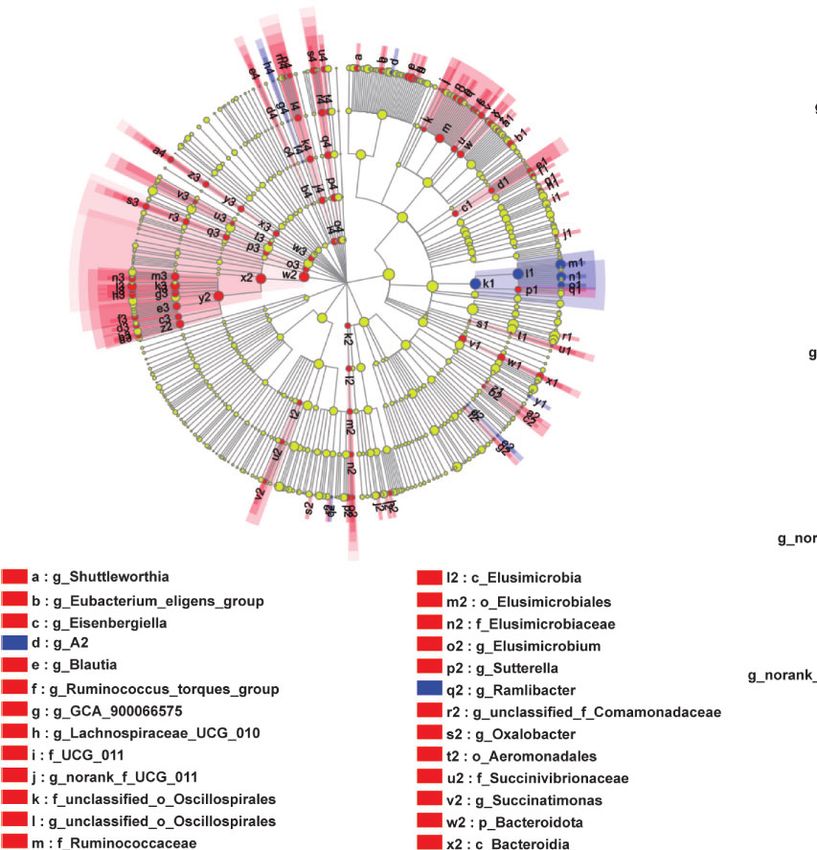
FIGURE 3 | LEfSe analysis of colonic microbiota in Con and JL groups. (A) Cladogram indicating the enriched taxa of colonic microbiome in Con (n = 6) and JL
(n = 5) groups. The central point represents the root of the tree (Bacteria), and each ring represents the next lower taxonomic level (phylum to genus: p, phylum; c,
class; o, order; f, family; g, genus). The diameter of each circle represents the relative abundance of the taxon. The different taxon was assessed by non-parametric
factorial Kruskal-Wallis (KW) sum-rank test. (B) Taxa with a different abundance in the colonic microbiota between Con and JL groups are indicated. A cut‐off value ≥
2.0 was used for the linear discriminant analysis (LDA).
30.04%, P = 0.006), indoles (0.11% vs 0.20%, P = 0.008), peptides mentioned results and pathway clustering analysis shown in
(0.06% vs 0.11%, P = 0.006) and phenylpropanoids (0.03% vs Figure 8C, we subsequently explored Try and its derivatives,
0.05%, P = 0.013) in fecal metabolites were decreased in the JL bile acids, and itaconic acids. Among them, Try had the largest
group compared with the Con group. The abundance of impact value. Compared with the control group, the levels of Try
carbohydrates and SCFAs was similar between two groups. (1001.46 ± 343.55 vs 2185.52 ± 502.33 nmol/g, P = 0.0014), indole-
In addition, the results of PCA and PLS-DA analysis showed 3-carboxaldehyde (IAId; 802.04 ± 509.31 vs 1937.13 ± 553.35
apparently distinct clustering of fecal metabolites (Figures 7B, C). nmol/g, P = 0.0065), and indole-3-methyl acetate (2.86 ± 2.49 vs
Based on the results of both univariate and multivariate statistical 7.98 ± 4.59 nmol/g, P = 0.047) were all significantly decreased in
analyses for the differential metabolites, 52 potential biomarkers the JL group (Figures 8D–F). Bile acids are also important
which have biological significance were obtained (Figure 7D). A bacterial metabolites in the intestine. Via gut microbiome–
scatter plot and a heatmap of Z scores were obtained after the Z- mediated metabolism, the primary bile acids are transformed
transform of each biomarker (Figures 8A, B). Based on the above- into the secondary bile acids, namely deoxycholic acid (DCA),
Frontiers in Cellular and Infection Microbiology | www.frontiersin.org 6 June 2021 | Volume 11 | Article 648175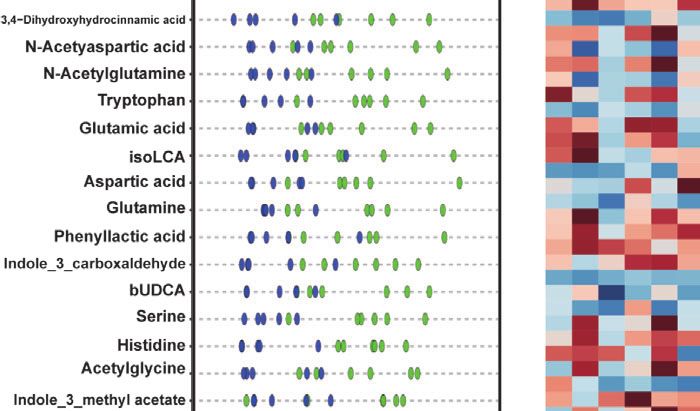
Li et al.                                                                                                                            Gut Microbiota and Metabolites

                            A                                                            B

                            C                                                        D

                            E                          F                        G                         H

  FIGURE 4 | Comparison of bacterial components, abundance, a-diversity (Shannon index and Simpson index), ANOSIM analysis, and b-diversity (PCA, PCoA, and
  NMDS) based on OTU level in jejunal microbiota of normal rhythm mice (Con; n = 6) and jet-lagged mice (JL; n = 5). (A) Histogram shows the number of OTUs in the
  Con and JL group. (B) Rank-abundance curves. (C) Shannon index and (D) Simpson index of Con and JL groups. (E) ANOSIM analysis between two groups.
  (F) PCA, (G) PCoA, and (H) NMDS analysis of jejunal microbiota. Values are presented as the means ± SEM. a-diversity was assessed by student’s t test and
  b-diversity was assessed by ANOSIM analysis.

lithocholic acid (LCA) and ursodeoxycholic acid (UDCA) (Bajor                        only change the microbiome of both jejunum and colon but also
et al., 2010; Jia et al., 2018). The results showed that compared                    disturb the concentration of fecal metabolites.
with Con group, the levels of the secondary bile acids and their
hepatic microsomal metabolites, such as isoalloLCA (3.58 ± 1.54                      Correlation Analysis of Colonic Microbiota
vs 22.19 ± 14.66 nmol/g, P = 0.030), b-UDCA (23.34 ± 13.22 vs                        and Fecal Metabolites
59.05 ± 24.44 nmol/g, P = 0.045), isoLCA (10.57 ± 8.09 vs 23.88 ±                    We subsequently analyzed the correlation between colonic
11.03 nmol/g, P = 0.047), 6-ketolithocholic acid (59.40 ± 47.09 vs                   microbiota and its metabolites (Figures 9A, B). On phylum level,
316.31 ± 142.46 nmol/g, P = 0.0043), hyodeoxycholic acid                             the abundance of Try was negatively correlated with that of
(HDCA; 224.18 ± 98.07 vs 1594.63 ± 870.24 nmol/g, P =                                Actinobacteriota (r = -0.76, P = 0.016). The abundance of IAId, a
0.0043), b-HDCA (38.45 ± 15.97 vs 276.91 ± 145.94 nmol/g,                            downstream product of Try, was positively correlated with that of
P = 0.0043), and taurine-hyodeoxycholic acid (THDCA; 2.27 ±                          Bacteroidetes (r = 0.82, P = 0.0068). On the genus level, Try level was
1.78 vs 33.83 ± 37.83 nmol/g, P = 0.0043) were decreased in the                      positively correlated with abundance of Prevotellacea UCG-003
jet-lagged mice (Figures S1A–G). Whereas, the levels of other                        (r = 0.68, P = 0.030), Negativibacillus (r = 0.78, P = 0.0084),
secondary bile acids, such as a-muricholic acids (aMCA; 953.74 ±                     Dubosiella (r = 0.81, P = 0.0041), Prevotellaceae_Ga6A1_group
298.75 vs 494.93 ± 340.21 nmol/g, P = 0.041) and bMCA (828.47 ±                      (r = 0.89, P = 0.00065), Anaerotruncus (r = 0.87, P = 0.00095),
336.09 vs 382.51 ± 269.34 nmol/g, P = 0.045), as well as the levels                  Ruminococcus (r = 0.76, P = 0.016), Eubacterium_ventriosum_group
of the primary bile acids such as cholic acid (CA; 585.34 ± 317.84                   (r = 0.77, P = 0.0096), Streptococcus (r = 0.77, P = 0.0099), and
vs 181.05 ± 132.39 nmol/g, P = 0.044) and norcholic acid (NorCA;                     Fournierella (r = 0.75, P = 0.013). On the contrary, it was negatively
39.52 ± 16.41 vs 9.32 ± 12.48 nmol/g, P = 0.017), were increased in                  correlated with the abundance of bacteria including Enterorhabdus
the jet-lagged mice (Figures S1H–K). The level of itaconic acid,                     (r = -0.75, P = 0.018), Erysipelatoclostridium (r = -0.85, P = 0.0035),
which is a major physiological regulator of the global metabolic                     Eubacterium_siraeum_group (r = -0.81, P = 0.0041), Adlercreutzia
rewiring, was decreased in JL group (2.79 ± 0.63 vs 8.28 ± 5.37                      (r = -0.68, P = 0.030), Faecalibaculum (r = -0.70, P = 0.026),
nmol/g, P = 0.0043) (Figure S2). Therefore, chronic JL could not                     Pseudogracilibacillus (r = -0.71, P = 0.022), Faecalitalea (r = -0.69,

Frontiers in Cellular and Infection Microbiology | www.frontiersin.org           7                                         June 2021 | Volume 11 | Article 648175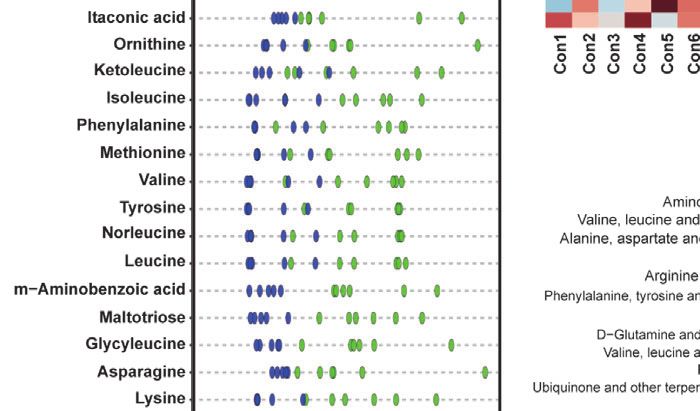
Li et al.                                                                                                                               Gut Microbiota and Metabolites

                            A                                                                         B

                            C

  FIGURE 5 | The differences of jejunal microbiota between Con (n = 6) and JL (n = 5) groups. (A) Community barplot on phylum level of each group in jejunum.
  (B) Ratio of Firmicutes to Bacteroidota. (C) Proportion of top 15 bacteria on genus level of Con and JL groups. Differences were assessed by student’s t test.

P = 0.028), Bifidobacterium (r = -0.85, P = 0.0035), Ileibacterium                      variety of factors, such as environment, diet, and medications.
(r = -0.81, P = 0.0082), and Turicibacter (r = -0.75, P = 0.012). The                  The present study showed that JL-induced circadian disruption
level of IAId was positively correlated with the abundance of                          might exacerbate jejunal and colonic microenvironment via
Peptococcus (r = 0.75, P = 0.012), Acetatifactor (r = 0.66, P = 0.036),                influencing gut microbes and their metabolism. Our results, in
Prevotellacea UCG-003 (r = 0.74, P = 0.014), Negativibacillus (r = 0.70,               line with those of previous studies (Thaiss et al., 2014; Gao et al.,
P = 0.026), Dubosiella (r = 0.86, P = 0.0015), Prevotellaceae_                         2019), suggested that gut microbial dysbiosis, which may lead to
Ga6A1_group (r = 0.78, P = 0.0075), Anaerotruncus (r = 0.83,                           metabolic imbalance, might be an important mechanism in
P = 0.0028), Ruminococcus (r = 0.82, P = 0.0068), Eubacterium_                         circadian disturbance-related human diseases.
ventriosum_group (r = 0.88, P = 0.00085), Streptococcus (r = 0.72,                         As for colonic microbiome, we found that, similar to the
P = 0.020), and Fournierella (r = 0.76, P = 0.01). However, it was                     results of the previous studies (Thaiss et al., 2014), chronic jet lag
negatively correlated with the abundance of Eubacterium_                               caused dysbiosis of microbial community. In the present study,
siraeum_group (r = -0.87, P = 0.0011), Pseudogracilibacillus                           16s rRNA sequencing revealed that the abundance, richness, and
(r = -0.71, P = 0.022), Bifidobacterium (r = -0.72, P = 0.024),                         diversity of colonic microbiota were decreased in the jet-lagged
Ileibacterium (r = -0.68, P = 0.035), and Turicibacter (r = -0.64,                     mice. Moreover, induction of jet lag increased the F:B ratio, an
P = 0.047).                                                                            indicator for the imbalance of gut microbiota (De Luca and
                                                                                       Shoenfeld, 2019; Crovesy et al., 2020; Grigor’eva, 2020; Stojanov
                                                                                       et al., 2020). Studies have shown that obese animals and humans
DISCUSSION                                                                             had a higher F:B ratio compared with normal weight individuals
                                                                                       (Magne et al., 2020). It should be noted that examining the F:B
The gut microbiota and its metabolites play a key role in                              ratio is only one way to assess changes in the microbiome as a
mammalian physiology. Gut microbiome can be disturbed by a                             whole and other factors need to be considered. We also found

Frontiers in Cellular and Infection Microbiology | www.frontiersin.org             8                                          June 2021 | Volume 11 | Article 648175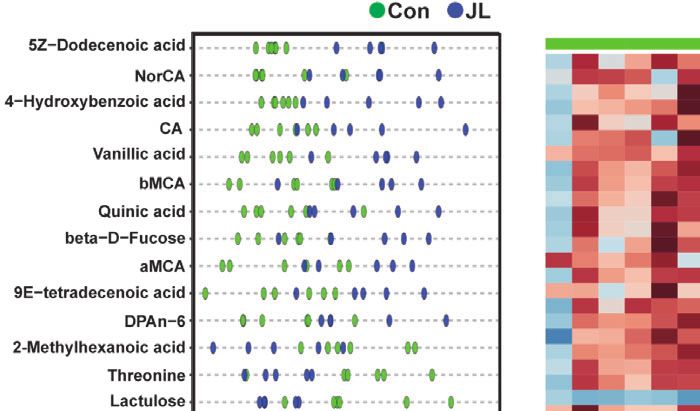
Li et al.                                                                                                                               Gut Microbiota and Metabolites

                            A                                                          B

  FIGURE 6 | LEfSe analysis of jejunal microbiota in Con (n = 6) and JL (n = 5) groups. (A) Taxonomic cladogram obtained from LEfSe analysis. The different taxon
  was assessed by non-parametric factorial Kruskal-Wallis (KW) sum-rank test. Different taxa are highlighted by colored circles and shaded areas. The diameter of
  each circle reflects the abundance of that taxa in the community. (B) Taxa with a different abundance in the jejunal microbiota between Con or JL groups. A cut‐off
  value ≥ 2.0 was used for the linear discriminant analysis (LDA).

that the abundance of Actinobacteria phylum was increased in                           effects in many GI diseases (Hidalgo-Cantabrana et al., 2017;
jet-lagged mice. Moreover, the abundance of Bifidobacterium                             Cukrowska et al., 2020). This is contradictory to our findings
genus, which belongs to Actinobacteria phylum was also                                 showing that JL worsened the intestinal microenvironment.
increased after JL. It has been reported that the members of                           Therefore, it was supposed that Actinobacteria and
this genus are regarded as probiotic demonstrating therapeutic                         Bifidobacterium might play a minor role in correcting the

Frontiers in Cellular and Infection Microbiology | www.frontiersin.org             9                                          June 2021 | Volume 11 | Article 648175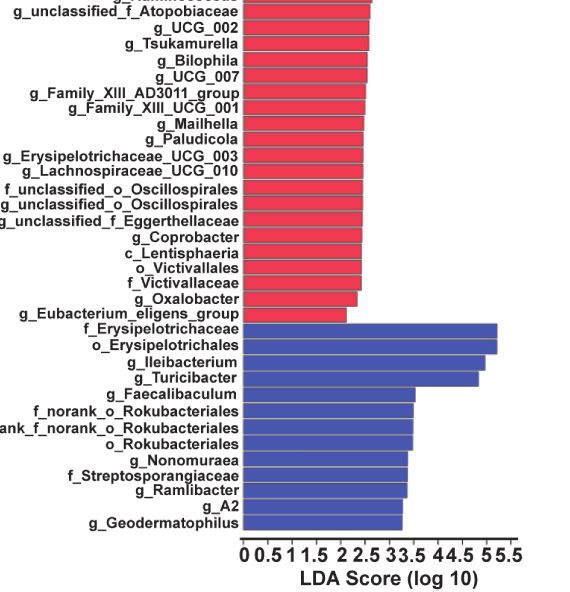
Li et al.                                                                                                                             Gut Microbiota and Metabolites

                         A

                         B                                          C                                         D

  FIGURE 7 | The difference of fecal metabolites between Con (n = 6) and JL (n = 5) groups. (A) Histogram showing abundance of different kinds of fecal metabolites
  in two groups. Differences between two groups were assessed by student’s t test or Wilcoxon test. (B) PCA and difference analysis on both dimensions. (C) PLS-
  DA analysis on both dimensions. (D) Venn diagrams of differential metabolites screened by multi-dimensional (PLS-DA) and single-dimensional. Single-dimensional
  was performed by student’s t test or Wilcoxon test.

perturbation of gut microbiome in jet-lagged mice because they                        microbial metabolism might be at least partially affected by
only held a small percentage of the whole gut bacteria (Binda                         abnormal rhythm. Therefore, we subsequently performed
et al., 2018). However, further work is required to confirm this                       targeted UPLC-MS/MS based metabolomics analysis of fecal
hypothesis. On genus level, another bacterium that attracted                          samples to examine whether circadian rhythm disturbance
attention is Turicibacter. Studies have shown that Turicibacter                       affects microbial metabolites. The analysis results revealed
might belong to a hypothetical pro-inflammatory group, and                             similar abundance of carbohydrates and SCFAs between Con
ketogenic diet can reduce the relative abundance of Turicibacter                      and JL groups. Notably, the fecal concentration of amino acids
(Ma et al., 2018). Our results showed that the abundance of the                       was decreased in JL group. Among various amino acids, Try is
bacterium Turicibacter was increased in jet-lagged mice,                              one of the essential amino acids for human body. Studies have
indicating JL might produce potential pro-inflammatory effect.                         shown that perturbations in Try metabolism may be implicated
    The effect of circadian disruption on jejunal microorganisms                      in human diseases, such as IBD, metabolic syndrome, and
is not clear. We therefore explored whether JL influences the                          neuropsychiatric diseases (Agus et al., 2018). Try has been
jejunal microbiota. Similar to the results of colonic microbiome,                     reported to alleviate colitis caused by dextran sodium sulfate
the abundance, richness, and diversity of jejunal microbiota were                     (Islam et al., 2017). IAId is a microbial Try derivative.
also decreased in the jet-lagged mice. However, it seemed that                        Lactobacillus reuteri (L. reuteri) and Lactobacillus. L. johnsonii
chronic JL had a slight impact on the jejunal microbiome based                        in the intestine can produce IAId (Zelante et al., 2013; Hou et al.,
on FDR adjusted P values. The F:B ratio was also increased in                         2018). IAld was reported to be a direct effector of L. reuteri to
jejunum in jet-lagged mice, indicating the dysbiosis of gut                           protect the integrity of intestinal mucus and motivate epithelial
microbiota in the middle GI tract after JL treatment.                                 hyperplasia. Therefore, Try and IAId might play a protective role
    Since the jet-lagged mice demonstrated disturbed                                  in intestinal inflammation (Hou et al., 2018). We found that the
homeostasis of gut microbiota, we hypothesized alterations in                         fecal levels of both Try and IAId were decreased in JL group.

Frontiers in Cellular and Infection Microbiology | www.frontiersin.org           10                                         June 2021 | Volume 11 | Article 648175
Li et al. Gut Microbiota and Metabolites
A B
D
E
C
F
FIGURE 8 | Potential biomarkers of Con (n = 6) and JL (n = 5) groups. (A) Scatter plot of Z scores in each group. (B) Heatmap of Z scores in each group. Blocks in
red and blue denote high and low z-score values of potential biomarkers, respectively. (C) Bubble chart of pathway analysis of differential metabolites. (D–F) The
concentrations of tryptophan and its derivatives in Con and JL group. (D) Tryptophan, (E) Indole-3-carboxaldehyde, (F) Indole-3-Methyl acetate. Differences were
assessed by student’s t test.
Moreover, correlation analysis identified associations between changes in the fecal levels of bile acids. Notably, the
the levels of tryptophan and its derivatives and colonic concentrations of several secondary bile acids and their
microbiota. In the present study, LEfSe analysis revealed that metabolites, such as isoalloLCA [a LCA derivative that was
Lactobacillus dominates in Con group, which might partially reported to regulate host immune responses (Hang et al.,
explain our observations that the content of IAId was higher in 2019)], were decreased in jet-lagged mice. Studies have shown
Con group than JL group. Collectively, these results indicate that a relationship between bile acids and liver inflammation, colitis,
supplementation of Try and IAId might provide a protective or carcinoma (Jia et al., 2018). Therefore, it is possible that the
effect on the impairment of intestinal barrier caused by disturbed bile acid metabolism could contribute to dysfunction
chronic JL. and dysbiosis of the whole intestine under jet-lagged conditions.
Primary bile acids, including chenodeoxycholic acid (CDCA) Itaconic acid plays an anti-inflammatory role during
and CA, are secreted by liver into the small intestine to ensure macrophage activation and liver ischemia–reperfusion injury
assimilation of dietary lipids. With 95% of them actively (Lampropoulou et al., 2016). In the present study, the fecal
reabsorbed in the terminal ileum, the rest are predominantly level of itaconic acid was decreased in JL group. Therefore, the
transformed by bacteria into secondary bile acids (LCA and anti-inflammation mechanism could be mitigated under jet-
DCA, respectively) via deconjugation and 7a-dehydroxylation in lagged conditions as a result of reduced itaconic acid level.
colon, where they are passively absorbed or excreted into feces Taken together, the results suggested that chronic circadian
(Bajor et al., 2010). We found that chronic JL led to obvious misalignment might exacerbate gut microenvironment in both
Frontiers in Cellular and Infection Microbiology | www.frontiersin.org 11 June 2021 | Volume 11 | Article 648175Li et al. Gut Microbiota and Metabolites
A B
FIGURE 9 | Heatmap of Spearman’s correlation coefficients between colonic microbiota and fecal metabolites on phylum level (A) and on genus level (B). Blocks in
red and blue denote high and low correlation coefficients, respectively. *P < 0.05, **P < 0.01.
jejunum and colon. The related microbes and their metabolites ETHICS STATEMENT
were analyzed in jet-lagged mice in order to provide new
potential therapeutic targets for alleviating GI dysfunction of All experimental protocols conformed to the Guide for the Care
human physiology caused by aberrant circadian rhythms. and Use of Laboratory Animals [National Institutes of Health
However, the mouse model of circadian rhythm disorder we (NIH), MD, USA] and were approved by the School of Medicine,
used might not fully simulate the characteristics of modern Shanghai Jiao Tong University.
lifestyle changes. Therefore, our results may not completely
reflect the changes caused by the disturbance of human
biorhythm. In addition, the protective effect of these bacteria AUTHOR CONTRIBUTIONS
and their metabolites need further exploration. Another
limitation is that the sample size in this study was relatively QL designed the research, analyzed the data and wrote the
small, and a bias might exist in analyzing gut microbiome and manuscript. BW, H-YQ, X-JY, LC, and Q-QW performed and
metabolomics. Therefore, future studies with larger sample size participated in the experiments. S-LC obtained the funding and
are needed. revised the manuscript. All the authors contributed to the article
and approved the submitted version.
DATA AVAILABILITY STATEMENT
FUNDING
The original research showed in our study are publicly available.
This data can be found on this website after release date: https:// This work was supported by grants from the National Natural
www.ncbi.nlm.nih.gov/sra/PRJNA719228, and the SRA number Science Foundation of China (No. 81970473, 81670484,
is SRP313173. 81970472, 82000487, 81470812, and 81500412).
Frontiers in Cellular and Infection Microbiology | www.frontiersin.org 12 June 2021 | Volume 11 | Article 648175Li et al. Gut Microbiota and Metabolites
ACKNOWLEDGMENTS SUPPLEMENTARY MATERIAL
The authors would like to thank all the reviewers who participated The Supplementary Material for this article can be found online
in the review and MJEditor (www.mjeditor.com) for its linguistic at: https://www.frontiersin.org/articles/10.3389/fcimb.2021.
assistance during the preparation of this manuscript. 648175/full#supplementary-material
REFERENCES Lampropoulou, V., Sergushichev, A., Bambouskova, M., Nair, S., Vincent, E. E.,
Loginicheva, E., et al. (2016). Itaconate Links Inhibition of Succinate
Agus, A., Planchais, J., and Sokol, H. (2018). Gut Microbiota Regulation of Dehydrogenase With Macrophage Metabolic Remodeling and Regulation of
Tryptophan Metabolism in Health and Disease. Cell Host Microbe 23 (6), Inflammation. Cell Metab. 24 (1), 158–166. doi: 10.1016/j.cmet.2016.06.004
716–724. doi: 10.1016/j.chom.2018.05.003 Liu, Y., Wang, Y., Ni, Y., Cheung, C. K. Y., Lam, K. S. L., Wang, Y., et al. (2020). Gut
Alvarez, Y., Glotfelty, L. G., Blank, N., Dohnalova, L., and Thaiss, C. A. (2020). The Microbiome Fermentation Determines the Efficacy of Exercise for Diabetes
Microbiome as a Circadian Coordinator of Metabolism. Endocrinology 161 (6), Prevention. Cell Metab. 31 (1), 77–91.e75. doi: 10.1016/j.cmet.2019.11.001
bqaa059. doi: 10.1210/endocr/bqaa059 Magne, F., Gotteland, M., Gauthier, L., Zazueta, A., Pesoa, S., Navarrete, P., et al.
Bajor, A., Gillberg, P. G., and Abrahamsson, H. (2010). Bile Acids: Short and Long (2020). The Firmicutes/Bacteroidetes Ratio: A Relevant Marker of Gut
Term Effects in the Intestine. Scand. J. Gastroenterol. 45 (6), 645–664. Dysbiosis in Obese Patients? Nutrients 12 (5), 1474. doi: 10.3390/nu12051474
doi: 10.3109/00365521003702734 Matenchuk, B. A., Mandhane, P. J., and Kozyrskyj, A. L. (2020). Sleep, Circadian
Binda, C., Lopetuso, L. R., Rizzatti, G., Gibiino, G., Cennamo, V., and Gasbarrini, Rhythm, and Gut Microbiota. Sleep Med. Rev. 53, 101340. doi: 10.1016/
A. (2018). Actinobacteria: A Relevant Minority for the Maintenance of Gut j.smrv.2020.101340
Homeostasis. Dig. Liver Dis. 50 (5), 421–428. doi: 10.1016/j.dld.2018.02.012 Ma, D., Wang, A. C., Parikh, I., Green, S. J., Hoffman, J. D., Chlipala, G., et al.
Caruso, C. C., Lusk, S. L., and Gillespie, B. W. (2004). Relationship of Work Schedules (2018). Ketogenic Diet Enhances Neurovascular Function With Altered Gut
to Gastrointestinal Diagnoses, Symptoms, and Medication Use in Auto Factory Microbiome in Young Healthy Mice. Sci. Rep. 8 (1), 6670. doi: 10.1038/s41598-
Workers. Am. J. Ind. Med. 46 (6), 586–598. doi: 10.1002/ajim.20099 018-25190-5
Choi, H. H., Zou, S., Wu, J. L., Wang, H., Phan, L., Li, K., et al. (2020). Egf Relays Mayer, E. A., Tillisch, K., and Gupta, A. (2015). Gut/Brain Axis and the
Signals to COP1 and Facilitates Foxo4 Degradation to Promote Tumorigenesis. Microbiota. J. Clin. Invest. 125 (3), 926–938. doi: 10.1172/JCI76304
Adv. Sci. (Weinh) 7 (20), 2000681. doi: 10.1002/advs.202000681 Michaudel, C., and Sokol, H. (2020). The Gut Microbiota At the Service of
Crovesy, L., Masterson, D., and Rosado, E. L. (2020). Profile of the Gut Microbiota Immunometabolism. Cell Metab. 32 (4), 514–523. doi: 10.1016/j.cmet.2020.09.004
of Adults With Obesity: A Systematic Review. Eur. J. Clin. Nutr. 74 (9), 1251– Potter, G. D., Skene, D. J., Arendt, J., Cade, J. E., Grant, P. J., and Hardie, L. J.
1262. doi: 10.1038/s41430-020-0607-6 (2016). Circadian Rhythm and Sleep Disruption: Causes, Metabolic
Cukrowska, B., Bierla, J. B., Zakrzewska, M., Klukowski, M., and Maciorkowska, E. Consequences, and Countermeasures. Endocr. Rev. 37 (6), 584–608.
(2020). The Relationship Between the Infant Gut Microbiota and Allergy. The Role doi: 10.1210/er.2016-1083
of Bifidobacterium Breve and Prebiotic Oligosaccharides in the Activation of Anti- Rijo-Ferreira, F., and Takahashi, J. S. (2019). Genomics of Circadian Rhythms in
Allergic Mechanisms in Early Life. Nutrients 12 (4), 946. doi: 10.3390/nu12040946 Health and Disease. Genome Med. 11 (1), 82. doi: 10.1186/s13073-019-0704-0
De Luca, F., and Shoenfeld, Y. (2019). The Microbiome in Autoimmune Diseases. Rooks, M. G., and Garrett, W. S. (2016). Gut Microbiota, Metabolites and Host
Clin. Exp. Immunol. 195 (1), 74–85. doi: 10.1111/cei.13158 Immunity. Nat. Rev. Immunol. 16 (6), 341–352. doi: 10.1038/nri.2016.42
Evans, J. M., Morris, L. S., and Marchesi, J. R. (2013). The Gut Microbiome: The Sayin, S. I., Wahlstrom, A., Felin, J., Jantti, S., Marschall, H. U., Bamberg, K., et al.
Role of a Virtual Organ in the Endocrinology of the Host. J. Endocrinol. 218 (2013). Gut Microbiota Regulates Bile Acid Metabolism by Reducing the Levels
(3), R37–R47. doi: 10.1530/JOE-13-0131 of Tauro-Beta-Muricholic Acid, a Naturally Occurring FXR Antagonist. Cell
Gao, T., Wang, Z., Dong, Y., Cao, J., Lin, R., Wang, X., et al. (2019). Role of Metab. 17 (2), 225–235. doi: 10.1016/j.cmet.2013.01.003
Melatonin in Sleep Deprivation-Induced Intestinal Barrier Dysfunction in Stojanov, S., Berlec, A., and Strukelj, B. (2020). The Influence of Probiotics on the
Mice. J. Pineal. Res. 67 (1), e12574. doi: 10.1111/jpi.12574 Firmicutes/Bacteroidetes Ratio in the Treatment of Obesity and Inflammatory
Grigor’eva, I. N. (2020). Gallstone Disease, Obesity and the Firmicutes/ Bowel Disease. Microorganisms 8 (11), 1715. doi: 10.3390/microorganisms8111715
Bacteroidetes Ratio as a Possible Biomarker of Gut Dysbiosis. J. Pers. Med. Summa, K. C., Voigt, R. M., Forsyth, C. B., Shaikh, M., Cavanaugh, K., Tang, Y.,
11 (1), 13. doi: 10.3390/jpm11010013 et al. (2013). Disruption of the Circadian Clock in Mice Increases Intestinal
Hang, S., Paik, D., Yao, L., Kim, E., Trinath, J., Lu, J., et al. (2019). Bile Acid Permeability and Promotes Alcohol-Induced Hepatic Pathology and
Metabolites Control TH17 and Treg Cell Differentiation. Nature 576 (7785), Inflammation. PloS One 8 (6), e67102. doi: 10.1371/journal.pone.0067102
143–148. doi: 10.1038/s41586-019-1785-z Sundin, O. H., Mendoza-Ladd, A., Zeng, M., Diaz-Arevalo, D., Morales, E., Fagan,
Hidalgo-Cantabrana, C., Delgado, S., Ruiz, L., Ruas-Madiedo, P., Sanchez, B., and B. M., et al. (2017). The Human Jejunum has an Endogenous Microbiota That
Margolles, A. (2017). Bifidobacteria and Their Health-Promoting Effects. Differs From Those in the Oral Cavity and Colon. BMC Microbiol. 17 (1), 160.
Microbiol. Spectr. 5 (3). doi: 10.1128/microbiolspec.BAD-0010-2016 doi: 10.1186/s12866-017-1059-6
Hooper, L. V., and Macpherson, A. J. (2010). Immune Adaptations That Maintain Tan, J., McKenzie, C., Potamitis, M., Thorburn, A. N., Mackay, C. R., and Macia, L.
Homeostasis With the Intestinal Microbiota. Nat. Rev. Immunol. 10 (3), 159– (2014). The Role of Short-Chain Fatty Acids in Health and Disease. Adv.
169. doi: 10.1038/nri2710 Immunol. 121, 91–119. doi: 10.1016/B978-0-12-800100-4.00003-9
Hou, Q., Ye, L., Liu, H., Huang, L., Yang, Q., Turner, J. R., et al. (2018). Thaiss, C. A., Zeevi, D., Levy, M., Zilberman-Schapira, G., Suez, J., Tengeler, A. C., et al.
Lactobacillus Accelerates ISCs Regeneration to Protect the Integrity of (2014). Transkingdom Control of Microbiota Diurnal Oscillations Promotes
Intestinal Mucosa Through Activation of STAT3 Signaling Pathway Induced Metabolic Homeostasis. Cell 159 (3), 514–529. doi: 10.1016/j.cell.2014.09.048
by LPLs Secretion of IL-22. Cell Death Differ. 25 (9), 1657–1670. doi: 10.1038/ Tuganbaev, T., Mor, U., Bashiardes, S., Liwinski, T., Nobs, S. P., Leshem, A., et al.
s41418-018-0070-2 (2020). Diet Diurnally Regulates Small Intestinal Microbiome-Epithelial-
Islam, J., Sato, S., Watanabe, K., Watanabe, T., Hirahara, K., Ardiansyah, K., et al. Immune Homeostasis and Enteritis. Cell 182 (6), 1441–1459.e1421.
(2017). Dietary Tryptophan Alleviates Dextran Sodium Sulfate-Induced Colitis doi: 10.1016/j.cell.2020.08.027
Through Aryl Hydrocarbon Receptor in Mice. J. Nutr. Biochem. 42, 43–50. Xie, G., Wang, L., Chen, T., Zhou, K., Zhang, Z., Li, J., et al. (2021). A Metabolite
doi: 10.1016/j.jnutbio.2016.12.019 Array Technology for Precision Medicine. Anal. Chem. 93 (14), 5709–5717.
Jia, W., Xie, G., and Jia, W. (2018). Bile Acid-Microbiota Crosstalk in doi: 10.1021/acs.analchem.0c04686
Gastrointestinal Inflammation and Carcinogenesis. Nat. Rev. Gastroenterol. Zelante, T., Iannitti, R. G., Cunha, C., De Luca, A., Giovannini, G., Pieraccini, G.,
Hepatol. 15 (2), 111–128. doi: 10.1038/nrgastro.2017.119 et al. (2013). Tryptophan Catabolites From Microbiota Engage Aryl
Frontiers in Cellular and Infection Microbiology | www.frontiersin.org 13 June 2021 | Volume 11 | Article 648175Li et al. Gut Microbiota and Metabolites
Hydrocarbon Receptor and Balance Mucosal Reactivity Via Interleukin-22. Copyright © 2021 Li, Wang, Qiu, Yan, Cheng, Wang and Chen. This is an open-access
Immunity 39 (2), 372–385. doi: 10.1016/j.immuni.2013.08.003 article distributed under the terms of the Creative Commons Attribution License
(CC BY). The use, distribution or reproduction in other forums is permitted, provided
Conflict of Interest: The authors declare that the research was conducted in the the original author(s) and the copyright owner(s) are credited and that the original
absence of any commercial or financial relationships that could be construed as a publication in this journal is cited, in accordance with accepted academic practice. No
potential conflict of interest. use, distribution or reproduction is permitted which does not comply with these terms.
Frontiers in Cellular and Infection Microbiology | www.frontiersin.org 14 June 2021 | Volume 11 | Article 648175You can also read