Thermal imaging potential and limitations to predict healing of venous leg ulcers
←
→
Page content transcription
If your browser does not render page correctly, please read the page content below
www.nature.com/scientificreports
OPEN Thermal imaging potential
and limitations to predict healing
of venous leg ulcers
Mahta Monshipouri1, Behzad Aliahmad1, Rajna Ogrin1,2,3, Kylie Elder4, Jacinta Anderson4,
Barbara Polus1 & Dinesh Kumar1*
Area analysis of thermal images can detect delayed healing in diabetes foot ulcers, but not venous leg
ulcers (VLU) assessed in the home environment. This study proposes using textural analysis of thermal
images to predict the healing trajectory of venous leg ulcers assessed in home settings. Participants
with VLU were followed over twelve weeks. Digital images, thermal images and planimetry of wound
tracings of the ulcers of 60 older participants was recorded in their homes by nurses. Participants were
labelled as healed or unhealed based on status of the wound at the 12th week follow up. The weekly
change in textural features was computed and the first two principal components were obtained. 60
participants (aged 80.53 ± 11.94 years) with 72 wounds (mean area 21.32 ± 51.28cm2) were included
in the study. The first PCA of the change in textural features in week 2 with respect to week 0 were
statistically significant for differentiating between healed and unhealed cases. Textural analysis of
thermal images is an effective method to predict in week 2 which venous leg ulcers will not heal by
week 12 among older people whose wounds are being managed in their homes.
A venous leg ulcer (VLU) is a chronic wound that occurs in 1 to 2% of the p opulation1–3 with an increased likeli-
hood of occurrence of up to 3% in individuals aged over 6 54,5. The most common aetiology of leg ulcers is venous
disease6–9. When diagnosed and managed appropriately, approximately 70% of VLUs can heal in 24 weeks10,11.
The normal course of healing constitutes a reduction in wound size of 50% within four w eeks12,13. Despite best
practice management, over 30% of ulcers do not heal in the expected trajectory and may require additional
interventions to improve o utcomes10,11,14,15. This leads to considerable negative impacts on quality of life16 and
increased costs to both the individual and the health s ystem3,17 .
Currently, there is no test available that can reliably predict if a VLU will heal at the expected rate, have a
delayed healing trajectory, or remain unhealed. VLU guidelines state that if the wound area hasn’t reduced by
at least 20–40% after four weeks, then additional interventions are w arranted2,12,18,19. However, this delays the
instigation of an adjuvant intervention to routine care which could aid in the wound’s ability to heal in a timely
manner20. Current assessment methods to monitor wound progress over these four weeks includes regular wound
tracing and measurement including the use of digital planimetry, observation and documentation of the wound
tissue type, wound edge characteristics, peri wound and surrounding skin and level and type of e xudate2. These
methods require at least weekly visits with the person living with the wound and physical contact with the wound.
Regular wound photography may be used in combination with the above methods using a readily available
digital camera21. This method of photography uses standard three colour channels of Red, Green and Blue, known
as RGB images. Whilst this is useful to visualise wound appearance at a point in time that is available for all
healthcare providers in the care team, it cannot be used for accurate measurement of the changes in wound size
/ area and other physiological parameters over time, which are the key factors associated with healing trajectory.
This is because there are large variations between images due to changes in the distance between the camera and
the wound which causes scale variance, altered ambient lighting conditions, image quality and differences in
camera angle across specific points in time when the image is t aken22.
Thermal imaging has been used in several medical applications, including prediction of ulceration in the feet
of people with diabetes23. This is because it can detect temperature differences and quantify sensitive changes
in skin temperature which occur with pathological changes such as soft tissue inflammation of the skin, sub-
sequent breakdown, and infection of u lcers24–26. The presence of higher local temperatures can be related to
1
Biosignals for Affordable Healthcare, RMIT University, 124 Latrobe Street, Melbourne, VIC 3000, Australia. 2Bolton
Clarke Research Institute, Bentleigh, VIC, Australia. 3Department of Business Strategy & Innovation, Griffith
University, Brisbane, QLD, Australia. 4Bolton Clarke, 31 Janefield Drive, Bundoora, VIC, Australia. *email:
dinesh.kumar@rmit.edu.au
Scientific Reports | (2021) 11:13239 | https://doi.org/10.1038/s41598-021-92828-2 1
Vol.:(0123456789)
www.nature.com/scientificreports/
Participant characteristics Healed in week 12 Unhealed in week 12 Overall
Total number of participants 14 46 60
Total number of VLUs 17 55 72
Age (years ± SD) 82.42 ± 8.50 79.95 ± 12.83 80.53 ± 11.94
Female gender (n, %) 7, 50% 28, 60.8% 35, 58.3%
Duration of ulcer (weeks ± SD) 17.85 ± 10.61 134.21 ± 222.88 107.06 ± 200.94
Area of ulcer (cm2) 18.60 ± 62.16 22.15 ± 48.25 21.32 ± 51.28
Table 1. Characteristic of participants.
Healed Unhealed Normality test Kruskal–Wallis test
Ratio of wound area Median Mean SD* Median Mean SD P Value P Value
Week1/Week0 0.68 0.75 0.36 0.91 1.07 0.75 < 0.005 0.019
Week2/Week1 0.82 0.84 0.62 0.94 0.92 0.36 < 0.005 0.168
Week2/Week0 0.50 0.66 0.77 0.88 1.08 1.50 < 0.005 0.006
Table 2. Kruskal–Wallis test—comparison between ratio of the ulcer areas across three weeks and the healing
status at week 12. *Standard deviation from the mean.
Healed Unhealed Normality test ANOVA
Ratio of wound area Median Mean SD* Median Mean SD P Value P Value
Week1/Week0 0.97 0.98 0.04 0.99 1.00 0.03 > 0.20 0.110
Week2/Week1 1.00 1.01 0.05 0.99 0.99 0.03 > 0.20 0.123
Week2/Week0 1.01 1.00 0.05 0.88 0.99 0.03 > 0.20 0.873
Table 3. One way ANOVA—comparison between ratio of the ulcer areas of thermal images across three
weeks and the healing status at week 12. *Standard deviation from the mean.
inflammation or infection, while the presence of lower temperatures can indicate a slow healing rate, mainly
due to decreased oxygen in that r egion27. Thermal imaging methods have also been used in individuals at risk
of developing wounds by comparing the skin temperature distribution of both feet of participants, termed as
asymmetry analysis. The foot with the higher temperature is considered to be at risk of u lceration4,23. Using an
edge detection method of thermal images, healing of diabetes related foot ulcers could be p redicted28. However,
when we used this latter method to predict healing of VLUs managed in the home setting, results were negative29.
Given many wounds are managed in settings in which ambient and individual factors cannot be controlled, for
example GP clinics and home care15,30, alternative methods that negate the need for such controls are necessary.
To overcome the above limitations, an alternative analysis to using edge detection of thermal imaging was
considered. It is well recognised that the texture of a wound is an indicator of its ability to heal31. Textural analysis
of thermal images provides information on spatial heat distribution when applied on thermal images. It has been
hypothesized that texture analysis of VLU thermal images may predict the likelihood of ulcer healing, as there is
a significant change in the texture of the wounds over the healing trajectory31. Therefore, this study investigated
the use of texture in thermal images of VLUs compared to conventional digital planimetry, and whether it could
be used to predict the healing trajectory of wounds managed in the home setting to identify the ulcers that would
remain unhealed after 12 weeks. This is the first report on the usefulness of this technique in the prediction of
the healing status of VLUs.
Results
Participants and their characteristics. Sixty individuals (mean age 80.53 ± 11.94 years) with 72 wounds
participated in this study. Of the 72 wounds included in the full analysis, 17 wounds healed at 12 weeks and 55
remained unhealed. Characteristics of participants is shown in Table 1 below.
Table 2 shows the ratio of the area of the wound for week 1/ week 0, week 2/ week 1 and week 2/ week 0
obtained using digital planimetry. The statistical analysis shows that there is significant difference between the
healed and unhealed when comparing the weeks 0 with week 1 and 2. The analysis confirms that digital plani-
metry is suitable for detecting changes in wound area over a 3-week period.
Table 3 shows the values for the ratio of area of the wound obtained using thermal images for week 1/ week 0,
week 2/ week1 and week 2/ week 0, the details of which are shown in Table 3. It is seen that there is no significant
difference between the healed and unhealed groups.
Scientific Reports | (2021) 11:13239 | https://doi.org/10.1038/s41598-021-92828-2 2
Vol:.(1234567890)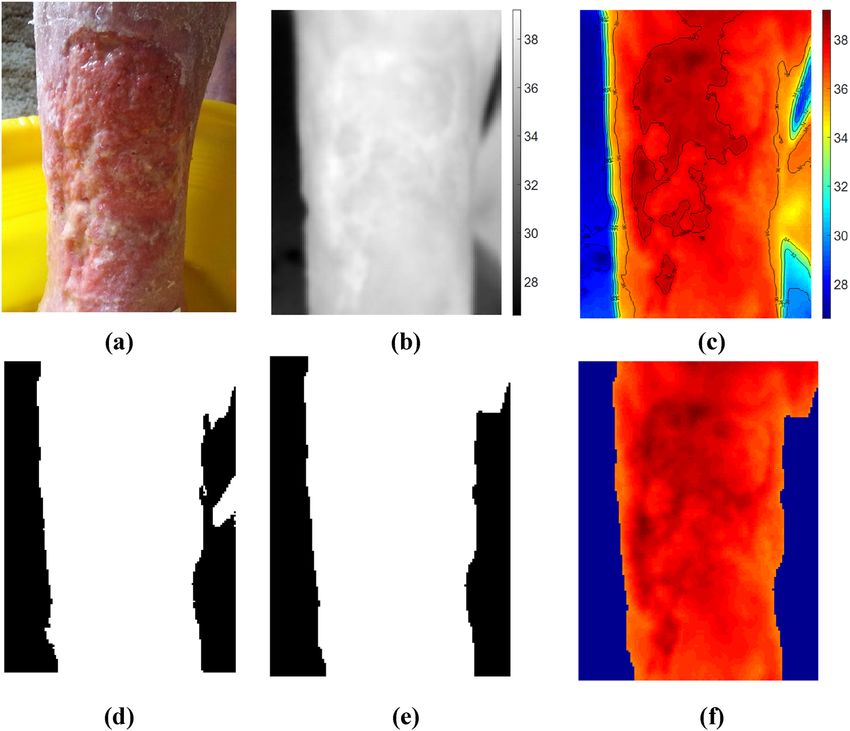
www.nature.com/scientificreports/

                                             Healed mean                     Unhealed mean            F value    95% CI* (Tukey simultaneous CI—healed subtracted)                  p Value (α = 0.05)
                                             -1.57                           0.48                     6.23       0.414–3.703                                                        0.015

                                     Table 4.  Analysis of variance (ANOVA) to test relationship between rate of change in textural features in
                                     week 2 with respect to the baseline (i.e. week 0) when transformed in PCA domain (week2/ week0). * CI:
                                     Confidence interval.

                                                                                                                Loading Plot (PCA)
                                                               0.50                                                                           b

                                                                                                                                                        l

                                                               0.25                                                             k
                                        Second Component

                                                                                                                                                            a
                                                                                                  e
                                                               0.00                           i
                                                                                    d
                                                                                h
                                                                                                                                                                          j
                                                              -0.25
                                                                                                                                                                      f
                                                                                                                                                                g
                                                                                                                 c
                                                              -0.50
                                                                      -0.5     -0.4         -0.3         -0.2         -0.1     0.0     0.1        0.2           0.3           0.4
                                                                                                                     First Component

                                                                                                                          (a)
                                                                                          Boxplot of First Principal Component

                                                               5.0

                                                               2.5
                                  First Principal Component

                                                               0.0

                                                               -2.5

                                                               -5.0

                                                               -7.5

                                                              -10.0

                                                              -12.5
                                                                                            Healed                                           Unhealed
                                                                                                                  Labels Week 12
                                                                                                                         (b)

                                     Figure 1.  (a) loading plot of PCA, the letters/notations shown for each variable correspond to textural
                                     features explained in section “pre-processing and texture analysis” under item 7 (b) Box plot of first principal
                                     component.

                                         Table 4 shows results of the statistical analysis of PCA1 obtained from texture analysis of the thermal images
                                     of the wounds. The results show that there was a significant difference between the healed and unhealed ulcers
                                     for the rate of change in textural features from week 0 (base line) to week 2 (week2/ week0). The other ratios
                                     (week1/week0, and week2/week1) were not found to be statistically significant and have not been tabulated. As
                                     the PCA of the texture analysis do not directly provide any physiological information, their actual values have
                                     not been provided in the table.
                                         Figure 1(a) shows the loading plot that graphs coefficients of each variable (i.e. textural features) for the first
                                     principal component versus the coefficients for the second principal component to identify which variable has the
                                     largest effect on each component. The notations used for each variable correspond to textural features explained

Scientific Reports |   (2021) 11:13239 |                                                https://doi.org/10.1038/s41598-021-92828-2                                                                            3

                                                                                                                                                                                                         Vol.:(0123456789)
www.nature.com/scientificreports/
in section “pre-processing and texture analysis” under item 7. According to the loading plot j, f and g (i.e. inertia,
sum of square variance and sum average) have a large positive loading on the first principal component and d and
h (i.e. entropy and sum entropy) have a large negative loading on the first principal component. Other variables/
textural features were found to have a weak influence on the first principal component.
Figure 1(b) shows the box plot of the first principal component for healed and unhealed cases in order to
better visualize how the two clusters have been separated. The second principal component was discarded as it
did not show a significant difference between the healed and unhealed clusters.
Conclusion
Digital planimetry, which is the current gold standard for predicting healing of VLUs, matches the wound healing
observations over the twelve-week period used in this study. This study therefore confirms the use of this method
and that digital planimetry may be used as a tool to demonstrate healing as early as two weeks after commence-
ment of treatment. Conventional thermal imaging methods used to compute area are not suitable to monitor
progress of healing when used in conditions such as in the homes of individuals with wounds due to large differ-
ences in ambient conditions and due to scaling and rotational variances. Textural analysis of thermal images is
suitable for identifying unhealed wounds two weeks post intervention and is suitable for in-house observations
of individuals with wounds. This latter method is resilient to natural variations in ambient conditions, scaling
and rotation, and does not require contact with the wound of the individual. Furthermore, computerised analysis
of textural features is a time efficient and cost-effective method to identify delayed healing of VLUs and further
research to assess generalisability and to refine the methods is warranted.
Discussion
This is the first study of texture analysis that has been undertaken on thermal images of VLUs. The rate of change
in textural features between week 0 (baseline) and week 2 (third week) were significantly different for the healed
and unhealed cases. Therefore, this method of thermal imaging analysis can predict whether the VLU would
heal in 12 weeks by week 2 from the baseline assessment. This is an improvement on the current guidance using
digital imaging or planimetry wound tracings to detect the healing wounds by week f our18.
The significance of this work is that there is now a method for detecting those wounds that do not heal in the
normal trajectory by week 2 using a non-contact, quick, objective and simple method. While digital planimetry
of wound area can be used to predict healing trajectory at two weeks from b aseline32, confirmed by this work,
digital planimetry requires physical contact with wounds. A non-contact method, like thermal imaging, would
be ideal to use when managing wounds in the home setting to minimise physical contact, and thereby reduce
infection risk.
Textural analysis of thermal images has fewer limitations when compared to other methods to predict likeli-
hood of healing of VLUs. Methods that use the area or the shape of the wound rely on the detection of the wound
contour, problematic when using imaging due to the two- dimensional nature of images33. Further, analysis using
the area or shape of the wound is sensitive to rotation or scale due to altered distance or angle between the camera
and the wound. This is particularly important when caring for people in their homes because there are many
factors that are not within the control of the examiner which would result in weekly differences in the placement
of the camera with respect to the wound. Texture analysis provides a set of global features and is insensitive to
rotation and scaling factors. Thus, the use of texture analysis is suitable for unsupervised computerised analysis.
Another issue when using RGB or thermal images to measure the area of the ulcer is the high likelihood of poor
contrast and low resolution of images collected by clinicians, increasing the difficulty of using edge detection
to analyse these images. Texture analysis does not require the detection of wound e dges31. In addition, textural
analysis does not require image registration, which increases complexity as these images must then compare
shape and size changes of wounds over time. The large number of textural features increases the complexity
of image analysis. However, this was overcome by dimensionality reduction and take only the most principal
component into account using PCA. This reduction of the amount of data is necessary for analysis makes it
suitable for automated analysis.
This study has shown that by using texture analysis, it was possible to predict the likelihood of VLU healing
even without needing to control the ambient conditions in which the images were recorded. Ambient thermal
conditions, in particular, significantly impact on area analysis of thermal images, preventing accurate and effective
prediction of healing. RGB images are impacted significantly by a number of factors such as lighting conditions,
temperature of the room and the colour and texture of the individual’s s kin34. In the current study the images
were recorded in the homes of participants with wounds; homecare for wound management is common15 and
often preferable for older people with wounds35, and any diagnostic test needs to be able to function in the envi-
ronment in which it would most likely to be used. Negating the need for controlling ambient conditions makes
this method of analysis highly useful in a wide range of care settings.
Ideally, the likelihood of delayed healing should be detected as early as possible, such as at the first appoint-
ment (week 0 of our study). Based on the current study, using week 0 (baseline) data to predict likelihood of
healing would only be possible by incorporating additional data that considers the effect of confounding fac-
tors, and is adjusted for potential bias. Previous research has suggested using area reduction at two weeks can
predict failure to heal at 24 weeks when combined with living alone, higher ulcer severity scores or not treated
with high level compression t herapy32. And yet other research includes factoring in a number of different vari-
ables to calculate the potential for delayed healing: components of age (years), ulcer duration (weeks), history
of previous deep vein thrombosis in study ulcer leg, living alone, using a mobility aid, slough/necrotic tissue,
ulcer area, level of compression, two week reduction in ulcer area and calf c ircumference11. Given this study is
considering the ability of textural analysis of the thermal images versus digital planimetry to predict healing,
Scientific Reports | (2021) 11:13239 | https://doi.org/10.1038/s41598-021-92828-2 4
Vol:.(1234567890)www.nature.com/scientificreports/
the above-mentioned factors were not considered. Future research will consider their contribution in predicting
healing in conjunction with textural analysis of thermal images.
The shape and the area obtained from thermal images based on the temperature distribution is very different
from observed using RGB images (Fig. 3(a)) and the shape and surface area obtained using digital planimetry
(Fig. 3(b)). This indicates that there are significant differences in the superficial and deeper ulcer conditions and
highlights the importance of thermal imaging of the wounds. Further work to understand these differences and
their clinical implications is warranted.
An important note is that the above observations were for the pre-wash images, that is, wounds were not
cleansed prior to thermal images being taken. We identified that cleansing wounds alters their inherent tempera-
ture distribution, thereby rendering any thermal image unsuitable. Current clinical guidelines recommend VLUs
are cleansed when dressings and bandages are c hanged18. Therefore, thermal images of wounds for diagnostic
purposes need to be taken prior to cleansing of wounds.
One limitation of this study is that the data were collected from an older cohort with a bias towards chronic
wounds. Nearly 80% of the wounds were chronic compared with around 30% in other s tudies10,11,14,15. Therefore,
while textural analysis is suitable for assessing potential for healing of VLUs in older people, further work is
needed that includes younger people with VLUs to ensure generalisability of results to the broader population.
Methods
Study design. This was an observational study, where data were collected prospectively from a convenience
sample of individuals with VLUs.
Participants. Clients seen in their homes by a large home health and aged care provider, living in the
northern region of metropolitan Melbourne Australia, were selected to be screened for eligibility for the study.
Individuals were included if they: were adults, lived in the catchment area of the nursing service, had a VLU
diagnosed from clinical indications and either an Ankle Brachial index between 0.8 and 1.2, or a duplex scan
indicating no arterial involvement, as per National Guidelines36; had sufficient English proficiency to understand
the study; had sufficient cognitive ability to understand the study participant information sheet; and were avail-
able for consecutive weekly visits. Exclusion criteria were; a non-venous wound primary diagnosis and/or if the
individual would heal within the study period, based on wound either almost or fully epithelialized in less than
two weeks.
This study was approved by the Human Research and Ethics Committee of Bolton Clarke (Project number:
194) and RMIT University (BSEHAPP 21–15). All participants received a participant information sheet and their
informed written consent was obtained. All experiments were performed in accordance with The Declaration of
Helsinki (1964) and relevant local and international guidelines and regulations.
Data collection. Data were collected in participants’ homes by one research nurse with advanced training
in wound care. At baseline, the data collected included: demographic data including age, gender, biomedical
data including comorbidities; and wound related data including ulcer duration, cause of ulcer, location of ulcer,
digital planimetry measurement using Visitrack (Smith & Nephew) from acetate tracing, and digital and thermal
images.
Thermal images were collected using ULRIvision TI160 (Zhejiang Ulirvision Technology Co., Ltd). The device
is a hand-held imaging device which acquires thermal images with an accuracy of ± 2 °C (Temperature range:
-20 °C to + 120 °C) with simple point-and-shoot operation similar to conventional photo cameras. The device
provides images with a resolution of 160 × 120 pixels with 25 µm pitch.
Data were acquired across three weekly consecutive time points for analysis. If any one of the three data points
was missed, the data could not be included. If this occurred, and the wound had not healed, the participant was
recruited as if a new participant. If a participant’s wound healed during data collection, the healed wound area
continued to be monitored for five weeks.
A wound is classified as healed when it remains epithelialized for a period of two w eeks37,38. As the wound
may still be unhealed (and therefore ‘re-open’) during this time, capturing both digital and thermal images
during this period was considered of value to ascertain tissue status. While the thermal images were analysed
for the three weeks, RGB images were recorded until week five for all participants, and the healing status of the
wounds was monitored until week 12. Participants that had been discharged from the service or were not avail-
able for the visits were contacted to ascertain if the wound was still present or healed. See Fig. 2 for a flowchart
of the project data collection.
The emissivity parameter for the thermal camera was set to 0.98, corresponding to the emissivity of clean
human skin. This parameter is a measure of surface radiation and absorption efficiency, which is required for
characterization of human skin temperature using optical devices.
Digital planimetry. The most widely accepted method to assess ulcers accurately is digital p lanimetry18,39,40.
Digital planimetry provides a two-dimensional surface area of ulcers. It involves detecting ulcer margin lines
and measuring the inner area by tracing the outline of the ulcer using a marking pen on a clear, sterile, acetate
film or graph p aper41. This tracing is then retraced using a stylus on a portable digital tablet. The area is then
calculated using software that counts the number of squares on the film which fall within the ulcer t racing27. The
areas of the ulcers obtained using digital planimetry, shown in Fig. 3, were used to compare with the thermal
image textural analysis.
Scientific Reports | (2021) 11:13239 | https://doi.org/10.1038/s41598-021-92828-2 5
Vol.:(0123456789)www.nature.com/scientificreports/
•Demographic and wound specific data
•Acetate wound tracing for digital planimetry
Baseline •RGB and thermal images
(week 0)
•Wound factors
•Acetate wound tracing for digital planimetry
Week 1-2 •RGB and Thermal images
•RGB image captured if participant still client at home health and
aged care service at 12 weeks;
•If client discharged by service, phone call with the client to
Week 12 ascertain whether wound healed.
Figure 2. Flowchart of participant data collection.
Figure 3. (a) An example of digital RGB image showing the ulcer on skin surface (b) Wound tracing to obtain
the area.
Texture analysis. Texture is mostly understood in relation to topographic and textile surfaces. It refers
to the surface characteristics and appearance in terms of density, regularity, randomness, uniformity, size, and
shape. A texture is often loosely described with terms such as smooth or rough, soft or hard, coarse or fine which
provides information about the feel of the surface or its visual impression. For instance, smooth surfaces are even
and regular, free from perceptible projections, lumps, or indentation and there is little or no tangible difference
between its high and low points. In contrast, rough surfaces are uneven and irregular with a large difference
between the high and low points. A similar concept also applies to images, but the texture is characterised by
Scientific Reports | (2021) 11:13239 | https://doi.org/10.1038/s41598-021-92828-2 6
Vol:.(1234567890)www.nature.com/scientificreports/
Figure 4. Thermal Image Pre-processing Steps. (a) RGB image (b) Thermal image normalization (shown
in Grey scale) (c) Contour detection (d) Image masking (e) Enhanced mask (f) Masked thermal image
(background removed).
the changes in the brightness value of the pixels and in this case for the thermal images, by the changes in the
temperature value of the ulcer and peripheral skin.
In this study the textural properties of the thermal images were studied using the Grey Level Co-occurrence
Matrix (GLCM)42 which is the distribution of co-occurring temperature values over the thermal images of the
ulcer. The GLCM is a statistical method for extracting second-order statistical texture features from an image. It
measures the number of times a pixel with value X (i.e. temperature value X) is present adjacent to another pixel
with value Y (temperature value Y). Each entry in the GLCM matrix represents the occurrence of pixel value
X being found adjacent to the pixel value Y. As the adjacency can be defined to occur in each of four directions
(horizontal, vertical, left and right diagonals) in two-dimensional space, four different GLCM matrices can be
defined. This method has been successfully used in various applications in medical imaging analysis including
the analysis of skin cancer43 and detection of macular oedema in retinal i mages44.
The rate of change in textural features, i.e. the ratios of weeks 2 to 1, weeks 2 to 0 and weeks 1 to 0 of same type
textural features was calculated for all the texture features. To reduce the dimensionality of such large feature sets
(i.e. 12 textural features) while preserving as much information and variability as possible, Principal Component
Analysis (PCA) method was used. It transforms the data into a new feature space known as the PCA domain.
The first principal component (PCA1) in that domain corresponds to the maximum variance direction in the
data, followed by PCA2, as the second largest variance direction which is orthogonal to PCA1. . In this study, it
was found that PCA1 and PCA2 were sufficient to model the systematic variation of the dataset.
Image analysis. The thermal and digital planimetry recordings were analysed using two techniques. First,
by looking at the changes in the area of the ulcers across three consecutive treatment weeks using the digital
planimetry technique and second by texture analysis of the thermal images of the ulcer. The healing status
label of the VLUs included in the analysis was based on the condition of the ulcer at week 12, that is, healed or
unhealed.
Scientific Reports | (2021) 11:13239 | https://doi.org/10.1038/s41598-021-92828-2 7
Vol.:(0123456789)www.nature.com/scientificreports/
Pre‑processing and texture analysis. Thermal image analysis involves the following steps (shown in
Fig. 4):
1. Thermal Image normalization
2. Contour detection to differentiate wound bed from background (used for background masking)
3. Creating background mask
4. Morphological operations to enhance the mask
5. Calculation of GLCM matrix
6. GLCM Transformation: Normalization
7. Calculation of textural features: 12 features were calculated from this step:
a. Homogeneity, Angular Second Moment (ASM) (is a measure of homogeneity of an image),
b. Contrast (is measure of contrast or local intensity variation),
c. Local homogeneity, Inverse Difference Moment (IDM) (a high IDM value is attributed to homogeneous
images),
d. Entropy (Inhomogeneous scenes have low first order entropy, while a homogeneous scene has a high
entropy),
e. Correlation (Correlation is a measure of gray level linear dependence between the pixels at the specified
positions relative to each other),
f. Sum of Squares, Variance (This feature puts relatively high weights on the elements that differ from the
average value),
g. Sum Average,
h. Sum Entropy,
i. Difference Entropy,
j. Inertia,
k. Cluster Shade, and
l. Cluster Prominence.
8. Calculation of ratios of weeks 2 to 1, weeks 2 to 0 and weeks 1 to 0 of same type textural features (Rate of
change in textural features)
9. Principal component analysis (PCA) (First two principal components).
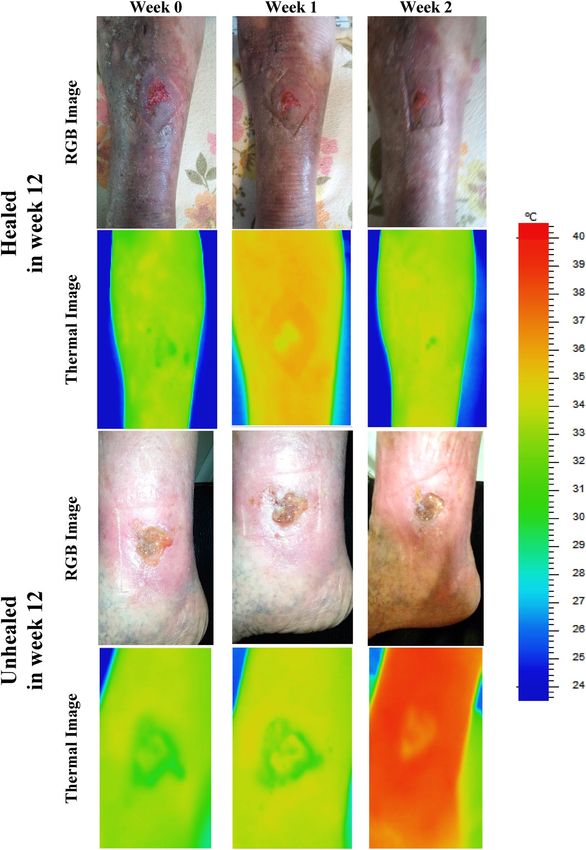
Examples of the final RGB and thermal images used in the analysis across the three weeks in the study are
shown in Fig. 5.
Statistical analysis. All obtained parameters were first tested for normality. With regard to the digital
planimetry data, areas of the wounds are different between individual participants, and to measure the change
of the area over the weeks, ratios between weeks 2 and 1, weeks 2 and 0 and weeks 1 and 0 were calculated so
that data could be pooled. The digital planimetry data did not follow a normal distribution, therefore the non-
parametric Kruskal Wallis test was performed to test the difference in ratios between wound areas obtained from
digital planimetry across two weeks of ulceration and over three consecutive weeks, grouped according to the
healing status of the ulcers at 12 weeks (healed and unhealed).
The interval plots of the area (i.e. ratio data) with 95% confidence interval were also obtained to study the
distribution of the area in the healed and unhealed cases. Descriptive statistics, including mean, median, standard
deviation (SD) of two-week ratios of area were also computed for healed and unhealed wounds.
To measure the change of the area over the weeks, ratios of weeks 2 to 1, weeks 2 to 0 and weeks 1 to 0 of same
type textural features were calculated and then PCA was taken to reduce the dimensionality and pick the first two
principal components. Analysis of Variance (ANOVA) was performed to test the group difference between the
healing and unhealed ulcers. This established the relationship between the change in textural features in week 2
with respect to the baseline (i.e. week 0) with reduced dimensionality (i.e. First and second principal component,
(PCA 1 and PCA 2) and healing status of the VLUs).
All statistical analyses were performed in Minitab (v.16.1) Statistical S oftware45, (www.minitab.com).
Ethics. All experiments and data collection were performed in accordance with Helsinki accordance of
Human experiments, and relevant local and international guidelines. All recordings were after obtaining signed
informed consent from the participants. The details of the ethics board approval are provided in the Methods
section.
Scientific Reports | (2021) 11:13239 | https://doi.org/10.1038/s41598-021-92828-2 8
Vol:.(1234567890)www.nature.com/scientificreports/
Figure 5. Sample images (RGB and Thermal) of healed and unhealed cases across three consecutive weeks
showing the healing progression.
Scientific Reports | (2021) 11:13239 | https://doi.org/10.1038/s41598-021-92828-2 9
Vol.:(0123456789)www.nature.com/scientificreports/
Received: 17 February 2021; Accepted: 9 June 2021
References
1. Briggs, M. The prevalence of leg ulceration: a review of the literature. Eur. Wound Manage Assoc. (EWMA) J 3, 14–20 (2003).
2. O’Donnell, T. F. et al. Management of venous leg ulcers: clinical practice guidelines of the society for vascular surgery® and the
American Venous Forum. J. Vasc. Surg. 60, 3S-59S (2014).
3. Lal, B. K. Venous ulcers of the lower extremity: definition, epidemiology, and economic and social burdens. Semin. Vasc. Surg. 28,
3–5 (2015).
4. Baker, S. R. & Stacey, M. C. Epidemiology of chronic leg ulcers in Australia. Aust. N. Z. J. Surg. 64, 258–261 (1994).
5. Gordon, P., Widener, J. M. & Heffline, M. Venous leg ulcers: impact and dysfunction of the venous system. J. Vasc. Nurs. 33, 54–59
(2015).
6. Caprini, J., Partsch, H. & Simman, R. Venous ulcers. J. Am. Coll. Clin. Wound Spec. 4, 54–60 (2012).
7. Martinengo, L. et al. Prevalence of chronic wounds in the general population: systematic review and meta-analysis of observational
studies. Ann. Epidemiol. 29, 8–15 (2019).
8. O’Meara, S., Cullum, N.A. & Nelson, E.A. Compression for venous leg ulcers. Cochrane Database Syst. Rev. CD000265 (2009).
9. Forssgren, A., Fransson, I. & Nelzén, O. Leg ulcer point prevalence can be decreased by broad-scale intervention: a follow-up
cross-sectional study of a defined geographical population. Acta Derm. Venereol. 88, 252–256 (2008).
10. Gohel, M. et al. Risk factors for delayed healing and recurrence of chronic venous leg ulcers—an analysis of 1324 legs. Eur. J. Vasc.
Endovasc. Surg. 29, 74–77 (2005).
11. Edwards, H. E. et al. Predicting delayed healing: the diagnostic accuracy of a venous leg ulcer risk assessment tool. Int. Wound J.
15, 258–265 (2018).
12. Cardinal, M., Eisenbud, D. E., Phillips, T. & Harding, K. Early healing rates and wound area measurements are reliable predictors
of later complete wound closure. Wound Repair Regen. 16, 19–22 (2008).
13. Cardinal, M., Eisenbud, D. E., Phillips, T. & Harding, K. Early healing rates and wound area measurements are reliable predictors
of later complete wound closure. Wound Repair Regen. 16, 19–22 (2008).
14. Coyer, F.M., Edwards, H.E. & Finlayson, K.J. (Queensland University of Technology, Brisbane, Qld; 2005).
15. Edwards, H. et al. Health service pathways for patients with chronic leg ulcers: identifying effective pathways for facilitation of
evidence based wound care. BMC Health Serv. Res. 13 (2013).
16. Gray, D. et al. Effective wound management and wellbeing: guidance for clinicians, organisations and industry. Wounds UK 7,
86–90 (2011).
17. O’Meara, S., Cullum, N., Nelson, E.A. & Dumville, J.C. Compression for venous leg ulcers. Cochrane Database Syst. Rev. (2012).
18. AWMA & NZWCS (Cambridge Publishing, Australia; 2011).
19. Kantor, J. & Margolis, D. A multicentre study of percentage change in venous leg ulcer area as a prognostic index of healing at 24
weeks. Br. J. Dermatol. 142, 960–964 (2000).
20. Edwards, H. et al. Health service pathways for patients with chronic leg ulcers: identifying effective pathways for facilitation of
evidence based wound care. BMC Health Serv. Res. 13, 86 (2013).
21. Gaur, A., Sunkara, R., Raj, A. N. J. & Celik, T. Efficient wound measurements using RGB and depth images. Int. J. Biomed. Eng.
Technol. 18, 333–358 (2015).
22. Chang, A.C., Dearman, B. & Greenwood, J.E. A comparison of wound area measurement techniques: visitrak versus photography.
Eplasty 11 (2011).
23. Kaabouch, N. et al. Predicting neuropathic ulceration: analysis of static temperature distributions in thermal images. J. Biomed.
Opt 15, 061715 (2010).
24. Houghton, V. J., Bower, V. M. & Chant, D. C. Is an increase in skin temperature predictive of neuropathic foot ulceration in people
with diabetes? A systematic review and meta-analysis. J. Foot Ankle Res. 6, 31 (2013).
25. Ring, F. (SAGE Publications, 2010).
26. Bharara, M., Cobb, J. & Claremont, D. Thermography and thermometry in the assessment of diabetic neuropathic foot: a case for
furthering the role of thermal techniques. Int. J. Low. Extrem. Wounds 5, 250–260 (2006).
27. Barone, S., Paoli, A. & Razionale, A. V. Assessment of chronic wounds by three-dimensional optical imaging based on integrating
geometrical, chromatic, and thermal data. Proc. Inst. Mech. Eng. [H] 225, 181–193 (2011).
28. Aliahmad, B. et al. Is thermal imaging a useful predictor of the healing status of diabetes-related foot ulcers? A pilot study. J.
Diabetes Sci. Technol. 13, 561–567 (2019).
29. Ogrin, R. et al. Can Thermal Imaging Technique be Used to Predict the Healing Status of a Venous Leg Ulcer? Int J Low Extrem
Wounds, 15347346211002351 (2021).
30. KPMG. (ed. AWMA) 1–52 (2013).
31. Loizou, C. P., Kasparis, T. & Polyviou, M. Evaluation of wound healing process based on texture image analysis. J. Biomed. Gr.
Comput. 3, 1 (2013).
32. Parker, C., Finlayson, K. J. & Edwards, H. E. Ulcer area reduction at 2 weeks predicts failure to heal by 24 weeks in the venous leg
ulcers of patients living alone. J. Wound Care 25, 626–634 (2016).
33. Ogrin, R. et al. Can thermal imaging technique be used to predict the healing status of a venous leg ulcer? The International Journal
of Lower Extremity Wounds, 15347346211002351 (2021).
34. Kolkur, S., Kalbande, D., Shimpi, P., Bapat, C. & Jatakia, J. in International Conference on Communication and Signal Processing
2016 (ICCASP 2016) 324–332 (Atlantis Press, 2016).
35. Harrison, M., VanDenKerkhof, E., Hopman, W. & Carley, M. The role of preference on outcomes of people receiving evidence-
informed community wound care in their home or in a nurse-clinic setting: a cohort study (n = 230). Healthcare 2, 401 (2014).
36. Weller, C. & Evans, S. Venous leg ulcer management in general practice: Practice nurses and evidence based guidelines. Aust. Fam.
Physician 41, 331 (2012).
37. Groupa, F.W.H.C.F. Guidance for industry: Chronic cutaneous ulcer and burn wounds—developing products for treatment. Wound
Repair and Regeneration 9, 258–268 (2001).
38. Gould, L. & Li, W. W. Defining complete wound closure: closing the gap in clinical trials and practice. Wound Repair Regen. 27,
201–224 (2019).
39. Jørgensen, L. B., Sørensen, J. A., Jemec, G. B. & Yderstræde, K. B. Methods to assess area and volume of wounds – a systematic
review. Int. Wound J. 13, 540–553 (2016).
40. Wounds Australia (Cambridge Media, Osborne Park, WA; 2016).
41. Stacey, M. C., Phillips, S. A., Farrokhyar, F. & Swaine, J. M. Reliability and measurement error of digital planimetry for the meas-
urement of chronic venous leg ulcers. Wound Repair Regen. 25, 901–905 (2017).
42. Haralick, R.M., Shanmugam, K. & Dinstein, I.H. Textural features for image classification. IEEE Trans. Syst. Man Cybernet. 610–621
(1973).
43. Sheha, M. A., Mabrouk, M. S. & Sharawy, A. Automatic detection of melanoma skin cancer using texture analysis. Int. J. Comput.
Appl. 42, 22–26 (2012).
Scientific Reports | (2021) 11:13239 | https://doi.org/10.1038/s41598-021-92828-2 10
Vol:.(1234567890)www.nature.com/scientificreports/
44. Thulkar, D., Daruwala, R. & Sardar, N. An Integrated system for detection exudates and severity quantification for diabetic macular
edema. J. Med. Biol. Eng., 1–23 (2020).
45. Edn. 16.1 (Minitab, Inc. , State College, PA; 2010).
Acknowledgements
We acknowledge Bolton Clarke and RMIT for sharing the data collected from their earlier project which was
partially supported by Trajan Scientific and Medical Pty Ltd, Australia.
Author contributions
M.M. Image analysis. B.A. algorithm development, statistical analysis. R.O. project and clinical data management,
manuscript preparation. B.P. statistical analysis, J.A. data collection. K.E. clinical support. D.K. concept design,
planning and manuscript preparation.
Competing interests
The authors declare no competing interests.
Additional information
Correspondence and requests for materials should be addressed to D.K.
Reprints and permissions information is available at www.nature.com/reprints.
Publisher’s note Springer Nature remains neutral with regard to jurisdictional claims in published maps and
institutional affiliations.
Open Access This article is licensed under a Creative Commons Attribution 4.0 International
License, which permits use, sharing, adaptation, distribution and reproduction in any medium or
format, as long as you give appropriate credit to the original author(s) and the source, provide a link to the
Creative Commons licence, and indicate if changes were made. The images or other third party material in this
article are included in the article’s Creative Commons licence, unless indicated otherwise in a credit line to the
material. If material is not included in the article’s Creative Commons licence and your intended use is not
permitted by statutory regulation or exceeds the permitted use, you will need to obtain permission directly from
the copyright holder. To view a copy of this licence, visit http://creativecommons.org/licenses/by/4.0/.
© The Author(s) 2021
Scientific Reports | (2021) 11:13239 | https://doi.org/10.1038/s41598-021-92828-2 11
Vol.:(0123456789)You can also read