White-tailed Deer Monitoring at Wilson's Creek National Battlefield, Missouri - 2005-2018 Trend Report Natural Resource Report NPS/HTLN/NRR-2018/1703
←
→
Page content transcription
If your browser does not render page correctly, please read the page content below
National Park Service
U.S. Department of the Interior

Natural Resource Stewardship and Science

White-tailed Deer Monitoring at Wilson’s Creek
National Battlefield, Missouri
2005–2018 Trend Report
Natural Resource Report NPS/HTLN/NRR—2018/1703
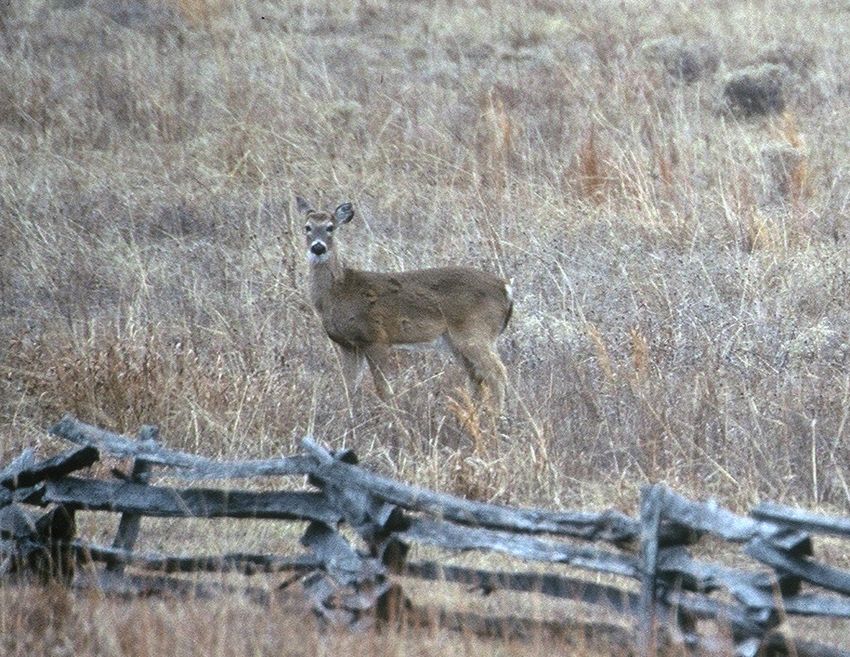
ON THE COVER
A white-tailed deer on Wilson’s Creek National Battlefield, Missouri
Photography by NPS/Heartland Inventory and Monitoring Network
White-tailed Deer Monitoring at Wilson’s Creek
National Battlefield, Missouri
2005–2018 Trend Report
Natural Resource Report NPS/HTLN/NRR—2018/1703

David G. Peitz, Jennifer L. Haack-Gaynor, Lloyd W. Morrison, and Mike D. DeBacker

National Park Service
Heartland Inventory and Monitoring Network
6424 W. Farm Rd. 182
Republic, Missouri 65738

Editing and Design by
Tani Hubbard

National Park Service &
Northern Rockies Conservation Cooperative
12661 E. Broadway Blvd.
Tucson, AZ 85748

August 2018

U.S. Department of the Interior
National Park Service
Natural Resource Stewardship and Science
Fort Collins, Colorado
The National Park Service, Natural Resource Stewardship and Science office in Fort Collins, Colorado, publishes
     a range of reports that address natural resource topics. These reports are of interest and applicability to a broad
     audience in the National Park Service and others in natural resource management, including scientists, conserva-
     tion and environmental constituencies, and the public.

     The Natural Resource Report Series is used to disseminate comprehensive information and analysis about natu-
     ral resources and related topics concerning lands managed by the National Park Service. The series supports the
     advancement of science, informed decision-making, and the achievement of the National Park Service mission.
     The series also provides a forum for presenting more lengthy results that may not be accepted by publications
     with page limitations.

     All manuscripts in the series receive the appropriate level of peer review to ensure that the information is scientif-
     ically credible, technically accurate, appropriately written for the intended audience, and designed and published
     in a professional manner.

     Data in this report were collected and analyzed using methods based on established, peer-reviewed protocols
     and were analyzed and interpreted within the guidelines of the protocols. This report received formal peer
     review by subject-matter experts who were not directly involved in the collection, analysis, or reporting of the
     data, and whose background and expertise put them on par technically and scientifically with the authors of the
     information.

     Views, statements, findings, conclusions, recommendations, and data in this report do not necessarily reflect
     views and policies of the National Park Service, U.S. Department of the Interior. Mention of trade names or
     commercial products does not constitute endorsement or recommendation for use by the U.S. Government.

     This report is available from Heartland Inventory and Monitoring Network website, and the Natural Resource
     Publications Management website. If you have difficulty accessing information in this publication, particularly if
     using assistive technology, please email irma@nps.gov. Please cite this publication as:

     Peitz, D. G., J. L. Haack-Gaynor, L. W. Morrison, and M. D. DeBacker. 2018. White-tailed deer monitoring at
     Wilson’s Creek National Battlefield, Missouri: 2005–2018 trend report. Natural Resource Report NPS/HTLN/
     NRR—2018/1703. National Park Service, Fort Collins, Colorado.

     NPS 410/147822, August 2018

ii          White-tailed Deer Monitoring at Wilson’s Creek National Battlefield, Missouri: 2005–2018 Trend Report
Contents
                                                                                                                                                                             Page

Figures . . . . .��������������������������������������������������������������������������������������������������������������������������������������������������������������� iv
Tables . . . . . ���������������������������������������������������������������������������������������������������������������������������������������������������������������� iv
Abstract . . . . .��������������������������������������������������������������������������������������������������������������������������������������������������������������v
Introduction . . . . .������������������������������������������������������������������������������������������������������������������������������������������������������� 1
        Objectives . . . . . ������������������������������������������������������������������������������������������������������������������������������������������������� 2
Method . . . . . ������������������������������������������������������������������������������������������������������������������������������������������������������������� 3
        Study Area . . . . . ������������������������������������������������������������������������������������������������������������������������������������������������ 3
        White-tailed Deer Survey Methods . . . . . ������������������������������������������������������������������������������������������������������������ 3
        Visibility Estimates . . . . . ������������������������������������������������������������������������������������������������������������������������������������� 3
        Data Analysis . . . . . ��������������������������������������������������������������������������������������������������������������������������������������������� 4
Results . . . . .��������������������������������������������������������������������������������������������������������������������������������������������������������������� 5
Discussion . . . . .���������������������������������������������������������������������������������������������������������������������������������������������������������� 8
Conclusions . . . . . ����������������������������������������������������������������������������������������������������������������������������������������������������� 10
Literature Cited . . . . .������������������������������������������������������������������������������������������������������������������������������������������������� 11

                                                                                                                                             National Park Service                      iii
Figures
                                                                                                                                                                            Page

     Figure 1. Adjusted count of deer (2005 through 2018) at Wilson’s Creek National Battlefield, Missouri. . . . . . ��������� 6
     Figure 2. Visible area (km2) surveyed during annual white-tailed deer counts on Wilson’s Creek National
     Battlefield, Missouri for years 2005 – 2018. . . . . . ������������������������������������������������������������������������������������������������������ 6
     Figure 3. Range in the adjusted count of deer color-coded from relatively low (gray) to high (dark blue)
     over 14 years of monitoring (2005–2018) at Wilson’s Creek National Battlefield, Missouri. . . . . . ������������������������������ 7

     Tables
                                                                                                                                                                            Page

     Table 1. Effort utilized to sample white-tailed deer on Wilson’s Creek National Battlefield, Missouri
     (2005–2018). . . . . .������������������������������������������������������������������������������������������������������������������������������������������������������ 4
     Table 2. Deer harvest numbers for the 2011-12 through 2017-18 hunting seasons for Christian and
     Greene counties in Missouri, the counties in which Wilson’s Creek National Battlefield is located . . . . .������������������������ 5

iv              White-tailed Deer Monitoring at Wilson’s Creek National Battlefield, Missouri: 2005–2018 Trend Report
Abstract
During 14 years (2005 – 2018) of white-tailed deer monitoring within a defined survey area of Wilson’s Creek
National Battlefield, we observed both a rapid decline and recovery. The rapid die-off was the result of a region-
wide hemorrhagic disease outbreak reported by the Missouri Department of Conservation that started in the
fall of 2005, six months after deer monitoring on the park was initiated. Even including data in the analysis from
years when the die-off was occurring (2006 and 2007), the number of deer still increased on average 10.5% annu-
ally. Deer counts in the survey area ranged from a low of 14.9 + 10.1 (mean + 95% CI) individuals/km2 in 2007 to
a high of 167.2 + 57.4 individuals/km2 in 2016. The amount of visible area surveyed each year varied between 0.6
and 1.1 km2 (coefficient of variation = 14.1%).
Annual deer harvest data in the area nearby Wilson’s Creek National Battlefield exhibit similar trends to our
annual adjusted counts. This suggests that factors other than hunting are driving annual changes in the size of
deer populations. An increasing number of deer poses several problems for the park. First, this trend will add a
level of complexity to implementing Wilson’s Creek National Battlefield Cultural Landscape Report recommen-
dations. Deer deferentially browse native vegetation over exotic vegetation, thus promoting the spread of exotic
species. The success of tree planting can be curtailed by heavy deer browsing as well. Second, controlling deer
related disease, some of which can affect domestic livestock and human health in and around the park, becomes
more and more difficult as the number of deer increases. Third, as additional ancillary data suggest, the largely
unreported and costly deer-vehicle collisions in and around the park have the potential to rise with an increasing
deer population.
National Park Service vIntroduction
Since European settlement, white-tailed deer is available in these small blocks of patchy habitat.
(Odocoileus virginianus) populations in North Grass and forb production is greater in these areas
America have experienced enormous changes in as is mast production by oaks, hickories and other
size and distribution. Once abundant deer popula- trees when compared to larger blocks of forested
tions declined to near extinction by the early 1900s. land (Peitz et al. 2001). Urban sprawl also redistrib-
Clearing of forested lands and unrestricted hunting utes deer by eliminating habitat in one area, thereby
contributed heavily to the decline of this species concentrating deer in available habitat in another
(Stoll and Donohoe 1973; Dennis 1983). Declines area (Shafer-Nolan 1997).
in the number of deer were especially prevalent
in the East and Midwest sections of the country Deer become vulnerable to overpopulation, disease
where much of the land was converted for row-crop and starvation in the absence of natural preda-
farming. tors and hunting. When deer occur in high densi-
ties, diseases are transmitted more readily. In years
Regulated white-tailed deer hunting and extermi- when forage or mast production is restricted due to
nation of most of their natural predators has led to climatic conditions, starvation or poor herd health
unprecedented population growth throughout their can occur. Deer browsing from high density herds
range. With natural deer habitat severely reduced, also has a negative effect on vegetation. Research
row-crop agriculture and other agriculture practices has shown that high deer populations contribute to
provide artificial food sources that deer utilize. The over-browsing of vegetation, which leads to plant
ability of white-tailed deer to adapt to human distur- mortality, decreased plant reproduction, and may
bance has also aided in the recovery of this species. tend to favor less preferred exotic species (McShea
Urban sprawl benefits deer by fragmenting continu- and Rappole 1997). This shift in species assemblages
ous blocks of forested lands into small sections with can reduce plant diversity at a local level and cause
increased edge habitat, which is favored by deer and changes in the functioning of prairie and woodland
rarely available for hunting. Therefore, deer experi- communities. However, the influence of deer on the
ence high rates of population growth as long as food status of most rare and sensitive plant species, such
White-tailed deer at Wilson’s Creek National Battlefield. NPS
1 White-tailed Deer Monitoring at Wilson’s Creek National Battlefield, Missouri: 2005–2018 Trend Reportas the Missouri bladderpod (Lesquerella filiformis) deer provides one measure for assessing their poten-
found on Wilson’s Creek National Battlefield, is tial as a problem for a park. Documenting long-term
largely unknown. Many studies have shown that deer patterns in the number of deer allows us to evaluate
can have a negative effect on developing forestland correlations with changes in vegetation (e.g., through
(Crouch and Paulson 1968; Horsely and Marquis restoration of the cultural landscape). With this
1983; Marquis 1981). Browsing on young tree information, resource managers can more effectively
seedlings causes stunted growth as well as mortal- identify and potentially mitigate damage caused to
ity (Michael 1992; Mladenoff and Stearns 1993). vegetation communities and endangered plant popu-
Research has shown that in some situations, damage lations by deer. Monitoring data also help managers
from deer as well as mice and rabbits may be a key assess safety risks from collisions and disease trans-
impediment to forest restoration projects (Crouch mission. In this report, we summarize results from 14
and Paulson 1968; Strole and Anderson 1992). years of monitoring white-tailed deer at the park.
White-tailed deer are often viewed as an impor-
Objectives
tant component of park ecosystems. Deer have a
The primary objectives for monitoring white-tailed
tremendous following among the public and many
deer at Wilson’s Creek National Battlefield, Missouri
parks provide information on the status of deer
are
through their interpretive programs. However, this
information is generally anecdotal in nature. White- ●● To determine annual changes in the number of
tailed deer can present a safety hazard to motorist white-tailed deer.
and park visitors when populations are high. High
deer populations have the potential to increase the Justification: Significant annual changes in the
number of deer-vehicle collisions and the result- number of deer may signal the presence of illegal
ing property damage and personal injuries. In some deer harvest, disease or other acute factors of
cases, deer-vehicle collisions can result in the loss of concern for park management.
human life. Deer also disperse ticks which may carry ●● To determine long-term trends in the number of
Lyme disease (Connelly et al. 1987). Lyme disease white-tailed deer.
is a debilitating immune system disease transmitted
to humans by the bite of ticks. Ticks carrying other Justification: Understanding decadal trends in the
human transmittable diseases such as Rocky Moun- number of deer will help park management deter-
tain Spotted Fever and Ehrlichiosis may be spread by mine if measures need to be taken to maintain herd
deer as well. Information on the status and trends in health, minimize vegetation damage within a park,
deer population size helps park managers determine or alleviate visitor health concerns.
if control measures are necessary to protect other ●● To annually map locations of white-tailed deer
park resources and improve visitor safety. observed.
It is against a backdrop of urban sprawl, altered Justification: Mapping deer locations allows park
ecosystems and concerns over visitor safety on management to assess the influences of manage-
National Park Service lands that we proposed moni- ment actions on deer usage of an area, habitat
toring white-tailed deer populations to assess their type, etc.
status and trends. Long-term trends in the number of
National Park Service 2Method
Study Area
Deer surveys were limited to an area visible at night
with spotlights along the main tour road that makes
a 7.90 km loop through Wilson’s Creek National
Battlefield. This permanent sampling route was
selected from all existing roads and trails within the
park, including service roads, because it is easily
traversed and passes through all major habitats found
on the park. It is important for long-term monitoring
that the survey route is an all-weather route so that it
will be passable shortly following inclement weather.
Counting deer along this road corridor will yield an
adjusted count of deer, which we assume is positively
related to abundance, but to an unknown degree.
The adjusted counts provide information to park
managers on trends in the park’s deer population and
may provide feedback on the effects of implemented
management efforts (e.g., population control or vege-
tation restoration efforts). Adjusted counts, defined
as the number of individuals observed from the road/
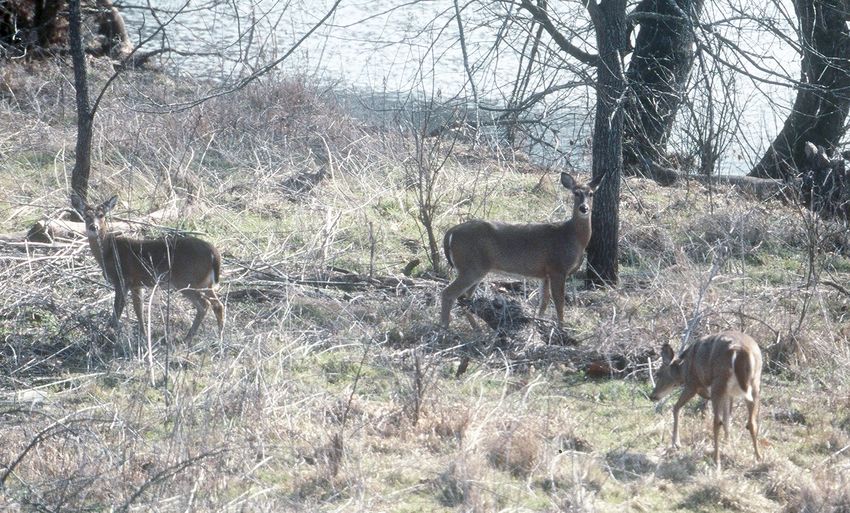
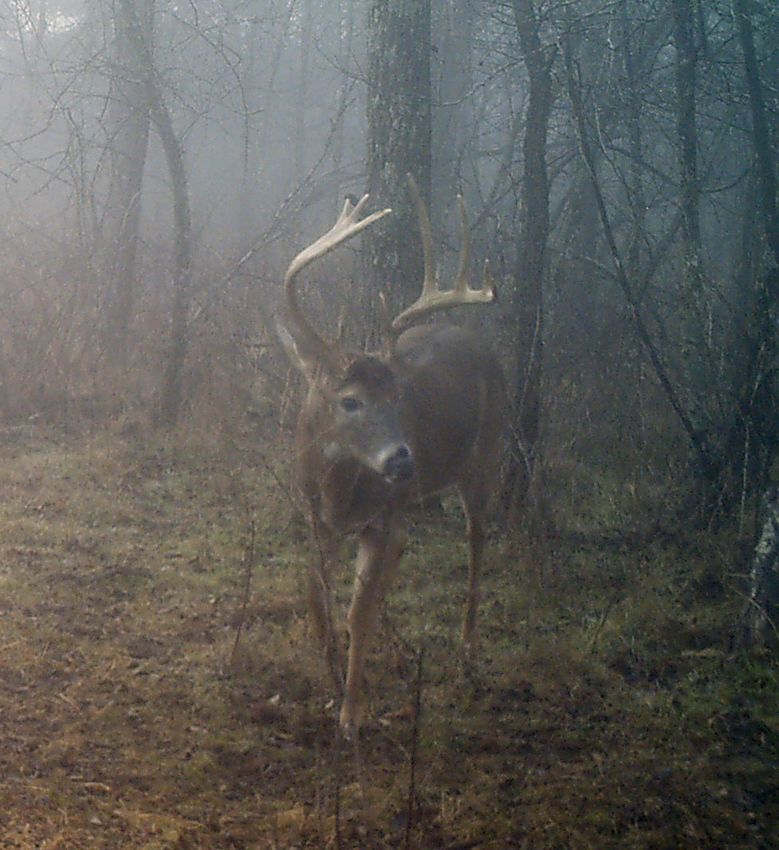
km2 of visible area, allow evaluation of annual change White-tailed deer buck at Wilson’s Creek National Bat-
tlefield. Image captured with a remote camera. NPS
in addition to long-term trends.
White-tailed Deer Survey Methods Following methods outlined in Peitz et al. (2007), an
Sampling was limited to winter months, before spring attempt was made to complete three survey replicates
vegetation emerged (January through mid-March). each night, exceptions being 2006 and 2007 when
Therefore, the target population included all deer one replicate each night was completed and the first
within the boundaries of Wilson’s Creek National and third week of surveys in 2018 when visibility esti-
Battlefield at the time surveys were conducted mates were taken during what would have been the
(although the sample frame was limited to the road third deer survey replicate in most other years (Table
corridor). These are the deer that most impact herd 1). Replicates started one hour after official sunset
size and park resources throughout the year. and then each hour thereafter.
Surveys were conducted from a survey vehicle Visibility Estimates
moving no more than 16 km/hr using two 1,000,000 Determining the area surveyed for white-tailed
candlepower spotlights. We counted all deer seen deer is critical for obtaining an adjusted count of
along the survey route and recorded their locations deer in the survey area. For most years, visibility
using GPS. Two observers counted deer, one seated was measured every 0.16 km (1/10th mile) along
on the left and the other on the right side of the the survey route. However, in years when multiple
vehicle. Distances from the stopped survey vehicle to measures were made, survey points were distributed
all deer were recorded using a rangefinder or a visual evenly around the tour road (i.e. 0.08 km [1/20th
estimate if the deer was less than 10 m from the vehi- mile] or 0.053 km [1/30th mile]). The location where
cle. Deer were usually observed in groups, in which each perpendicular measure was taken was marked
case distance was taken or estimated to the center using GNSS technologies. In an attempt to get a more
most deer in the group. To map locations of deer, the robust picture of how much area we were surveying
direction and angle of all deer or deer groups from along the route, the location of the survey vehicle
the survey vehicle were recorded as well. was adjusted slightly if objects were encountered that
blocked the true area observed during a survey. For
3 White-tailed Deer Monitoring at Wilson’s Creek National Battlefield, Missouri: 2005–2018 Trend ReportTable 1. Effort utilized to sample white-tailed deer on Wilson’s Creek National Battlefield, Missouri (2005–2018).
Survey Survey Visibility
Year Survey Dates Nights Replicates Replicates Notes
2005 March 2 – March 4 3 8 0* Deer locations and distances were
measured perpendicular to the survey
vehicle.
2006 January 11 – January 13 3 3 3 –
2007 February 13 – February 15 3 3 3 –
2008 January 3 – February 7 5 15 1 –
2009 January 8 – February 12 5 15 1 –
2010 January 5 – February 11 6 16 1 –
2011 January 6 – February 10 6 18 1 –
2012 January 5 – February 9 6 18 1 –
2013 January 3 – February 7 6 18 1 –
2014 January 9 – February 13 6 18 1 –
2015 January 8 – February 12 6 18 1 –
2016 January 7 - February 11 6 18 1 –
2017 January 12 – February 2 4 11 1 –
2018 January 10 – February 1 4 10 2 –
* Visible area was determined from data collected in 2006.
example, if the view of an open field was blocked We calculated an annual mean adjusted count of deer
by a single cedar tree in the ditch next to the survey from the nightly adjusted counts for that year, along
vehicle, we moved the vehicle forward or backward with a 95% confidence interval.
to see the field. Using GIS technologies, perpendicu-
lar distances were plotted on a map, a polygon was The software package TRIM (Trends and Indices for
created, and the visible area was determined. Monitoring Data; Pannekoek andVan Strien 2005)
was used to evaluate trends in deer monitoring data.
TRIM produces a regression line based on a loglin-
Data Analysis
ear model using generalized estimating equations,
For each survey night, an adjusted count of deer was which allows temporal autocorrelation to be taken
calculated by dividing the maximum count for that into account. To visually assess changes in habitat use
night by the visible area determined for that year: by deer, we mapped the location of individuals or
AC = MC/VA groups observed during the highest count each year.
AC = Adjusted Count (individuals/km2)
MC = Maximum Count for the survey night
VA = Visible Area (km2) determined for the
current year
National Park Service 4Results
Adjusted counts of white-tailed deer for the visible Conservation 2018) demonstrate survey results from
area on Wilson’s Creek National Battlefield ranged this study mirror deer hunter success in Christian
from 14.9 + 10.1 (mean + 95% CI) individuals/km2 in and Greene counties (Figure 1). Consistent deer
2007 to 167.2 + 57.4 individuals/km2 in 2016. Using harvest data are only available after the 2011/12 hunt-
TRIM, an upward trend (slope = 1.105, SE = 0.046) ing season. For all seven years of reported harvest
in the adjusted deer counts was established, and data, the number of deer harvested increased or
demonstrated a moderate increase (p < 0.05) over decreased similarly to increases and decreases seen in
the 14-year interval. This trend equates to an over- the number of deer within the visible area of Wilson’s
all increase in adjusted counts of 10.5% annually. Creek National Battlefield.
However, excluding the first two years of data when
the population was in a sharp decline, the annual The amount of visible area surveyed each year varied
percentage increase is 14.6%. Conversely, if only the between 0.6 and 1.1 km2 (coefficient of variation
last three years of data are analyzed (2016 – 2018), = 14.1%; Figure 2). The locations of individuals or
there was a significant 32.1% annual decrease. groups of deer were mapped for the highest replicate
count for that year (Figure 3).
Deer harvest data for Christian and Greene coun-
ties in Missouri (Table 2; Missouri Department of
Table 2. Deer harvest numbers for the 2011-12 through 2017-18 hunting seasons for Christian and Greene
counties in Missouri, the counties in which Wilson’s Creek National Battlefield is located (https://huntfish.
mdc.mo.gov/hunting-trapping/species/deer/deer-harvest-reports/deer-harvest-summaries).
Hunting Season Individuals harvested in Individuals harvested in Total individuals
(Year) Christian County Greene County harvested
2011-12 1773 2353 4126
2012-13 1995 2599 4594
2013-14 1856 2425 4281
2014-15 1779 2693 4472
2015-16 2170 2849 5019
2016-17 2178 2575 4753
2017-18 2309 2899 5208
5 White-tailed Deer Monitoring at Wilson’s Creek National Battlefield, Missouri: 2005–2018 Trend Report250
6000
5000
200
Individuals / Km2
4000
150
Deer
3000
100
2000
50
1000
0
0
Year
Figure 1. Adjusted count of deer (2005 through 2018) at Wilson’s Creek National Battle-
field, Missouri. Left axis shows adjusted count of deer (individuals/km2, + 95% CI) and
right axis shows number of deer harvested in hunting seasons 2011-12 through 2017-18
for Christian and Greene counties, the counties in which the park is located.
1.20
1.00
0.80
Km2
0.60
0.40
0.20
0.00
Year
Figure 2. Visible area (km2) surveyed during annual white-tailed deer counts on Wilson’s
Creek National Battlefield, Missouri for years 2005 – 2018. Visible area in 2005 was deter-
mined from measurements taken during 2006 surveys so represents only an approximation
of the area visible during surveys.
National Park Service 6Figure 3. Range in the adjusted count of deer color-coded from relatively low (gray) to high (dark blue) over 14 years of monitoring (2005–2018) at Wilson’s
Creek National Battlefield, Missouri. Visible area surveyed during annual counts is the extent of the colored area. Dots represent the locations where indi-
vidual or groups of deer were recorded during the highest replicate count for that year.
7 White-tailed Deer Monitoring at Wilson’s Creek National Battlefield, Missouri: 2005–2018 Trend ReportDiscussion
Over the 14 years of monitoring, the survey design of the cultural landscape. A number of studies have
has evolved. Adjustments to the sampling efforts demonstrated that habitat restoration efforts are
(Table 1) were made to improve sampling efficiency, negatively impacted as the number of deer increases
data quality, and post processing time. Sampling (Crouch and Paulson 1968; Marquis 1981; Horsely
in 2017 and 2018 (four survey weeks) reflects our and Marquis 1983; Michael 1992; Strole and Ander-
experiences with trying to survey as much of the son 1992; Mladenoff and Stearns 1993; Healy 1997;
winter survey window as possible while accounting McShea and Rappole 1997). Browsing of restored
for times when inclement weather would prohibit vegetation by deer may lead to an increase in exotic
conducting surveys. An attempt to survey deer plant species invasions. If deer alter vegetation
during a four-week winter period will be carried into communities to favor exotic plant species, this will
the future. Although sampling efforts have changed curtail the restoration of native plant communities
over the years, the actual method of spotlighting deer and increase the overall cost of restoration efforts.
and the data collected have remained unchanged. By Additional cost in both herbicides and manpower
consistently conducting counts of deer in the visible will be incurred to control the exotic species. The
area of Wilson’s Creek National Battlefield, we can shift in species assemblages can also reduce plant
assess their status and long-term trends. Long-term diversity at a local level and cause changes in the
trends in the number of deer provide one measure functioning of prairie and woodland communities
for assessing their potential as a problem for the park. not intended with the restoration efforts. Mortal-
ity of young tree seedlings caused by deer browsing
Similar to the evolution of sampling efforts, over the can often be quite high (Crouch and Paulson 1968;
years it was found that measuring visibility during Horsely and Marquis 1983; Marquis 1981; Tilgham
two survey nights each year and combining the 1989; Michael 1992; Strole and Anderson 1992;
measurements produced the most accurate and Mladenoff and Stearns 1993; Temblay et al. 2007).
robust estimate of visible area surveyed. An attempt Recruitment of oak trees is central to the restoration
to measure visible area twice each year and combine of the oak-savannah landscape. Successful restora-
the measurements to create an estimate of visible tion of the cultural landscape at Wilson’s Creek
area surveyed will be carried into the future. National Battlefield may need to be accompanied by
Across years, the adjusted counts of deer in the successful control of deer on the park.
visible area on the park varied widely. The low Trends in adjusted deer counts at the park mirror
number of deer recorded in 2007 came after a the success of deer hunters in Christian and Greene
two-year hemorrhagic disease outbreak (Missouri counties (Figure 1). If hunters are harvesting an equal
Department of Conservation, personal communica- proportion of the deer population from year to year,
tion 2008; Cribbs and Peitz 2008). However, by 2016 this suggests that numbers of deer, both within and
(nine years after the lowest reported numbers), the outside the battlefield, are fluctuating similarly from
highest number of deer for the park was recorded, year to year. In other words, deer populations appear
demonstrating the high reproductive potential of to be regulated by factors other than hunting. Known
white-tailed deer in an un-hunted population. Over- factors that regulate the deer population in the park
all, a moderate increase in the population of 10.5% include disease (e.g., hemorrhagic disease die-off
annually was observed even with the effects of a of 2005 – 2007 [Cribbs and Peitz 2008]; potentially
hemorrhagic disease die-off between 2005 and 2007, unreported disease outbreak in 2016), and possibly
and a sharp decline between 2016 and 2017 from road mortality from deer-vehicle collisions. If park
unknown causes. managers choose to reduce the number of deer
The Wilson’s Creek National Battlefield Environ- through culling, our results suggest a culling rate that
mental Assessment and Cultural Landscape Report exceeds regional hunting pressure may be required.
Implementation (NPS 2018) calls for the restora- Allowing the number of deer to increase until a
tion of oak savanna vegetation present at the time disease event occurs is a poor management strat-
of the battle. Deer browsing may inhibit restoration egy. Increasing populations expose deer, along
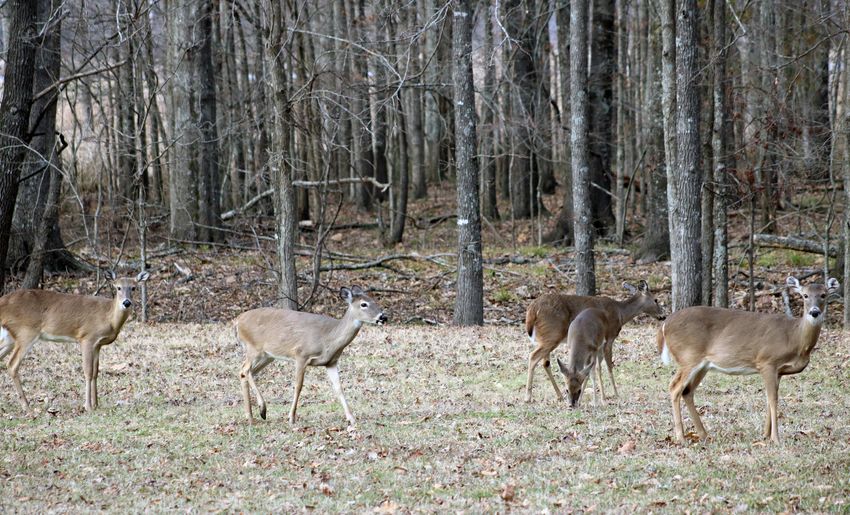
National Park Service 8White-tailed deer browsing along a forest edge. NPS
with livestock and humans to an increased risk of spotted fever, etc). Tick borne diseases are gener-
contracting a number of density-dependent diseases ally not fatal to deer but have devastating effects
such as hemorrhagic disease and chronic wasting on humans. While deer don’t transmit tick borne
disease (University of Missouri Extension 2018) diseases directly to humans they serve as both a host
among others. Hemorrhagic disease occurs in two species for the diseases and as a vector for spreading
different but closely related forms in Missouri, epizo- infected ticks.
otic hemorrhagic disease (EHD) and bluetongue
(BTV). Hemorrhagic disease can result in the loss of Deer in and around the park also pose a serious
50 percent or more of a local or regional deer popu- safety issue due to deer-vehicle collisions. Since 2002,
lation annually, and persist for several years (Figure law enforcement agencies in the state of Missouri
1). Epizootic hemorrhagic disease is not known to have been required to submit traffic accident reports
infect humans or domestic livestock. In contrast, to the Statewide Traffic Accident Records System
domestic sheep may develop severe illness and die (STARS) for accidents resulting in injury to or death
when infected with BTV. of a person, or total property damage in excess of
$500.00. Combined deer-vehicle collisions reported
Similar to EHD, chronic wasting disease is not for Christian and Greene county averaged 68.17
seen as a human or domestic livestock health issue. incidents annually (coefficient of variation = 13.97),
However, once established the disease spreads between 2005 and 2016 (Missouri State Highway
throughout a deer herd and is always fatal. Chronic Patrol 2018). Between 2005 and 2016, 15 (average
wasting disease is transmitted by direct animal-to- 1.25 per year) accidents involving animal collisions
animal contact or soil to animal contact and is nearly were recorded within a mile of the park boundary,
impossible to eradicate from a population. The cull- of which 12 incidents involved deer. No accident
ing of deer and the minimizing of unnatural concen- resulted in a human fatality. Monitoring by the Heart-
trations of deer are the only methods currently avail- land Inventory and Monitoring Network suggests
able for managing the spread of this disease. that the number of deer-vehicle collisions around
the periphery of the park could be higher. In fact, for
Another concern for human and domestic livestock the last eight months of the reporting period (April –
health are any one of the numerous tick transmitted December 2016), 26 deer were observed dead either
diseases (lyme disease, ehrlichiosis, rocky mountain on the road or in the road right-of-way.
9 White-tailed Deer Monitoring at Wilson’s Creek National Battlefield, Missouri: 2005–2018 Trend ReportConclusions
With 14 years of monitoring data for Wilson’s Creek The amount of visible area that was surveyed each
National Battlefield, we were able to capture both year varied between 0.6 and 1.1 km2 (coefficient of
a disease outbreak and a rapid recovery in the deer variation = 14.1%). Hunting success in the region
population under study. The adjusted count of deer closely correlates to our annual population index,
quadrupled between 2007 and 2010 following a two- suggesting that annual fluctuations in the number
year decline. Overall, the deer population increased of deer, both within and outside the battlefield, are
at a moderate pace, averaging 10.5% annually when driven by factors other than hunting. An increasing
data from years with declines (i.e. 2006–2007 and deer population poses several problems for Wilson’s
2016) were included in the analysis. The number of Creek National Battlefield related to implementing
deer in the survey area ranged from a low of 14.9 + their Cultural Landscape Report recommendations,
10.1 individuals/km2 in 2007 to a high of 167.2 + 57.4 mitigating domestic livestock and human health
individuals/km2 in 2016. concerns, and decreasing costly deer-vehicle colli-
sions on roads in and around the park.
National Park Service 10Literature Cited
Connelly, N. A., D. J. Decker, and S. Wear. 1987. Missouri Department of Conservation. 2018.
Public tolerance of deer in a suburban Missouri deer harvest summaries. Available at:
environment: implications for management https://huntfish.mdc.mo.gov/hunting-trapping/
and control. Eastern Wildlife Damage Control species/deer/deer-harvest-reports/deer-harvest-
Conference 3:207-217. summaries (accessed 12 April 2018).
Cribbs, J. T., and D. G. Peitz. 2008. White-tailed Missouri State Highway Patrol. 2018. Statewide traffic
deer monitoring at Wilson’s Creek National accident records system (STARS). Available at:
Battlefield, Missouri: 2008 status report. Natural https://www.mshp.dps.missouri.gov/TR15Map/
Resource Technical Report NPS/HTLN/ index.jsp (accessed 11 April 2018).
NRTR—2008/102. National Park service, Fort
Collins, Colorado. Mladenoff, D. J., and F. Stearns. 1993. Eastern
hemlock regeneration and deer browsing in the
Crouch, G. L., and N. R. Paulson. 1968. Effects of Northern Great Lakes region: a re-examination
protection from deer on survival and growth and model simulation. Conservation Biology
of Douglas-fir seedlings. USDA Forest Service, 7:889-900.
Pacific Northwest Forest Range Experiment
Station Reserve, Research Note 94. National Park Service (NPS). 2018. Wilson’s Creek
NB environmental assessment and cultural
Dennis, D. F. 1983. An analysis of Ohio’s forest landscape report implementation. Midwest
resources. USDA Forest Service, Northeast Region, Cultural Resources.
Research Station, Research Bulletin NE-75.
Pannekoek J., and A. J. Van Strien. 2005. TRIM 3
Healy, W. M. 1997. Influence of deer on the manual (trends and indices for monitoring
development of forest structure and data). Statistics Netherlands. Technical report.
composition in central Massachusetts. Pages
249-266 in W. J. McShea, H. B. Underwood, Peitz, D. G., M. G. Shelton, and P. A. Tappe. 2001.
and J. H. Rappole, editors. The science of Forage production after thinning a natural
overabundance: deer ecology and population loblolly pine-hardwood stand to different basal
management. Smithsonian Institute Press, areas. Wildlife Society Bulletin 29:687-705.
Washington, D.C., USA. Peitz, D. G., J. T. Cribbs, J. L. Haack, G. A. Rowell,
Horsely, S. B., and D. A. Marquis. 1983. Interference L. W. Morrison, and M. D. DeBacker. 2007.
by weeds and deer with Allegheny hardwood White-tailed deer monitoring protocol for the
reproduction. Canadian Journal of Forest Heartland Network Inventory and Monitoring
Research 13:61-69. Program. Natural Resource Report NPS/
HTLN/NRR—2007/014. National Park service,
Marquis, D. A. 1981. Effect of deer browsing on Fort Collins, Colorado.
timber production in Allegheny hardwood
forests of northwestern Pennsylvania. USDA Shafer-Nolan, A. L. 1997. The science and politics
Forest Service Research Paper NE-475. of deer overabundance at Cuyahoga Valley
National Recreation Area, Ohio. Wildlife Society
McShea, W. J., and J. H. Rappole. 1997. The science Bulletin 25:457-461.
and politics of managing deer within a protected
area. Wildlife Society Bulletin 25:443-446. Stoll, R. J., Jr., and R.W. Donohoe. 1973. White-
tailed deer harvest management in Ohio. Ohio
Michael, E. D. 1992. Impact of deer browsing on Department of Natural Resources, Division of
regeneration of balsam fir in Canaan Valley, Wildlife, In Service Document 73.
West Virginia. Northeastern Journal of Applied
Forestry 9:89-90.
11 White-tailed Deer Monitoring at Wilson’s Creek National Battlefield, Missouri: 2005–2018 Trend ReportStrole, T. A., and R. C. Anderson. 1992. White- Tilgham, N. G. 1989. Impacts of white-tailed
tailed deer browsing: species preferences and deer of forest regeneration in Northwestern
implications for central Illinois forests. Natural Pennsylvania. Journal of Wildlife Management
Areas Journal 12:139-144. 53(3):524-532.
Temblay, J-P., J. Huot, and F. Potvin. 2007. Density- University of Missouri Extension. 2018. Potential
related effects of deer browsing on the diseases and parasites of white-tailed deer
regeneration dynamics of boreal forest. Journal in Missouri. Available at: https://extension2.
of Applied Ecology 44(3):552-562. missouri.edu/g9489 (accessed 12 April 2018).
National Park Service 12The Department of the Interior protects and manages the nation’s natural resources and cultural heritage; provides scientific and other information about those resources; and honors its special responsibilities to American Indians, Alaska Natives, and affiliated Island Communities. NPS 410/147822, August 2018
National Park Service
U.S. Department of the Interior

Natural Resource Stewardship and Science
1201 Oak Ridge Drive, Suite 150
Fort Collins, Colorado 80525

E X P E R I E N C E Y O U R A M E R I C A™
You can also read