ACHS 2021 Clinical Indicator Program Information - THE ...
←
→
Page content transcription
If your browser does not render page correctly, please read the page content below

ACHS 2021
    Clinical Indicator
Program Information

                                                                5 Macarthur Street
                                                                ULTIMO NSW 2007
                                                                Phone: (02) 9281 9955
                                                                Fax: (02) 9211 9633
                                                                E-mail: pos@achs.org.au
                                                                Website: http://www.achs.org.au
               The Australian Council on Healthcare Standards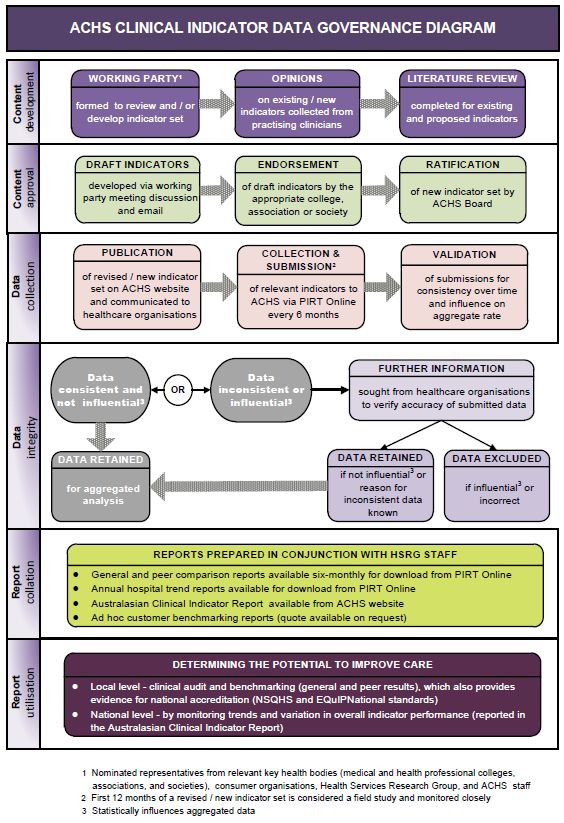
ACHS 2021 Clinical Indicator Program Information

Published by the Australian Council on Healthcare Standards (ACHS)
5 Macarthur Street, ULTIMO NSW 2007
Copies available from the ACHS Performance and Outcomes Service
Phone: 61 2 9281 9955
Fax: 61 2 9211 9633
E-mail: pos@achs.org.au
Website: www.achs.org.au
© The Australian Council on Healthcare Standards 2020

This work is copyright. Apart from any use as permitted under the Copyright Act 1968, no part may
be reproduced by any process without written permission from The Australian Council on Healthcare
Standards (ACHS).

Developed Date: September 2000                       Last Revised Date: March 2021

ACHS 2021 Clinical Indicator Program Information                                              1
CONTENTS

INTRODUCTION ............................................................................................................................... 3

ABOUT THE PERFORMANCE AND OUTCOMES SERVICE ........................................................... 4

WHAT ARE CLINICAL INDICATORS? ............................................................................................. 5

THE PROCESS OF CLINICAL INDICATOR ..................................................................................... 7

DEVELOPMENT AND REVIEW ........................................................................................................ 7

BENEFITS OF COLLECTING ACHS CLINICAL INDICATORS......................................................... 7

USING ACHS CLINICAL INDICATOR DATA .................................................................................... 8

HOW IS A CLINICAL INDICATOR STRUCTURED? ......................................................................... 9

CLINICAL INDICATOR DATA GOVERNANCE DIAGRAM ............................................................. 12

ACHS CLINICAL INDICATOR REPORTS....................................................................................... 13

WHAT AREAS DO THE CURRENT CLINICAL INDICATOR SETS COVER? ................................. 16

APPENDIX 1: SAMPLE COMPARATIVE REPORT ........................................................................ 19

Sample Report ............................................................................................................................... 23

ACHS 2021 Clinical Indicator Program Information                                                                                           2
INTRODUCTION

This document provides information about the Performance and Outcomes Service and the function
of the ACHS Clinical Indicator Program.
For further copies of this document or for additional information relating to Clinical Indicators please
contact:
ACHS Performance and Outcomes Service
5 Macarthur Street
ULTIMO NSW 2007
Phone: 61 2 9281 9955
Fax: 61 2 9211 9633
E-mail: pos@achs.org.au

Other publications:
• The ACHS Clinical Indicator User Manuals are published annually with updated Clinical Indicators
  available for collection in the coming year.
• The ACHS Clinical Indicator Summary Guide is published annually with updated Clinical Indicators
  available for collection in the coming year.
• The Australasian Clinical Indicator Report is published annually and reports aggregate results for
  all published Clinical Indicators.

ACHS 2021 Clinical Indicator Program Information                                                    3
ABOUT THE PERFORMANCE AND OUTCOMES SERVICE

The role of the Performance and Outcomes Service (POS) is to coordinate the development, collection,
collation, analysis, and reporting of the Clinical Indicators (CIs). The ACHS, through the Performance
and Outcomes Service has considerable information on over 330 CIs with more than 620 healthcare
organisations (HCOs) participating in the ACHS Clinical Indicator Program. Information from the CIs is
the largest source of data gathered on the quality of healthcare in Australia and New Zealand.

What is the ACHS Clinical Indicator Program?

The ACHS Clinical Indicator Program is a data repository, analysis and reporting service provided to
member HCOs. It provides a national clinical benchmarking service and is comprised of comparative
information on the processes and outcomes of health care. Participating HCOs are able to submit CI
data for inclusion in an extensive database. Data are aggregated and analysed six-monthly and results
are provided in the form of comparative reports. These reports compare results across all contributing
HCOs as well as providing a comparison with 'peer’ HCOs based on a number of variables.
The POS team also provides individual support to HCOs, via telephone and e-mail. Consultancies can
be arranged through the ACHS Improvement Academy and Lead Programs are provided on a range of
topics related to performance improvement. The Clinical Indicator Program provides all the necessary
products, tools and services required for members to participate. These resources are available via a
secure website where members can also submit and download the CI data.

Who can subscribe?

Subscription to the ACHS Clinical Indicator Program is free for ACHS accreditation members. All ACHS
members are encouraged to submit indicator data to demonstrate continuous quality improvement.
Non-ACHS accredited organisations may subscribe and a membership fee applies. Fees are based on
a calendar year subscription.

ACHS 2021 Clinical Indicator Program Information                                                   4
WHAT ARE CLINICAL INDICATORS?

A Clinical Indicator (CI) is simply a measure of the clinical management and/or outcome of care.1 A
well-designed indicator should ‘screen’, ‘flag’ or ‘draw attention’ to a specific clinical issue. Usually
rate-based, indicators identify the rate of occurrence of an event. CIs do not provide definitive
answers; rather they are designed to indicate potential problems that might need addressing, by
identifying variations within data results.2 They are used to assess, compare and determine the
potential to improve care.3 CIs are therefore, tools to assist in assessing whether or not a standard in
patient care is being met.
There is growing recognition that a capacity to evaluate and report on quality is a critical building block
for system-wide improvement of healthcare delivery and patient outcomes.4 HCOs are frequently
being requested to provide data on many aspects of their facility to a variety of stakeholders. CI results
provide valuable information in assessing the performance of health services. This focus on
performance management has emerged through increased competition, a more recent focus on
quality improvement and safety and an increased demand for evidence of performance.
The use of CIs is an effective tool for measuring and managing the quality of clinical care providing the
relevant clinicians are involved and supported with adequate resources to undertake such clinical
audit. The reporting of CIs to the ACHS is not a mandatory component of the accreditation process.
However, HCOs are required to demonstrate their achievements through the use of data. To do this,
HCOs may either use ACHS CIs or other indicators. HCOs also need to demonstrate at the time of
survey, evidence of improving performance through evaluation, supported by data.
The ACHS has been involved in the development of CIs in conjunction with Australian and New Zealand
medical colleges, associations and societies since 1989. In this time, the program has seen the
development of Hospital-Wide and specific sets of CIs.

Types of Indicators
CIs can be classified according to the aspects of care they address. A comprehensive view of healthcare
performance can be built up by investigating information from a variety of sources about different
aspects of care.
Indicators will measure either:
• Structure (what is needed)
• Process (what is done)
• Outcome (what is achieved or expected).

1
 Collopy BT. Clinical indicators in accreditation: an effective stimulus to improve patient care. Int J Qual Health
Care 2000; 12(3): 211-216.
2
 Campbell S, Braspenning J, Hutchinson A and Marshall M. Research methods used in developing and applying
quality indicators in primary care. Qual Saf Health Care 2002; 12(3): 358-364.
3
 Howley P and Gibberd R. Using hierarchical models to analyse clinical indicators: a comparison of the gamma-
Poisson and beta-binomial models Int J Qual Health Care 2003; 15(4): 319-329.
4
 Miller T and Leatherman S. The National Quality Forum: A ‘Me-Too’ Or A Breakthrough In Quality Measurement
And Reporting? Health Aff (Millwood) 1999; 18(6): 233-237.

ACHS 2021 Clinical Indicator Program Information                                                                  5
Structure Indicators
Structure indicators provide important information about the organisation’s environment
(infrastructure, physical layout and resources, human resources and organisational framework)
required for the provision of quality health care.
An example of a structure indicator is:
    •   Number of patients who undergo a procedure with an anaesthetist in attendance where there
        is a trained assistant to the anaesthetist5 (Numerator ANAE CI 2.1)

Process Indicators
Process indicators actually measure what is being done in providing the care. Process indicators
provide quantitative data regarding the impact or effectiveness of systems, policies and procedures
and can monitor changes over time when measured repeatedly.
An example of a process indicator is:
    •   Number of patients who have documentation of risks and benefits of the anaesthetic
        procedure(s) completed by an anaesthetist prior to transfer to the operating suite or procedure
        room (Numerator ANAE CI 1.1)

Outcome Indicators
Outcome refers to the result of care and outcome indicators provide quantitative data related to the
outcomes of health system performance.
An example of an outcome indicator is:
    •   Number of patients undergoing treatment for postoperative nausea and vomiting in the post-
        anaesthesia recovery room (Numerator ANAE CI 3.2)

It is often difficult to develop definitive outcome indicators and therefore ‘surrogate’ outcome
indicators may be used.
According to Donabedian6, these three areas of care are interlinked, in that sound structures facilitate
good processes, which in turn facilitate positive outcomes, the endpoint of care. Donabedian
postulated that quality improvement is enabled by receiving feedback about these three aspects of
care and responding to that feedback. He called these measures, indicators of quality. Indicators of
quality are not direct or definitive measures of quality in themselves. Rather as their name suggests
they indicate areas of care requiring greater scrutiny.

5
 ACHS Performance and Outcomes Service. Anaesthesia and Perioperative Care version 6: Clinical Indicator
User Manual. Sydney NSW; Australian Council on Healthcare Standards; 2015.
6
    Donabedian A. The quality of care. How can it be assessed? JAMA 1988; 260(12): 1743-1748.

ACHS 2021 Clinical Indicator Program Information                                                           6
THE PROCESS OF CLINICAL INDICATOR
DEVELOPMENT AND REVIEW
The Performance and Outcomes Service (POS) has a collaborative framework for developing Clinical
Indicators (CIs) which is based on:
• Established working relationships with medical colleges, associations, societies and other
relevant clinical organisations
• An established working relationship with a department of clinical epidemiology and
biostatistics to ensure the rigour, reliability, validity and relevance of the CIs
• A multidisciplinary approach to indicator development
• Development of a broad range of CIs for use in acute and non-acute settings
• Provision of regular analyses/reports to individual HCOs
• Publication of an annual report of indicator results and trends
New CI sets are developed when there is interest from specialty colleges and organisational demand.
A CI set is regularly reviewed to ensure:
• it is relevant for clinicians;
• it remains reflective of today’s health care environment;
• there is consensus of collection and reporting requirements and;
• the set remains useful for quality improvement.
For more information about the development process please contact the Performance and Outcomes
Service on +61 2 9281 9955.
BENEFITS OF COLLECTING ACHS CLINICAL INDICATORS
The benefits of collecting ACHS Clinical Indicators (CIs) are outlined below:
• Formal clinical audit processes inherent in the Clinical Indicator Program encourage evaluation of
care by the relevant clinicians. Clinician involvement is imperative if quality improvements are to
be achieved.
• Strategic benchmarking program which provides comparison of results with national and peer
group HCOs and is the largest clinical data set of its kind in Australasia.
• The six-monthly comparative reports enable early recognition of areas of potential improvement.
• The evidence addressing the utilisation of CI data and the associated involvement of relevant
clinician groups supports HCO participation in the ACHS program and the achievement of
appropriate levels in mandatory criteria.
ACHS 2021 Clinical Indicator Program Information 7USING ACHS CLINICAL INDICATOR DATA There are 21 Clinical Indicator (CI) sets and over 330 CIs to choose from in the ACHS Clinical Indicator Program. There is no requirement that an organisation monitor a specific number of CIs. HCOs are required to consider CIs that relate to the health services they provide and are appropriate to their size and type of organisation. The ability to effect improvements in patient care will depend on the relevance of the CIs being monitored. To identify those CIs which are potentially relevant and appropriate, the following points should be considered: • Will the information be useful and meaningful to clinicians in demonstrating how the service is performing and ways that it may be improved? • Will the data be accessible to clinicians to allow for monitoring of the CI? • Are existing resources sufficient to allow for ongoing monitoring of the CI? The ability of the ACHS CI data to influence and improve the standards of clinical care is dependent on the relevance of the CIs to current clinical practice (largely determined by the relevant medical college, society or association), and the resources available to support clinicians in assessing the data and considering alterations to either individual or clinical unit practice. Utilisation of CI data occurs at local HCO and national levels. Local HCO level Six-monthly comparative reports and the HCO trend reports (currently supplied annually) provide quantitative data identifying variation from total aggregate and peer group rates. The reports highlight results which are statistically significantly ‘different’ to all other HCOs submitting data for that particular CI and where the results are undesirably lower or higher than the expected rate. Over 90% of Australian HCOs are accredited, and the majority provide CIs to the ACHS. Utilisation of ACHS CIs is not mandatory within the ACHS accreditation process. However, all HCOs are required to show evidence of monitoring, evaluation and improvement using clinical data. Monitoring relevant CIs within a benchmarking program is one method by which this can be achieved. Additionally, ACHS surveyors are provided with the latest CI reports prior to survey. Surveyors discuss CI results with HCOs and results are frequently used as a valid source of clinical audit criteria for accreditation purposes. National Level: The Australasian Clinical Indicator Report In the Australasian Clinical Indicator Report, the data is assessed from a national perspective providing a statistical analysis of aggregated results for each of the published CIs. The results provide health policy planners with relevant information, particularly results addressing access issues, and professional organisations, such as medical colleges and societies, with information highlighting variation in practice which may assist in improving standards of care. ACHS 2021 Clinical Indicator Program Information 8
HOW IS A CLINICAL INDICATOR STRUCTURED?

All Clinical Indicators (CIs) follow a similar structure with an example given below:

                          INFC AREA 4: Vancomycin resistant enterococci (VRE)

 Rationale

 According to the Australian Group on Antimicrobial Resistance (AGAR), the prevalence of VRE
 infection is rising in Australia. These healthcare-associated infections (HAIs) are commonly seen in
 high-risk areas such as intensive care units, haematology and oncology units and dialysis centres.

                                                                            (See Background for more information)

Reporting period

 1 January – 30 June                                                                               1 July – 31 December

Inclusions
     •    Only vancomycin resistant enterococci (VRE) laboratory confirmed bloodstream infections are
          to be INCLUDED.

Exclusions
     •    VRE colonisations are to be EXCLUDED.

Data cleaning rules
     •    Nil

Definition of terms

A healthcare-associated infection (HAI) is an infection that occurs as a result of a healthcare
intervention. Infections identified > 48 hours after the admission and not incubating on admission
or ≤ 48 hours after discharge should be reported as HAIs. Infections identified ≤ 48 hours after the
admission need further evidence to be confirmed as HAIs. Please refer to the Australian Commission
on Safety and Quality in Health Care (ACSQHC)1 and National Health and Medical Research Council
(NHMRC) Australian Guidelines for the Prevention and Control of Infection in Healthcare2 for further
clarification.

1. Implementation Guide for Surveillance of Staphylococcus aureus Bacteraemia. Australian Commission on Safety and Quality
   in Health Care; 2013.
   https://www.safetyandquality.gov.au/wpcontent/uploads/2012/02/SAQ019_Implementation_guide_SAB_v10.pdf
2. Australian Guidelines for the Prevention and Control of Infection in Healthcare, National Health and Medical Research
   Council; 2010. https://www.nhmrc.gov.au/printpdf/book/export/html/51607

ACHS 2021 Clinical Indicator Program Information                                                                           9
For the purpose of CI 4.1:
AIHW’s definition at http://meteor.aihw.gov.au/content/index.phtml/itemId/181162 is used for
‘bed days’ or ‘patient days’ calculated by counting the total patient days of those patients separated
during the specified period, including those admitted before the specified period. Patient days of
those patients admitted during the specified period who did not separate until the following
reference period are not counted.
For the purpose of CI 4.1:
ICU bed days are defined as the total number of occupied bed days in the intensive care unit (ICU).
Indicator(s) within this Area
CI 4.1: VRE infection within the ICU (L)
Number of ICU associated new vancomycin resistant enterococci (VRE) healthcare-associated
Numerator
infections, during the 6-month reporting period.
Denominator Number of ICU bed days, during the 6-month reporting period.
Desirable rate: High Low Not specified
Indicator type: Structure Process Outcome
Background
In 1986, the first noted cases of Vancomycin Resistant Enterococci (VRE) were reported in the United
Kingdom and France.1-3 Since then, the incidence of HAIs as a result of VRE has increased sharply and
been prevalent in the United States, Australia and other areas of Europe. 1,2 Considering that
vancomycin had been in use for more than 30 years prior to the first reported case of resistance, this
came as a shock to the medical and scientific community.2 Their belief that resistance to glycopeptides
was unlikely to occur dissipated with the wide-spread transmission of VRE in the United States and
European hospitals over the subsequent decades.2
According to the Australian Group on Antimicrobial Resistance (AGAR), the prevalence of VRE infection
is rising in Australia, but not at the same rate as seen internationally.1 It is believed that this could be
partly due to the effective management of colonised patients prior to the transmission of this
infection.1 The most common forms of VRE isolates causing HAIs that result in hospital-associated
morbidity and mortality are Enterococcus faecium and Enterococcus faecalis.3 These HAIs are
commonly seen in high-risk areas such as:
• Intensive Care Units
• Haematology and Oncology Units
• Dialysis Centres.1,4,5
“The emergence of resistance to various antimicrobial agents, specifically to vancomycin, has become
a major clinical and epidemiological threat”.6 This resistance usually occurs with the heavy use of
glycopeptides and broad spectrum antibiotics in the aforementioned high-risk areas.5,6 The treatment
options for enterococcal sepsis are limited due to the emergence of vancomycin resistance.5 The most
clinically relevant resistant phenotypes are:
• vanA – acquired high-level resistance to vancomycin and teicoplanin
• vanB – acquired moderate level resistance to vancomycin and in vitro susceptibility to
teicoplanin.1,5,7,8
ACHS 2021 Clinical Indicator Program Information 10In order to reduce the transmission of this infection in hospitals, it is recommended that screening for
VRE occur in an outbreak situation, which is in line with the HCO’s guideline. Once the laboratory has
confirmed the presence of VRE infection, it is imperative that the key personnel be notified to initiate
the appropriate contact precautions.5 The process to prevent the transmission of infection for those
admitted and transferred between wards should involve:
• Medical practitioner(s) responsible for the care of the patient
• Nurse in charge of the ward or unit
• Infection control personnel
• Other personnel specified in the healthcare organizations VRE policy. 5
References
1. Australian Commission on Safety and Quality in Health Care (ACSQHC). Reducing harm to patients from health care
associated infection: the role of surveillance. Sydney NSW: ACSQHC; 2008.
2. Cattoir V, Leclercq R. Twenty-five years of shared life with vancomycin-resistant enterococci: is it time to divorce? J
Antimicrob Chemother. 2013;68(4):731-42.
3. Lu C-L, Chuang Y-C, Chang H-C, Chen Y-C, Wang J-T, Chang S-C. Microbiological and clinical characteristics of
vancomycin-resistant Enterococcus faecium bacteraemia in Taiwan: implication of sequence type for prognosis. J
Antimicrob Chemother. 2012;67(9):2243-9.
4. Queensland Health. Screening and Clearance of Multi-resistant Organisms (MRO)June 2012 10th December, 2013.
Available from: http://www.health.qld.gov.au/chrisp/policy_framework/guideline_4_MRO.pdf.
5. South Australia Health. Guidelines for the Management of Patients with Vancomycin-resistant Enterococcus (VRE)
Colonisation/Infection. Management of Multi-Resistant Organisms [Internet]. August 2012 12th December, 2013.
Available from: http://www.health.sa.gov.au/INFECTIONCONTROL/Default.aspx?tabid=115.
6. Hayakawa K, Marchaim D, Martin E, Tiwari N, Yousuf A, Sunkara B, et al. Comparison of the clinical characteristics and
outcomes associated with vancomycin-resistant Enterococcus faecalis and vancomycin-resistant E. faecium
bacteremia. Antimicrob Agents Chemother. 2012;56(5):2452-8.
7. Centre for Healthcare Related Infection Surveillance and Prevention. Protocol for the management of patients with
vancomycin resistant Enterococcus (VRE)April 2013 10th December, 2013. Available from:
http://www.health.qld.gov.au/directives/docs/ptl/qh-hsdptl-029-2.pdf.
8. Healthcare Infection Surveillance Western Australia (2012). HISWA Surveillance Manual. Perth WA: HISWA.
ACHS 2021 Clinical Indicator Program Information 11CLINICAL INDICATOR DATA GOVERNANCE DIAGRAM ACHS 2021 Clinical Indicator Program Information 12
ACHS CLINICAL INDICATOR REPORTS

Data collection periods

There are two reporting periods each year:
•   January to June - HCOs must submit their data to the ACHS by 20 August
•   July to December - HCOs must submit their data to the ACHS by 20 February

The collection, analysis and reporting system

Program members are supplied with comprehensive information on how to collect the data which is
supplied in the Clinical Indicator (CI) User Manual. Further support is provided by Performance and
Outcome Service (POS) team members via phone and email. In terms of collecting the data, the ACHS
is not prescriptive about how HCOs collect the data, for example some indicators are collected via
manual audit of medical records while others can be generated from internal computer systems, for
example, adverse event or risk management systems. HCOs should however ensure they collect the
information in strict accordance with the definitions in the User Manual. This ensures that data
submitted to ACHS’ National Aggregate Indicator Database (NAID) is consistent.
HCOs are required to submit their data to the ACHS using the Performance Indicator Reporting Tool
(PIRT). This tool, known as PIRT Online, is accessible via a secure internet site.

Reports to individual healthcare organisations

Six-monthly comparative reports

The comparative reports are provided on a six-monthly basis and are designed with simplicity and
ease of use in mind. Compare your facility’s performance against all others submitting data for a CI
and against similar (peer group) facilities.
Each report provides information to identify statistically significant differences between the individual
organisation, all HCOs and peer groups. Outlier data is easily flagged for follow up and to facilitate
communication of results to relevant clinicians and management.
The reports also identify potential gains to be made if a HCO’s rate was improved to that of the average
and provides information on peer and Australian / New Zealand participation.
Reports are available to members approximately six to seven weeks after the end of the data
submission period. A Sample Report is provided in Appendix 1.

HCO trend report

Since 2005, ACHS has also provided members with a HCO Trend Report of their CI data submitted over
the last eight years. The HCO Trend Report displays results in both a graphical and numerical format
allowing for easy examination of how your organisation is performing against others in the industry.
The trended data have more power to identify areas where an organisation’s rate differs from the
national rate, and hence areas of ongoing concern may be recognised. The HCO Trend Report can help
organisations to prioritise areas for improvement and is an important addition to the six-monthly
reports that members receive.

ACHS 2021 Clinical Indicator Program Information                                                     13
Published reports

The ACHS publication, the Australasian Clinical Indicator Report (ACIR), is published annually and
reports aggregated results on all CIs at a national level.
The publication identifies:
    •    The aggregate rates.
    •    The 20th and 80th centiles – the rates at which the top 20% of organisations are already
         performing and regarded as the goals to achieve depending on whether the desired rate is
         low or high.
    •    The national gains – defined as the number of patients / consumers whose quality of
         healthcare could potentially be improved if the mean was improved to that of the 20th or 80th
         centile.
    •    The trends in incidence since establishment of the national data set.
    •    Significant variation of rates of performance.
    •    The number of outlier HCOs and the number of patients affected by this and whose care could
         be improved if these HCOs altered their practices to those of the majority.
    •    Rate differences between various strata - public and private, metropolitan, non-metropolitan
         and states.

Custom benchmarking reports

The POS team is also able to provide corporate groups with custom benchmarking reports which allow
comparison of CI rates within a specific group of HCOs, for example, an Area Health Service or a private
hospital group. These reports are typically supplied in excel format allowing members to do further
analysis if required.

Reports to the relevant College, Association or Society

To assist in the development and review of CIs, reports are developed for the CI Working Parties. The
reports describe any statistically significant differences between strata such as, public / private sector
HCOs, non-metropolitan / metropolitan and states. Each College / Society / Association is also invited
to comment on the results and remark on any variations in practice. College comments are published
each year in the Australasian Clinical Indicator Report.

Interpreting the Clinical Indicator reports

HCOs need to review the results of the comparative reports to see if there is any statistical difference
between their rate and the Australian / New Zealand general or peer comparison rate. When
differences are identified HCOs need to question why there is a difference. The ACHS CIs are not case
or risk adjusted however the peer group stratifications are regularly reviewed to ensure similar HCOs
are being compared. By reviewing results with risk management in mind, HCOs can prioritise areas for
quality improvement.

The Observed minus expected (O-E) calculation (“the excess”)

The O-E (excess events) identifies the difference that could be made if an organisation was able to
move their rate to the aggregate rate. If the excess is large, then further investigation into the possible
causes may be required.

ACHS 2021 Clinical Indicator Program Information                                                       14
HCOs can prioritise those results that require attention by reviewing indicators which have a: • large excess and the 99% confidence interval does not include the aggregated rate (high priority); • large excess but the 99% confidence interval includes the aggregated rate; • small excess and the 99% confidence interval does not include the aggregated rate; • small excess but the 99% confidence interval includes the aggregated rate (low priority). It is important to remember that variations in the data collected can be found in almost every CI. There will almost always be a range of performance identified. There are many reasons for these variations. It is not always possible to identify the reasons for the variation. If variation is found however, it is essential that healthcare providers thoroughly examine the cause and implement action for improvement if required. CIs flagged as significantly different should be investigated at the organisational level to determine the reason for this difference. To investigate results and implement change an organisation should follow a quality improvement process such as the Plan, Do, Check, Act cycle or Clinical Practice Improvement Method. Further information on these quality improvement processes can be found in The Risk Management and Quality Improvement Handbook available on the ACHS website www.achs.org.au In combination with other quality improvement strategies, CIs can allow for successful probing of potential and actual problems. Other data sources that can be used in combination with the CIs may include: • adverse events and/or complication data; • incident reports; • consumer complaint data; • staff / patient satisfaction data. ACHS 2021 Clinical Indicator Program Information 15
WHAT AREAS DO THE CURRENT CLINICAL INDICATOR SETS COVER?

Currently the ACHS has 20 Clinical Indicator sets. Below is a listing of the current indicator sets and
the areas which they cover.

Anaesthesia & Perioperative Care version 6              Cancer Care version 1
Pre-anaesthesia period                                  Access
Intraoperative period                                   Assessment
                                                        Treatment
Patient recovery period
                                                        Outcomes
Postoperative period
                                                        Follow-up
Management of acute pain                                Support Services
Obstetric anaesthesia care

Day Patient version 6                                   Emergency Medicine version 6
Preadmission preparation                                Waiting time
Procedure non-attendance                                ST-segment elevated myocardial infarction
                                                        (STEMI) management
Procedure cancellation
                                                        Emergency department mental health
Episode of care adverse events
                                                        presentations
Unplanned return to the operating room
                                                        Critical care
Unplanned transfer / admission
                                                        Sepsis management
Discharge
                                                        Discharge communication
Departure
                                                        Pain management
Post-discharge follow-up
                                                        Unplanned re-attendance

Gastrointestinal Endoscopy version 3                    Gynaecology version 7
Failure to reach caecum / neo-terminal ileum            Blood transfusion
Colonoscopy adverse outcomes                            Injury to a major viscus
Adenoma detection                                       Laparoscopic management of an ectopic
                                                        pregnancy
Oesophageal perforation after dilatation
                                                        Thromboprophylaxis for major gynaecological
Aspiration following GI endoscopy
                                                        surgery
Sedation in GI endoscopy
                                                        Mesh repair
                                                        Menorrhagia
Hospital in the Home version 5
Patient safety, selection, communication and care
co-ordination
Service interruption
Unexpected deaths

ACHS 2021 Clinical Indicator Program Information                                                      16
Hospital-Wide version 12.1 Infection Control version 5
Hospital readmissions Infection surveillance
Return to operating room Surgical antibiotic prophylaxis (SAP)
Pressure injuries Haemodialysis access-associated bloodstream
infection surveillance
Inpatient falls
Vancomycin resistant enterococci
Patient deaths
Staff immunisation
Blood transfusion
Occupational exposures to blood and / or body
Thromboprophylaxis
fluids
Minimum standards for rapid response system (RRS)
calls
Surgery
Mental Health version 7
Intensive Care version 5 Diagnosis and care planning
Access and exit block Physical examination of patients
Intensive care patient management Prescribing patterns
Intensive care patient treatment Electroconvulsive therapy
Central line-associated bloodstream infection Use of seclusion and restraint
Utilisation of patient assessment systems Major critical incidents
Empathetic practice Length of stay
Mental Health Act status
Continuity of care
Community care
Maternity version 8
Outcome of selected primipara Oral Health version 4
Vaginal birth after caesarean section (VBAC) Returns to the dental centre
Major perineal tears & surgical repair of the Endodontic treatment
perineum Children’s dental care
General anaesthesia for caesarean section Radiographs
Antibiotic prophylaxis and caesarean section
Exclusive breastfeeding
Postpartum haemorrhage and blood transfusions
Foetal growth restriction (FGR)
Apgar score
All admission of term neonate to a neonatal
intensive care nursery (NICN) or special care nursery
(SCN)
Specific maternal peripartum adverse events
ACHS 2021 Clinical Indicator Program Information 17Paediatrics version 5.1 Pathology version 4.1
Appropriateness Chemical pathology
Adverse events Haematology
Documentation Anatomical pathology
Paediatric anaesthesia Microbiology
Whole of service
Radiation Oncology version 5 Radiology version 6
Consultation process Adverse patient events
Treatment planning CT dosimetry
Treatment delivery Patient identification and consent
Critical test result notification
Rehabilitation Medicine version 6
Timely assessment of function on admission
Assessment of function prior to episode end
Timely establishment of an initial multidisciplinary
rehabilitation plan
Multidisciplinary discharge documentation
Functional gain achieved by rehabilitation program
Discharge destination
ACHS 2021 Clinical Indicator Program Information 18APPENDIX 1: SAMPLE COMPARATIVE REPORT
ACHS Clinical Indicator Program
USER GUIDE –
Interpreting the ACHS Comparative Reports
INTRODUCTION
The ACHS Performance and Outcomes Service (POS) team provides the ability for members to produce
comparative reports from a secure, online reporting tool - The Performance Indicator Reporting Tool
(PIRT). The reports contain an organisation’s rate, its 99% confidence interval, the expected number
of events and the number of excess events. These measures are presented to assist HCOs assess to
what extent their rate varies compared to other organisations submitting data. It will provide evidence
for HCOs to either determine areas for improvement or reinforce the existing level of performance.
HCOs can produce two reports for each set of Clinical Indicators (CIs) submitted: a General Comparison
Report and a Peer Group Comparison Report. The General Comparison Report compares all
organisations that have submitted data for a particular set of CIs whereas a Peer Group Comparison
Report compares an organisation with similar (peer group) organisations. Similar organisations are
determined on the information that is provided to the ACHS in the PIRT program. For example, the
Intensive Care CI set requires selection of one of the following classifications:
• Adult ICU - Level III
• Adult ICU - Level II
• Adult ICU - Level I
• Paediatric ICU
A sample ‘Peer Comparison – Day Patient Clinical Indicators Version 6’ report accompanies this guide
to enable you to interpret the reports.
Export Data to Excel
PIRT Online also allows members to export their data in an excel format to facilitate further analysis if
required.
Should you require further assistance in interpreting the reports, or in how to use the data results for
quality improvement activities please contact the POS team on 02 9281 9955 or e-mail
pos@achs.org.au
ACHS 2021 Clinical Indicator Program Information 19How to read the six-monthly Comparative Reports
# Field Explanation
This is the Clinical Indicator (CI) set that has been submitted. The
1 Day Patient version 6
same information will be found in the General Comparison report.
This is a unique identifier code that the ACHS designates to
ACHS Organisation
2 organisations for confidentiality reasons. The organisation code
Code
is a 5 or 6 digit number.
First / Second half
3 This identifies the reporting period.
2019
This identifies the type of organisations submitting data for a
4 Category
particular CI set.
Total number of
organisations
This identifies the total number of organisations submitting data
5 submitting data for
for a particular CI set and reporting period.
First / Second half
2019
The CI number obtained from the relevant version of the ACHS CI
6 CI No. User Manual. This identifies which CI has been selected for
submission.
A summary description of the CI that an organisation has
7 Description
reported.
The number of events / cases with a given outcome or process
8 Your Numerator
reported by the organisation.
The total number of cases at risk of the outcome or process
9 Your Denominator
within the organisation or the total population of interest.
The rate is calculated by dividing the numerator by the
denominator and multiplying this by 100 to create a percentage.
10 Your Rate
Example: Sample Report CI 3.1
1 / 2125 x 100 = 0.047%
The confidence interval provides an interval estimate of your
rate and indicates the uncertainty in the rate caused by random
variation. Confidence intervals have an upper and lower limit,
which provide the plausible values for the rate.
99% Confidence
11
Interval for Your Rate Example: Sample Report CI 3.1
The lower limit is 0.00 and the upper limit is 0.168. The interval
0.00 – 0.168 has a 99% chance of containing the true rate for
your organisation.
ACHS 2021 Clinical Indicator Program Information 20The range of the limits will vary according to the size of the
sample, that is, the number of events / cases identified. A larger
sample will have a smaller confidence interval than a rate for
smaller samples.
When reading the comparative reports, look at the aggregate
rate for all organisations and see whether it falls inside or
outside the 99% confidence interval limit.
If the aggregate rate falls outside the 99% confidence interval
limit, the organisation is said to be statistically significantly
different to all other organisations submitting data for that
particular CI.
If the aggregate rate falls within the 99% confidence interval
limit, an organisation can interpret this as indicating that their
rate is not statistically significantly different to the overall rate,
but note that this does not imply that their rate is the same as
the overall rate.
The difference between rates may identify areas for
improvement or validate a level of service that is achieving a rate
that is statistically more desirable than the average rate.
The expected number of events is calculated by assuming that
the average rate of all other organisations who have submitted
data was your rate.
Your expected number The expected number of events is calculated by multiplying the
12 denominator by the aggregate rate for all organisations and then
of events
dividing this by 100.
Example: Sample Report CI 3.1
2125 x 0.327 / 100 = 7 expected number of events
Number of The total number of organisations submitting data for a
13 organisations particular CI. In the Peer Comparison report this is subdivided
submitting data into public and private sector organisations.
Aggregate rate for all The aggregate rate for all organisations is the average rate of all
15
organisations organisations submitting data for a particular CI.
Flag indicates where an organisation is statistically significantly
'different' to all other organisations submitting data for that
particular indicator and where the result is undesirably lower or
higher than the expected rate.
16 Outlier
Star indicates the organisation is statistically significantly
'different' to all other organisations submitting data for that
particular indicator and where the result is desirably lower or
higher than the expected rate.
ACHS 2021 Clinical Indicator Program Information 21When looking at an organisation’s rate, in comparison to the
aggregate rate for all organisations, it is important to consider
the excess events and the 99% confidence interval in order to
obtain a complete picture of an organisation’s performance. The
results can be used to prioritise which areas should be reviewed
as follows:
11,
• The excess events are large and the 99% confidence interval
13
does not include the aggregate rate (high priority)
&
15 • The excess events are large but the 99% confidence interval
includes the aggregate rate
• The excess events are small and the 99% confidence interval
does not include the aggregate rate
• The excess events are small and the 99% confidence interval
includes the aggregate rate (low priority)
The Confidence interval, your rate and aggregate rate are
16 Graph
presented for the indicator in a graph.
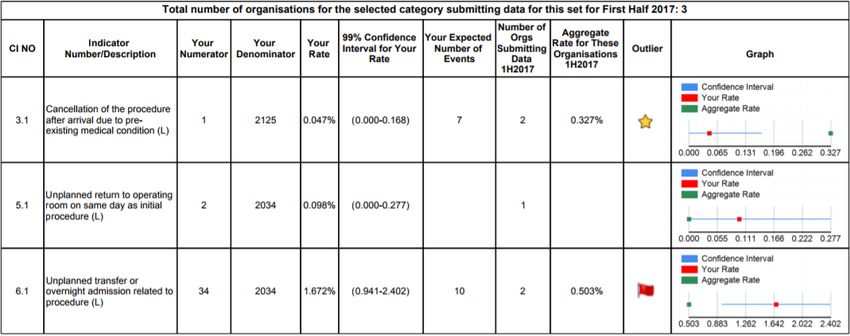
ACHS 2021 Clinical Indicator Program Information 22Sample Report
(1) Day Patient version 6
(2) ACHS organisation code: 123456 (3) First Half 2019 Australasia (4) Public Facility
(5)
(6) (7) (8) (9) (10) (11) (12) (14) (15) (16)
(13)
(L) – a low rate is desirable, (H) – a high rate is desirable, (N) – desirable rate is unspecified
% - per 100, * - per 1,000, ^ - per 10,000, X- - mean, M - median
ACHS 2021 Clinical Indicator Program Information 23The Australian Council on Healthcare Standards
You can also read