Sentiment Analysis of Twitter Texts Using Machine Learning Algorithms
←
→
Page content transcription
If your browser does not render page correctly, please read the page content below
Academic Platform Journal of Engineering and Science 9-3, 460-471, 2021

 Academic Platform Journal of Engineering and Science

 journal homepage: https://dergipark.org.tr/tr/pub/apjes

 Sentiment Analysis of Twitter Texts Using Machine Learning Algorithms
 *1Hawar Sameen Ali Barzenji
1
 Department of Computer Engineering, Faculty of Computer and Information Sciences, Sakarya University, Sakarya, Turkey,
 hawar.al-barzenji@ogr.sakarya.edu.tr,

 Research Paper Arrival Date: 19.05.2021 Accepted Date: 19.07.2021

Abstract

Since the two last decades social media networks have become a part of our daily life. Today, getting information from social
media, tracking trends in social media, learning the feelings and emotions of people on social media is very essential. In this
study, sentiment analysis was performed on Twitter text to learn about the subjective polarities of the writings. The polarities are
positive, negative, and neutral. At the first stage of the sentiment analysis a public data set has been obtained. Secondly, natural
language processing techniques have been applied to make the data ready for machine learning training procedures. Lastly
sentiment analysis is performed by using three different machine learning algorithms. We reached 89% accuracy with Support
Vector Machines, 88% accuracy with Random Forest, and 72% accuracy with Gaussian Naive Bayes classifier.

Keywords: Natural Language Processing, Machine Learning, Random Forest, Support Vector Machines, Gaussian Naive Bayes,
Sentiment Analysis

1. INTRODUCTION studies, like evaluating his tweets [6] [7], applying sentiment
 analysis, etc.
With the rise of the modern era, our life faced a new way of
communicating, a new way of social interaction [1]; which In this study, sentiment analysis is performed on Twitter text.
is the social media platforms. Willy-nilly if we accept it or The tweets which are used in this research are Trump’s
not, SM became a phenomenon in our daily life; it became tweets published freely online [8]. Obtained tweets were
an essential part of our recent lifestyle. firstly prepared for ML algorithms by using natural language
 processing techniques (NLP). Then three ML classifiers
Nowadays, people use social media not only for sharing their were trained using the data. The ML techniques are Random
emotional, desire, and ideas about a particular subject [2]; Forest, Support Vector Machines (SVM), and Gaussian
but also, they use it for marketing [3], political messages, and Naive Bayes (GNB).
etc. A huge attention for the latter mentioned category is
Twitter’s platform. It is clear that most of the politicians 1.1. NLP
around the world are using Twitter as their no. one’s favorite
platforms, but we should not forget that this platform has its NLP is a subfield of Computer science and AI (particularly
own positive and negative effects on the decision of the the field of machine learning). It deals with the language of
people, and what is familiar among the people about all of the human being and how it understood by the computer.
the social media platforms is that most of the time, its This technique can be obtained with the help of the
negative side is more than its positive side. computational linguistics. To understand the natural
 language needs a lot of information about lexicon, semantics,
For the all above important reasons of social media, it’s the syntax, and information about our real world [29, 30, 31].
right time to put our focus on this new phenomenon, from
philosophy to machine learning (ML), NLP and other We can talk about NLP as a synthesis of philosophy of
evaluating techniques in data analysis, can be used to analyze linguistics, computer science, and artificial intelligence. This
the activities on this platform. branch of science deals with the interactions between human
 language and computers (Robot agent). This field cares
The Twitter’s account of President Donald Trump has about about how to code and program computers, in order to
88 million followers [4] of Twitter users, and many of them process and analyze the data of natural language.
are using his account as a way of news and information
resource [5]. His frequent use of the social media account
and his influence as President of the US, has made his tweets
an essential source in a variety of scientific and research

*1 Corresponding author: Sakarya University, Sakarya, Turkey, hawar.barznji@gmail.com, +90 552 353 2395

Doi: 10.21541/apjes.939338
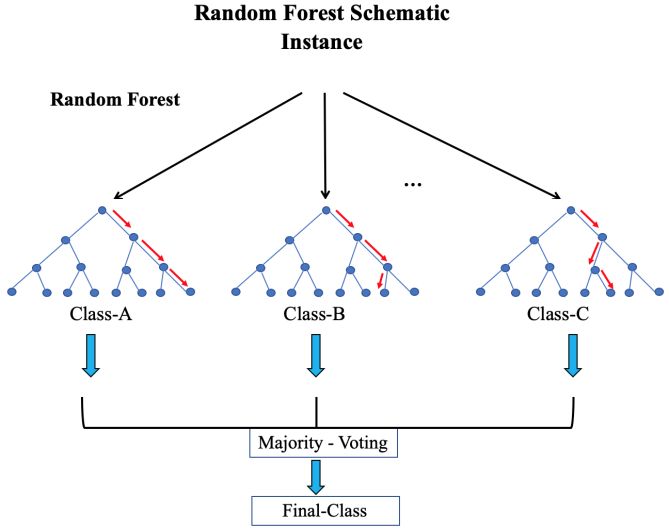
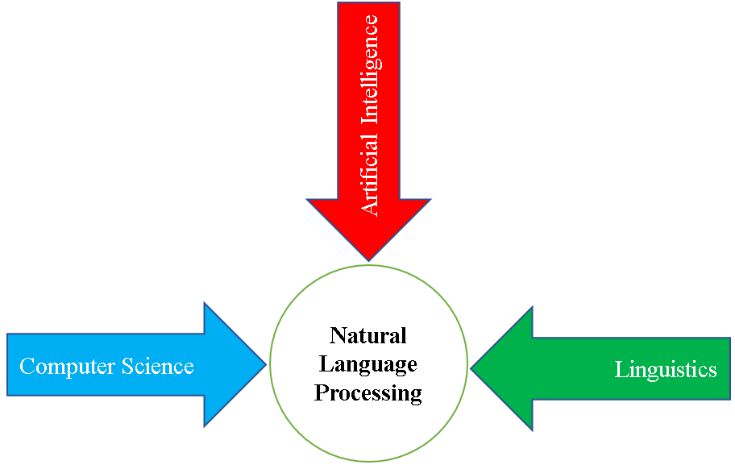
H BARZENJI Academic Platform Journal of Engineering and Science 9-3, 460-471, 2021

 Figure 1. The synthesis of NLP

1.2 ML classifeirs
 Figure 3. Random Forest schematic
Machine learning is about taking out knowledge from raw
data, and learning from past experience in order to predict
the next upcoming data. This research field is an intersection 1.2.2. Gaussian Naïve Bayes
of AI, statistics, and computer science. The usage of machine
learning methods in recent years is very useful in nowadays Naive Bayes is a kind of probabilistic or statistical
life. Starting from automatic suggestions of which videos to supervised ML algorithm. It builds a probability model on
be watched, or what type of fast-food to order or which items the category description for all feature vectors in the training
to buy, and for customizing the podcasts; most of the modern set. It works based on Bayes theorem [11], which calculates
portals and devices have machine learning algorithms at their conditional probability. Gaussian distribution, is one of the
kernel; and ML can do all of these based on learning from most usual and main technique in calculating statistics and
experiences, the more training the classier, the more accurate probability field, stating the “naive” supposition of
the prediction is. conditional independence between every pair of attributes
 given the value of the class variable [12].

 Figure 2. The diagram of ML approach

1.2.1 Random Forest

Originally Random Forest derives from Decision Tree, this
means, it shares all the benefits of decision trees, but
historically it refers back to an American computer scientist
at IBM Watson Health (Tin Kam Ho) in 1995 with the term
of (random decision forests) [9]. After a while (Leo
Breiman) coined the Random Forest term in 2001 [10].

 Figure 4. The Gaussian distribution

 461
H BARZENJI Academic Platform Journal of Engineering and Science 9-3, 460-471, 2021

1.2.3. Support Vector Machine operating system for information purpose; the results have
 been showed in tables and related figures.
Support Vector Machine (SVM) or originally Support
Vector Networks (SVN), is a type of supervised ML The suggested research paper can have a good impact in
algorithm that was coined by both C. Cortes and V. Vapnik many scientific areas and can have a good contribution to
in 1995 [13]. It can be used in both classification and science. The proposed system can be used in pre- and post-
regression tasks. This prediction tool uses ML theory to scraping processes. It can be used during web page scraping
maximize required accuracy and automatically avoids before the crawled data is going to be saved in the form of
overfitting of the data. This supervised learning ML uses in csv file; or after saving the crawled page.
two group classification problems. It can solve linear and
non-linear. This algorithm is efficient when dealing with Also, it can be used in various fields; It can be used in Digital
high dimensional data such textual data. The idea of SVM is Image Processing (DIP) and Pattern Recognition (PR); since
simple, its objective is to find a hyperplane that has the there are images that contain textual data, it can be extracted
largest edge (side), i.e. the decision boundary that separates by one of the mentioned proceedings, and the proposed
the support vectors to the farthest. system can be applied on it, of course, the more gathered
 data, the more accurate it will.
 Table 1. The number of input features with the required
 number of hyperplanes Also, it can be used in AI and robotics; the agents can use the
 Input features Output hyperplane suggested method in converting speech-to-texts, which is
 famous as Speech Recognition (SR) for cleaning the noisy
 2-features 1-line hyperplane speech in order to understand and perform the required given
 orders, with the help of time, the agent can get more
 3-features 2-dimentional plane experience and gradually becomes smarter.

 Since philosophy is one of the closest fields to AI and NLP,
In SVM, we are trying to find those points which are the it can be used in social sciences, like the philosophy of
 linguistics, we shall not forget that philosophy as the mother
closest to the line from both the classes, the points are called of all sciences, raised the first and most early questions about
support vectors. Then, the distance between the line and the language and a thinker machine.

support vectors will be calculated, this distance is called the Also, the mathematical results in confusion matrix,
margin [32]. The goal of SVM is to maximize the margin, as classification report table can be used in the field of data
 analysis and statistical purposes.
it shown in below figure.
 The framework of this research paper will be as follows: In
 section 1; a general introduction about the whole study (i.e.
 the problem definitions) is given, like NLP, all three types of
 ML classifiers; also, other related topics like scopes, and the
 suggested solutions have been given too. In section 2; the
 closest studies in the same area (i.e. related work) have been
 given. In section 3; which is the material and methods; a full
 detailed explanation about and text cleaning procedure (i.e.
 pre-processing) with all of its included steps have been
 given. In section 4; is the results in confusion matrices,
 classification report, and the conclusion with our
 recommendations for the future upcoming studies.

 2. RELATED WORK

 Nowadays Twitter sentiment analysis gained most of the
 researcher's attention [16]. These concise texts are used as a
 raw material for data analysis. By using text polarities
 (positive, neutral, and negative), emotions (angry, sad, loved,
 Figure 5. Optimal Margin
 etc.) are judging on each text’s subjectivities.
Finally, since every approach is measured by its outcomes,
 Before going deeper into our own study. We will give a brief
Random Forest classifier has been applied to get the
 overview about the previous articles (i.e. Literature Review)
following targets; Accuracy, Precision, F1 Score, and Recall
 that have been done in the same area which is the
metrics [14] [15]. Also, the data size of cleaned text with its
 combination of NLP and ML.
original source have been compared and tested in macOS

 462
H BARZENJI Academic Platform Journal of Engineering and Science 9-3, 460-471, 2021

In [17] they proposed a study for detecting fake news spread In [23] In this paper, they analyzed the relationship between
through images from SM like Facebook, Twitter, etc. They the tweets written by POTUS (stands for the President of the
proposed K-means clustering (based on issuing day) to get a United States) and his approval rating using sentiment
general outline of how the images were used throughout the analytics and data visualization tools. They applied all the
time. NLP requirements on the tweets of POTUS; they mined,
 cleaned, and gave a quantitative measure based on the
In [18] they introduce a hybrid method which is a content, which they named the “sentiment score". By
combination of NLP and ML techniques to guess and comparing tweets before the election, during the election and
recognize hate speech from social network websites. After inauguration, and after the inauguration, they found that the
gathering the hate speech, steaming, tokenizing, unwanted “sentiment score” of Trump’s tweets feed has been increased
character removal was applied on it. Finally, they classified with an average in time by a factor of 60%. By using cross-
the texts into neutral, offensive, and hate (in our study, we correlation analysis, they find a preliminary causative
classified the tweets into positive, neutral, negative) relationship between POTUS Twitter activity and approval
language. The performance of the system is then evaluated rating. Still, their study is one-sided research, it seems
using overall accuracy, f1 score, and precision and recall something is missing. What we do with sentiment analysis
metrics. The system achieved an accuracy of 98.71%. and NLP techniques, somehow leaves the problem unsolved.
 By using ML methods, we can train our data in a way that
In [19] they applied NLP techniques to analyze tweets with can recognize the next upcoming data which gives to the
regard to mental health. They used Deep Learning (DL) system, so the robot can predict it.
models to classify each tweet regarding of the following
emotions: angry, anticipation, disgust, frighten, delight, In [24] this paper, they used social media content to forecast
sadness, surprise, and confidence. real-world result. In particular, they used the chatter from
 Twitter platform to predict box office incomes for movies.
In [20] a group of researchers made a comparison study of They revealed that the tweets which are generated about
the Naïve Bayes algorithm and NLP on the dataset of specific movies can perform better in market-based
Twitter. Their comparison is in two categories: accuracy and predictors. They applied sentiment analysis on the extracted
speed. Their experimental results showed that the Naïve Twitter data, but they didn’t mention which method they did
Bayes algorithm got 63.5% accuracy, which is lower than the forecasting.
that achieved by the NLP method. But in the processing
speed analysis, the ML method performance is 5.4 times From all above research studies and articles, we can notice
higher than that of the NLP method. that most of them have a combination method, which means
 a duality of NLP and ML algorithms. It seems that without
In [21] they used sentiment analysis to extract human feeling combining those two fields, the suggested work would be
and evaluate whether it’s negative, positive or neutral. incomplete. In our research, after applying NLP techniques
Through unconstructed text by using NLP. They also on the Twitter texts, Random Forest classifier, GNB, and
Machine learning in order to train and test the dataset. They SVM have been to train and test the cleaned texts.
compared the results using different ML classifier, like
Naïve Bayes, Random Forest, Support Vector Machine, and 3. MATERIALS AND METHODS
etc.
 In this section, which covers the most important part of our
In [22] USSAMA YAQUB applied sentiment analysis on study, talks about the most required methods and algorithms
trump’s tweets during the early appearance of the that need to be applied to our dataset in order to get the target
coronavirus pandemic (i.e. COVID-19) in the United States. results.
Statistically, he discovered a negative correlation between
the sentiments of his tweets and the no. of cases in the United As it already mentioned above, the aim of this study is to
States. One thing which is very important in his study apply sentiment analysis on Twitter’s textual data and
research is that he noticed a gradual shifting in his tweets performing text polarities on it. At the final step, the Random
from positive to negative sentiments polarities while he is Forest classifier, GNB, and SVM have been used to train and
mentioning China and COVID-19 together. What USSAMA test the data. The accuracy and time of the used classifier
did is amazing, but his study is not a hybrid method, which have been compared. The results showed the proposed
means he didn’t apply ML classifier after his sentiment method is working well. The details of the results will be
analysis, this makes his research stay in the domain of data given in a confusion matrix in the result section.
analysis and NLP techniques.

 463
H BARZENJI Academic Platform Journal of Engineering and Science 9-3, 460-471, 2021

 Figure 7. The first five records of our host dataset

 3.2. Data cleaning and selection

 Whenever there is a dataset, there should be data analysis
 too, for the reason that any dataset needs some special
 commands to manipulate them. Data analysis performs most
 of the actions that need to be done on any dataset, including
 importing the dataset, performing most of the actions on its
 columns and rows, appending and deleting the records, and
 etc. without data analysis, applying NLP and ML algorithms
 would be impossible. Deciding which features should be
 used and which one should be eliminated, will be occurred
 in this step in any studying research in the same area.

 As it clear, data visualization (like charts, infographics, etc.)
 is giving a good way to represent the important information
 based on the dataset, but what if your raw data is textual-
 Figure 6. A quick overview of the proposed study based document? The solution is using Wordcloud which is
 available in Python programing language. Wordcloud refers
The above diagram displays the most essential steps in the to a cloud filled with lots of words in different shapes and
proposed research. It starts with the collected tweets and sizes. The size of each of the word represents the frequency
applies the most required processes which are the data or the importance of each word; bigger size, means more
cleaning and selection level. In text cleaning which repeated word. From the below figure, you will see the
represents all the NLP techniques that have been used in Wordcloud of our dataset for the feature of “content”.
order to prepare the text for conversion. At text polarity level,
each cleaned tweet has been judged regarding their
subjectivity. At text to number level, BoW has been applied
for converting the categorical data (i.e. textual data) into
numerical data. Finally, in the ML level, Random Forest
classifier, GNB, and SVM have been used to train and test
the data for getting the required results.

3.1. Gathered dataset

In this study, an already prepared dataset has been used from
kaggle online community for data scientists and ML
practitioners, the dataset is Trump’s tweets. It can be found
and downloaded from the cited link [25]. Figure 8. Wordcloud for Trump’s tweet

 From the Wordcloud above, the words with bigger size
 represent the most repeated words in the tweet dataset.

 464
H BARZENJI Academic Platform Journal of Engineering and Science 9-3, 460-471, 2021
3.3. Text Cleaning In the Python programming language, there is a library for
text polarity, with the name of TextBlob (Also VADER can
The data (in our case Twitter texts) needs to be fully cleaned be used).
and prepared before applying any classifier algorithms. In
every text, there are many (mentions, hashtags, emoticons, From the experiment result, the total of (41122) records, the
unconventional punctuation, spaces, symbols), that do not distribution of sentiment polarities will be as follows:
have any value on classifying, have to remove (filter out).
One of the biggest advantages of this step is that it makes our 22274
Positive tweets: = 54.16%
41122
data smaller which saves our storage capacity. Decreasing
the size of the hosted dataset can have a good effect on the 7148
performance of the work and the data size can be used for Negative tweets: = 17.38%
41122
information purpose. (Details have been given in the result
11700
section). Neutral tweets: = 28.45%
41122
In the experimental part, the following text cleaning which If we put all the results in one table, we will get,
includes the following steps have been applied in the dataset:
first, stopwords have been removed, then word lemmatizing Table 2. Sentiment polarities of our dataset
has been applied in order to change the words into their roots,
Sentiment Percentages
finally, regular expressions have been applied for removing No. of occurrences
the links and emails, etc. polarities
Positive 22274 54.16%
3.4. Detecting text polarity
Negative 7148 17.38%
This part is one of the main goals of the study. What we do
from the beginning until the final step, is to prepare the text 28.45%
Neutral 11700
for subjective sentiment polarities (or in some resources,
sentiment score). Text polarity is a method to detect each 100%
Total 41122
tweet’s subjectivity. Since the tweets have been written by
human as a subject, and he is tweeting his own ideas about a
specific event or anything else, so the tweets are not As it can be seen from the result table above, the majority of
objective. It needs to be detected in order to be classified into the tweets are positive, and we got the least number of
three levels, which are positives, negatives, and neutrals. negative tweets, also about 12000 neutral tweets. The
graphical distribution of the tweets will be as follows,
In our experimental work, in each sentence has been judged
after being cleaned by NLP techniques. Each textual data (In
our case is Twitter tweet) is labeled with three possible
values: negative, positive or neutral. In this work, we first
determined the sentiment polarity of each tweet by adapting
the following measurement [26] [27],
−
( ) = (1)
+ +2
Where,
Positive represents total number of the positive words; and
negative counts the negative words in the tweet. We
represent it by a separate two valued with variable C, which
represents the sentiment class:
C ∈ {−1, 1}. Figure 9. Sentiment polarity distribution of the tweets
Where,
C can hold three values, since of having different thresholds, 3.5. Text Vectorization
1 ( ) ≥ 0.1 Since all of the ML classifiers are dealing with numbers only,
= { −1 ( ) < 0.1 } (2) the cleaned text has to be changes into a matrix of numbers,
and the field will be ready for the training and test process.
0 ( ) =0
Text vectorization is a technique of changing texts into
quantitative data.
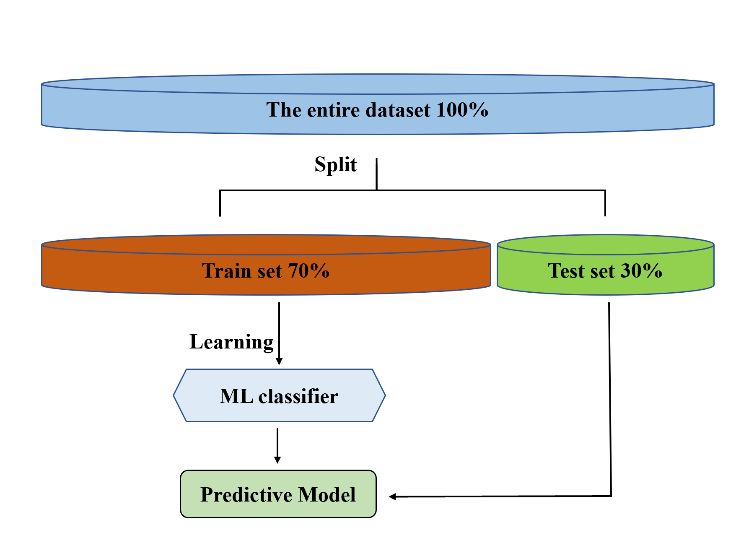
465H BARZENJI Academic Platform Journal of Engineering and Science 9-3, 460-471, 2021 There are some popular types of text vectorization, which 3.6. Splitting into train and test they all do the same task but in different ways. Some of them are: Every used machine learning algorithm needs to a technique which is a kind of division. In this process, the whole dataset 1. Bag of Words (BoW) will be divided into two parts: Training and Testing. It’s up to the researcher divides each part into how many 2. TF-IDF percentages. It can 80%, 20% for both training and testing 3. Word2Vec respectively. Also 70%, and 30%. This method is used to evaluating the performance of the used machine learning algorithm. As we said earlier, this process requires taking the 3.5.1. Bag of Words dataset and dividing it into two subsets: Simply, BoW is a method for representing text in the form Training set: Used to fit and train the machine learning of numbers. This model is used for simplifying model. representation which is used in NLP and information Testing set: Used to evaluate the fit machine learning model. retrieval (IR). In this method, a list of all the text will be considered as a bag of its words, with ignoring the grammar This technique is an important step in any supervised and even the order of the words, but protecting variety. learnings. While the agent does not have any default information about the environment, this procedure gives that Simply, BoW is a link between NLP and the ML classifier. ability to the agent to learn from the experiences by training It connects NLP techniques to ML. more than half of the data. In most of the cases, 70% of the dataset is given to the agent in order to learn from the training; and the remaining part which is 30% is put for the test to see the accuracy of the used classifier, in order to check whether it works good or not. In case if the suggested Figure 10. BoW as a link between NLP and ML ML algorithm is not doing well, another classifier has to be applied on the hosted data. The figure below will explain the In order to clarify BoW concept, in the example below, let’s procedure of splitting in ML. take three sentences: For example, in our case, the total records of the dataset equal 41122 records. The mathematical calculating of the Sentence 1: “The wolf sat” splitting method (30% and 70%) for the three proposed classifiers will be as follows: Sentence 2: “The wolf sat on the hill” 70 Sentence 3: “The wolf with the hill” Training set: 70% × 41122 = × 41122 = 0.7 × 41122 = 100 28785 records We will construct a vector form, from all the unique words 30 in the above three sentences. This vector contains six words Testing set: 30% × 41122 = × 41122 = 0.3 × 41122 = 100 which are: ‘The’, wolf’, sat, ‘on’, ‘hill’, ‘with’. Finally, we 12337 records will make a table for the results, Table 3. The BoW table the wolf sat on hill with Sentence 1 1 1 1 0 0 0 Sentence 2 2 1 1 1 1 0 Sentence 3 2 1 0 0 1 1 So, the numerical ouotputs for each sentence will be a vector as follows: Vector 1: [1, 1, 1, 0, 0, 0] Vector 2: [2, 1, 1, 1, 1, 0] Figure 11. The procedure of splitting dataset in ML Vector 3: [2, 1, 0, 0, 1, 1] 466
H BARZENJI Academic Platform Journal of Engineering and Science 9-3, 460-471, 2021

4. RESULT AND DISCUSSION The rule of F1 score is,

This section has been divided into two part. In the first part, ×
 1 = 2 × (6)
a formula of each rule has been given, and examples in order +

to clarify each used formula. In the second part, the
 In order to understand the above rules, we will take an
experimental results have been discussed and the output of
the confusion matrix have been evaluated; in additional, with example.
checking the size of the dataset before and after cleaning.
 Consider a classification system that has been trained to
We used macOS operating system; with the following
 classify (or recognize) the pictures of three types of animals:
technical specifications (which is shown in the below table)
 phoenix, owl, and wolf. The system gave the results in a
for training and testing each classifier:
 confusion matrix. Assume that the number of animals are
 given to the system which are 30 animals; there where 10
 Table 4. The technical specifications of the used host
 phoenixes, 8 owls, 12 wolves.
 computer
 Computer Type of Processor Amount
 Table 5. Confusion matrix for three samples of animals
 manufacture OS of RAM
 Predicted class Total no.
 MacBook Pro macOS Intel Core 8GB phoenix owl wolf of each
 Big Sur i5, ~2.6 phoenix 6 3 1 10
 2020 GHz Actual
 owl 1 5 2 8
 class
4.1. The evaluation metrics wolf 0 1 11 12

This metrics measurements concludes the following results:
 In this confusion matrix 3 by 3 table, out of 10 actual
1. Accuracy, phoenixes, the system predicted that 3 were owls, and 1 was
2. Precision, a wolf; and of the 8 owls, it predicted 1 was a phoenix, and
3. Recall metrics, 2 were wolves; and out of 12 wolves, predicted 1 was owls.
4. F1 score. The green colors are the true actual values for each class.
5. Required time for training and testing
6. Data size Considering the confusion matrix above, the corresponding
 table of confusion which is (Table 5), for the phoenix, owl,
Accuracy is calculated as the total number of correct and wolf classes, would be as follows:
predictions, over the total number of the dataset (i.e. all
correct / all). The rule of accuracy is, Table 6. Confusion matrix for phoenix class
 6 true positive (actual 1 false positive (owls that
 +
 = (3)
 + + + phoenixes that were correctly were incorrectly labeled

The rule of precision is, classified as phoenixes) as phoenixes)
 3, 1 false negative 19 true negative (all the
 ( )
 = (4)
 ( )+ ( ) (phoenixes that were remaining animals,

The rule of recall is, incorrectly marked as owls, correctly classified as
 and wolf respectively) non-phoenixes)
 ( )
 = (5)
 ( )+ ( )
 Table 7. Confusion matrix for owl class
Recall works on the horizontal lines (i.e. the rows) of our
table. 5 true positive (actual owls 3, 1 false positive
 that were correctly (phoenixes and wolf that
The solution for the misleading performance of accuracy on
imbalanced data, is F1 score. We use F1 score when our data classified as an owl) were incorrectly labeled as
is imbalanced. F1 score is the average of precision and recall. owl respectively)

 467
H BARZENJI Academic Platform Journal of Engineering and Science 9-3, 460-471, 2021

 1, 2 false negative (owls 18 true negative (all the 5 5
 = =
 that were incorrectly remaining animals, (5 + 2 + 1) 8

 marked as phoenix and correctly classified as non- = 0.62 × 100% = 62%

 wolf respectively) owls)
 11 11
 = =
 Table 8. Confusion matrix for wolf class (11 + 1 + 0) 12

 11 true positive (actual 1, 2 false positive (phoenix = 0.91 × 100% = 91%
 wolves that were and owls that were
 correctly classified as incorrectly labeled as (0.60 + 0.62 + 0.91) 2.13
 = =
 3 3
 wolves) wolves)
 = 0.71 × 100% = 71%
 1 false negative (wolf 15 true negative (all the
 that was incorrectly remaining animals, correctly
 (0.72 × 0.71) 0.5112
 marked as owls) classified as non-phoenixes) 1 = 2 × =2 ×
 (0.72 + 0.71) 1.43
 = 2 × 0.357 = 0.71 × 100% = 71%
The results of (Table 5) will be as follows,

 (5 + 6 + 11) 22 4.2. Evaluating the experimental results
 = =
 30 30
 From the three tables below, all the results from the
 = 0.73 × 100% = 73%
 classification report for the three algorithms will be as below,

 Table 9. Classification report for Gaussian Naïve Bayes
 6 6
 ℎ = = classifier
 (6 + 1 + 0) 7
 Types of Precision Recall F1-score
 = 0.85 × 100% = 85% polarity

 Positive 0.95 0.60 0.74
 5 5
 = =
 (5 + 3 + 1) 9
 Negative 0.54 0.73 0.62
 = 0.55 × 100% = 55%

 Neutral 0.65 0.96 0.78
 11 11
 = =
 (11 + 2 + 1) 14 Accuracy 72%
 = 0.78 × 100% = 78%

 Table 10. Classification report for SVM classifier
 (0.85 + 0.55 + 0.78)
 = Types of Precision Recall F1-score
 3 polarity
 2.18
 = = 0.72 × 100% = 72% Positive 0.96 0.91 0.93
 3

 6 6 Negative 0.90 0.73 0.80
 ℎ = =
 (6 + 3 + 1) 10
 Neutral 0.81 0.98 0.88
 = 0.6 × 100% = 60%

 Accuracy 89%

 468
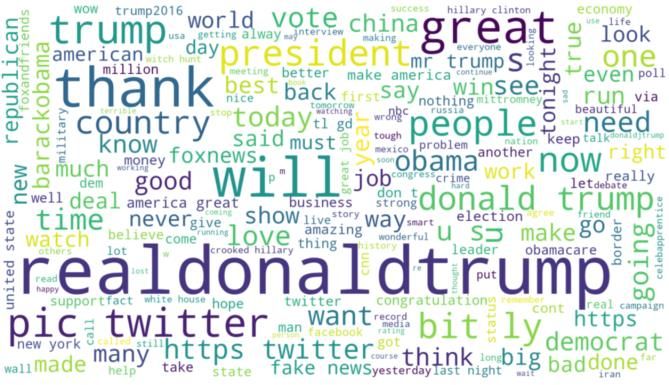
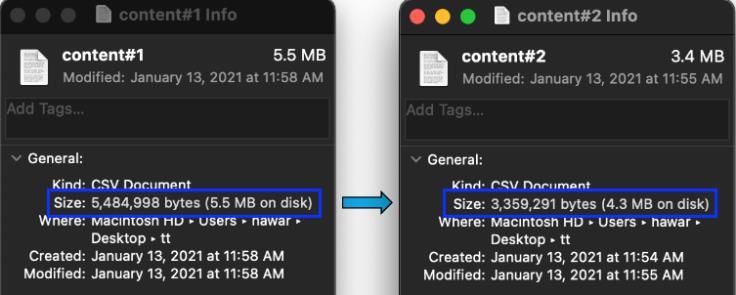
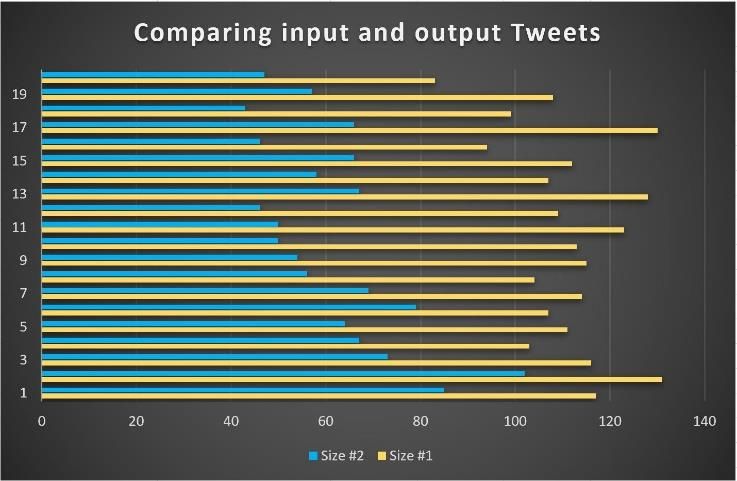
H BARZENJI Academic Platform Journal of Engineering and Science 9-3, 460-471, 2021

Table 11. Classification report for Random Forest classifier The accuracy result shows 88%, 73%, and 89% respectively.
 From the comparison, it seems that the Ransom forest
 Types of Precision Recall F1-score
 classier works better than GNB. So, the author is suggesting
 polarity
 Random Forest over GNB, but in the case of Random Forest
 Positive 0.93 0.91 0.92 with SVM, we can notice one-degree difference in their
 accuracies, but SVM has the problem of time requiring. The
 table above which contains the required time for each
 Negative 0.88 0.67 0.76 classifier, in the used macOS system (the hardware
 specification is given in Table 2). The results show that GNB
 needs the least amount of time, while SVM needs the most
 Neutral 0.81 0.95 0.87 amount of time, with is a huge difference from the two other
 classifiers.
 Accuracy 88%
 Another way for testing the proposed system is to check the
 data size of the dataset before and after cleaning processes
 for information purpose. Reducing the size of the data,
From the results above, it can be noticed that the applied means the used cleaning method has worked well on the
algorithms work on both positive and neutral polarities better dataset; also, it causes and essential impact on the
than negative tweets, this due to the total no. of negative performance of the work, the less and more cleaned data,
tweets which lesser that other polarities. As it’s given in means the faster system is.
(Table 1) the total no. of the whole records are 41122 tweets;
from this number, 33974 tweets (which is about 83% of the Thus, cleaning-out the noisy, or wrong samples in the
dataset) are both positive and neutral, only 7148 tweets are original training dataset; is a very important step for the
negative; which is equal to, training dataset methods in enhancing the classification
 accuracy [28].
 7148
 × 100% = 0.1738 × 100% = 17.38%
 41122 The figure below, shows the text before and after cleaning,
 in the macOS system, the differences can be noticed between
17% of the whole dataset; that’s why we notice from the CM both CSV files,
table, the proposed algorithms are not working well on
negative polarities. Since the agent does not have any
previous knowledge about the dataset, it has to be trained a
lot, the more data for training, the more accuracy results will
get.

In some cases, we may face imbalanced data, which means
the data in the host dataset are not coherent. Due to this
reason, measuring the accuracy alone is not enough. It has to
be compared with the result of F1-score. If their results are
near to each other, it means it performs well. In the case of Figure 12. Both saved “content” with “cleaned content”
Random Forest, for positive and neutral tweets, the results of features in macOS hard drive
F1 score are 92% and 87% respectively; with regarding to
overall accuracy result which is 88% it means they are near One of the benefits of cleaning textual data is reducing
in each other. capacity. We succeeded to decrease the size of our dataset
 Also, in order to test the performance of the suggested about 1.2 MB (from 5.5 MB to 4.3 MB).
classifier, the overall accuracy of Random Forest classifier
with GNB and SVM have been compared as it shows in the This decreasing of size leads to apply the ML algorithms
table below, faster. For example, in the case of Random Forest, the
 training and testing technique on the macOS took 7min 5s,
Table 12. The accuracy comparison between the classifiers and 2.12 s respectively.
 with their required time
 ML Classifier Accuracy Required time
 Training Prediction
 Random Forest 88% 7min 5s 2.12 s
 GNB 72% 1.64 s 367 ms
 SVM 89% 15min 37s 1min 42s

 469
H BARZENJI Academic Platform Journal of Engineering and Science 9-3, 460-471, 2021

 REFERENCES

 [1] Duncombe, Constance. "The politics of Twitter:
 emotions and the power of social media." International
 Political Sociology 13.4 (2019): 409-429.
 [2] Akram, Waseem, and Rekesh Kumar. "A study on
 positive and negative effects of social media on society."
 International Journal of Computer Sciences and Engineering
 5.10 (2017): 347-354.
 [3] Ajjoub, Carl, Thomas Walker, and Yunfei Zhao.
 "Social media posts and stock returns: The Trump factor."
 International Journal of Managerial Finance (2020).
 [4] Social Blade Organization, “Twitter Stats
 Figure 13. Comparing the sizes of In/Out texts
 Summary,” User Statistics for RealDonalTrump.
This decreasing of size leads to apply the ML algorithms https://socialblade.com/twitter/user/realdonaldtrump
faster. For example, in the case of Random Forest, the (accessed Dec. 7, 2020).
training and testing technique on the macOS took about [5] Wells, Chris, et al. "Trump, Twitter, and news
7min. This is useful in those situations that have a dataset media responsiveness: A media systems approach." New
with a huge amount of information and a small with a Media & Society 22.4 (2020): 659-682.
determined amount of capacity.
 [6] Clarke, Isobelle, and Jack Grieve. "Stylistic
CONCLUSION variation on the Donald Trump Twitter account: A linguistic
 analysis of tweets posted between 2009 and 2018." PloS one
In the proposed research paper, sentiment analysis as the use 14.9 (2019): e0222062.
of use NLP and ML classifiers have been applied on Trump’s [7] Yaqub, Ussama, et al. "Analysis of political
tweet dataset. After data preparation, the most important discourse on twitter in the context of the 2016 US
sentiment analysis procedures have been applied on the host presidential elections." Government Information Quarterly
dataset, like cleaning the dataset in order to be ready for text 34.4 (2017): 613-626.
vectorization. Cleaning the dataset, which includes removing
stopwords, word lemmatization, regular expression and [8] Kaggle Data science Company, “Datasets,”
tokenization. We succeeded in reducing the size of content Datasets. https://www.kaggle.com/austinreese/trump-tweets
feature with the target of taking fewer capacity. With the (accessed Nov.7, 2020).
rapid growth of social media networks, it became a [9] Kam, Ho Tin. "Random decision forest."
challenged task to know the subjective polarities of tweets. Proceedings of the 3rd International Conference on
Therefore, we judged each sentence regarding their polarities Document Analysis and Recognition. Vol. 1416. Montreal,
whether they are positive, negative or neutral. At the end, the Canada, August, 1995.
accuracies of Random Forest classifier with both GNB and
SVM have been compared. Other related results to the [10] Breiman, Leo. "Random forests." Machine learning
confusion matrix and classification report tables have been 45.1 (2001): 5-32. Cutler, Adele, D. Richard Cutler, and John
given in the result and dissection section. R. Stevens. "Random forests." Ensemble machine learning.
 Springer, Boston, MA, 2012. 157-175.
The author is suggesting Random Forest over other two [11] Scikit-learn Software. https://scikit-
classifiers, which are GNB, and SVM, since Random Forest learn.org/stable/modules/naive_bayes.html (accessed May
has a good percent of accuracy and need less time compared 2, 2021)
to SVM.
 [12] Syafie, Lukman, et al. "Comparison of Artificial
For the future studies, detecting text polarities can be Neural Network and Gaussian Naïve Bayes in Recognition
classified into 7 levels (strong, moderate, weak) each with of Hand-Writing Number." 2018 2nd East Indonesia
0.25 degrees of threshold. Also, we recommend the same Conference on Computer and Information Technology
system for not only on texts, but for speech recognition and (EIConCIT). IEEE, 2018.
cleaning noisy data in practical AI and Robotics. [13] Cortes, Corinna, and Vladimir Vapnik. "Support-
The proposed method can be used in AI industries, and vector networks." Machine learning 20.3 (1995): 273-297.
applied linguistics.
 [14] Tharwat, Alaa. "Classification assessment
 methods." Applied Computing and Informatics (2020).
 [15] Kulkarni, Ajay, Deri Chong, and Feras A. Batarseh.
 "Foundations of data imbalance and solutions for a data

 470
H BARZENJI Academic Platform Journal of Engineering and Science 9-3, 460-471, 2021

democracy." Data Democracy. Academic Press, 2020. 83- 10th Annual Computing and Communication Workshop and
106. Conference (CCWC). IEEE, 2020.
[16] Elbagir, Shihab, and Jing Yang. "Twitter sentiment [24] Asur, Sitaram, and Bernardo A. Huberman.
analysis using natural language toolkit and VADER "Predicting the future with social media." 2010
sentiment." Proceedings of the International IEEE/WIC/ACM international conference on web
MultiConference of Engineers and Computer Scientists. Vol. intelligence and intelligent agent technology. Vol. 1. IEEE,
122. 2019. 2010.
[17] Li, Irene, et al. "What Are We Depressed About [25] Kaggle Data science Company, “Datasets,”
When We Talk About COVID-19: Mental Health Analysis Datasets. https://www.kaggle.com/austinreese/trump-tweets
on Tweets Using Natural Language Processing." (accessed Nov.7, 2020).
International Conference on Innovative Techniques and
 [26] Ruz, Gonzalo A., Pablo A. Henríquez, and Aldo
Applications of Artificial Intelligence. Springer, Cham,
 Mascareño. "Sentiment analysis of Twitter data during
2020.
 critical events through Bayesian networks
[18] Al-Makhadmeh, Zafer, and Amr Tolba. "Automatic classifiers." Future Generation Computer Systems 106
hate speech detection using killer natural language (2020): 92-104.
processing optimizing ensemble deep learning approach."
 [27] Patro, V. M., and M. R. Patra. “A Novel Approach
Computing 102.2 (2020): 501-522.
 to Compute Confusion Matrix for Classification of N-Class
[19] Vishwakarma, Dinesh Kumar, Deepika Varshney, Attributes with Feature Selection”. Transactions on
and Ashima Yadav. "Detection and veracity analysis of fake Machine Learning and Artificial Intelligence, Vol. 3, no. 2,
news via scrapping and authenticating the web May 2015, p. 52, doi:10.14738/tmlai.32.1108.
search." Cognitive Systems Research 58 (2019): 217-229.
 [28] Wang, Yidi, Zhibin Pan, and Yiwei Pan. "A
[20] Back, Bong-Hyun, and Il-Kyu Ha. "Comparison of Training Data Set Cleaning Method by Classification Ability
sentiment analysis from large Twitter datasets by Naïve Ranking for the $ k $-Nearest Neighbor Classifier." IEEE
Bayes and natural language processing methods." Journal of transactions on neural networks and learning systems 31.5
information and communication convergence (2019): 1544-1556.
engineering 17.4 (2019): 239-245.
 [29] Deshmukh, Kamalakshi V., and Sankirti S.
[21] Jindal, Kanika, and Rajni Aron. "A systematic study Shiravale. "Ambiguity Resolution in English Language for
of sentiment analysis for social media data." Materials Sentiment Analysis." 2018 IEEE Punecon. IEEE.
Today: Proceedings (2021). [30] Verma, M. Tech Scholar Rajat. "Natural Language
[22] Yaqub, Ussama. "Tweeting During the Covid-19 Processing (Nlp): A Comprehensive Study." (2018).
Pandemic: Sentiment Analysis of Twitter Messages by [31] Vasiliev, Yuli. Natural Language Processing with
President Trump." Digital Government: Research and Python and SpaCy: A Practical Introduction. No Starch
Practice 2.1 (2020): 1-7. Press, 2020.
 [32] Jakkula, Vikramaditya. "Tutorial on support vector
[23] Sahu, Kalyan, Yu Bai, and Yoonsuk Choi. machine (svm)." School of EECS, Washington State
"Supervised Sentiment Analysis of Twitter Handle of University 37 (2006).
President Trump with Data Visualization Technique." 2020

 471
You can also read