Collagen Family Genes Associated with Risk of Recurrence after Radiation Therapy for Vestibular Schwannoma and Pan-Cancer Analysis
←
→
Page content transcription
If your browser does not render page correctly, please read the page content below
Hindawi
Disease Markers
Volume 2021, Article ID 7897994, 15 pages
https://doi.org/10.1155/2021/7897994

Research Article
Collagen Family Genes Associated with Risk of Recurrence after
Radiation Therapy for Vestibular Schwannoma and Pan-
Cancer Analysis

          Qingyuan Shi,1 Xiaojun Yan,2 Jiyun Wang,1 and Xiangbao Zhang                                       1

          1
              Department of Otolaryngology, HwaMei Hospital, University of Chinese Academy of Sciences, China
          2
              Department of Otorhinolaryngology Head and Neck Surgery, Shanghai Ninth People’s Hospital, Shanghai Jiao Tong University
              School of Medicine, Shanghai, China

          Correspondence should be addressed to Xiangbao Zhang; hill8101@163.com

          Qingyuan Shi and Xiaojun Yan contributed equally to this work.

          Received 7 July 2021; Revised 9 August 2021; Accepted 17 August 2021; Published 13 October 2021

          Academic Editor: Yuzhen Xu

          Copyright © 2021 Qingyuan Shi et al. This is an open access article distributed under the Creative Commons Attribution License,
          which permits unrestricted use, distribution, and reproduction in any medium, provided the original work is properly cited.

          Background. The safety of radiotherapy techniques in the treatment of vestibular schwannoma (VS) shows a high rate of tumor control
          with few side effects. Neuropeptide Y (NPY) may have a potential relevance to the recurrence of VS. Further research is still needed on
          the key genes that determine the sensitivity of VS to radiation therapy. Materials and Methods. Transcriptional microarray data and
          clinical information data from VS patients were downloaded from GSE141801, and vascular-related genes associated with
          recurrence after radiation therapy for VS were obtained by combining information from MSigDB. Logistics regression was
          applied to construct a column line graph prediction model for recurrence status after radiation therapy. Pan-cancer analysis
          was also performed to investigate the cooccurrence of these genes in tumorigenesis. Results. We identified eight VS
          recurrence-related genes from the GSE141801 dataset. All of these genes were highly expressed in the VS recurrence samples.
          Four collagen family genes (COL5A1, COL3A1, COL4A1, and COL15A1) were further screened, and a model was constructed
          to predict the risk of recurrence of VS. Gene Ontology (GO) and Kyoto Encyclopedia of Genes and Genomes (KEGG)
          enrichment analyses revealed that these four collagen family genes play important roles in a variety of biological functions
          and cellular pathways. Pan-cancer analysis further revealed that the expression of these genes was significantly heterogeneous
          across immune phenotypes and significantly associated with immune infiltration. Finally, Neuropeptide Y (NPY) was found
          to be significantly and negatively correlated with the expression of COL5A1, COL3A1, and COL4A1. Conclusions. Four
          collagen family genes have been identified as possible predictors of recurrence after radiation therapy for VS. Pan-cancer
          analysis reveals potential associations between the pathogenesis of VS and other tumorigenic factors. The relevance of NPY
          to VS was also revealed for the first time.

1. Introduction                                                           tations are pontocerebellar horn syndrome and increased
                                                                          intracranial pressure. When the size of the tumor is small,
Vestibular schwannoma (VS) is a benign tumor that origi-                  patients will experience tinnitus, hearing loss, and vertigo
nates from the auditory nerve sheath and accounts for 8%                  on one side, and a few patients will become deaf after a lon-
to 10% of intracranial tumors with a similar incidence on                 ger period. As the tumor continues to grow, the patient will
the left and right sides, and occasionally bilateral [1]. VS is           experience facial muscle twitching, reduced lacrimal secre-
most common in adults, 30-50 years old; however, there is                 tion, facial numbness, reduced pain and touch, a weakened
no significant gender difference. The main clinical manifes-                corneal reflex, and other symptoms [2]. Surgery is currently
2                                                                                                                            Disease Markers

                                        Data downloaded form GEO database

                                                  DEGs (n = 265)                               GO/KEGG

                     ARGs from MSigDB
                                                                                               Volcano plot

                                                 Venn plot (n = 8)

                                                                                                 Heatmap

                                              Logistics analysis (n = 4)

                                            Nomogram prediction model

                        Calibration curve             C-index                       ROC

                                              Decision curve analysis

                       TCGA databse

                                                Pan-cancer analysis

                                                                                                              KM analysis

                              Boxplot                 Heatmap              Survival analysis

                                                                                                              Cox analysis

                                                Correlation analysis

                                   Immune subtypes                   TME estimate

Figure 1: Flowchart of the analysis process. ARGS: angiogenesis-related genes; DEGs: differentially expressed genes; TME: tumor
microenvironment.

the main treatment option [3]; however there are many risks                drug therapy [5–8]. The choice of different treatment
associated with surgical treatment, such as cerebrospinal                  modalities greatly impacts prognosis, functional preserva-
fluid leakage with an incidence of around 2% to 30% [4].                    tion, and long-term quality of life. This has necessitated
    Surgical treatment of VS no longer focuses solely on total             the medical staff that treats VS to grow from a single neu-
removal of the tumor, but instead on protecting neurological               rosurgeon to a multidisciplinary treatment team. The SRS
function, reducing the incidence of postoperative complica-                and FSRT technologies are new technologies born out of
tions, and improving the patient’s post-operative quality                  this multidisciplinary collaboration. With the accumulation
of life. As a result, some of the newer VS treatments                      of long-term clinical treatment data and practical experi-
include microsurgery, stereotactic radiosurgery (SRS), frac-               ence, the safety of SRS technology for treating VS has
tionated stereotactic radiotherapy (FSRT), and targeted                    fewer side effects and a high tumor control rate [5–8]. In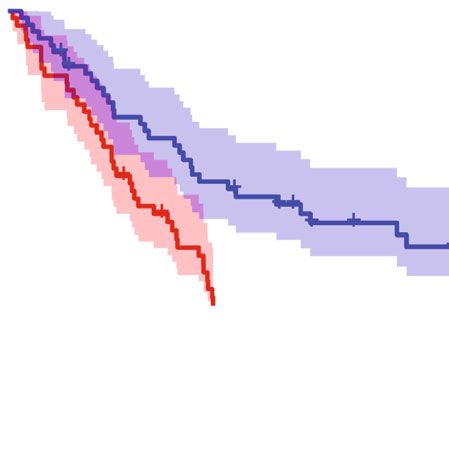
Disease Markers                                                                                                               3

                                         Table 1: Up- and downregulated pathways in KEGG.

                                                Adjust
                     Description                                                        geneID
                                                P value
                  Nicotine addiction            P < 0:001          GRIA1/CACNA1A/GRIA4/GABRA1/GRIA2/GABRD
                                                            ADCY2/GNG4/GRIA1/CACNA1A/GRIA4/GABRA1/GRIA2/ADCY1/
       Retrograde endocannabinoid signaling P < 0:001
                                                                                 GABRD
                GABAergic synapse               P < 0:001     ADCY2/GNG4/CACNA1A/GABBR2/GABRA1/ADCY1/GABRD
                Morphine addiction              P < 0:001     ADCY2/GNG4/CACNA1A/GABBR2/GABRA1/ADCY1/GABRD
Up             Circadian entrainment            P < 0:001          ADCY2/GNG4/GRIA1/RYR3/GRIA4/GRIA2/ADCY1
               Glutamatergic synapse            P < 0:001       ADCY2/GNG4/GRIA1/CACNA1A/GRIA4/GRIA2/ADCY1
             cAMP signaling pathway               0.001   ADCY2/GRIA1/SOX9/ATP1B1/GABBR2/GRIA4/PPP1R1B/GRIA2/ADCY1
                 Insulin secretion                0.001            ADCY2/ATP1B1/KCNN3/SNAP25/PCLO/ADCY1
       Adrenergic signaling in cardiomyocytes     0.003         ADCY2/PPP1R1A/ATP1B1/TNNC1/AGT/ADCY1/SCN4B
               Synaptic vesicle cycle             0.006             CACNA1A/SYT1/CPLX1/SNAP25/ATP6V1G2
             ECM-receptor interaction           P < 0:001 COL4A2/COL4A1/ITGA2/ITGB4/COL1A2/LAMB1/LAMA2/FREM2/FRAS1
          Protein digestion and absorption      P < 0:001   COL4A2/COL4A1/COL1A2/COL5A1/COL28A1/COL3A1/COL15A1
                   Focal adhesion               P < 0:001   COL4A2/COL4A1/BIRC3/ITGA2/ITGB4/COL1A2/LAMB1/LAMA2
               Small cell lung cancer           P < 0:001           COL4A2/COL4A1/BIRC3/ITGA2/LAMB1/LAMA2
                     Amoebiasis                 P < 0:001         COL4A2/COL4A1/COL1A2/LAMB1/LAMA2/COL3A1
Down      Human papillomavirus infection        P < 0:001    COL4A2/COL4A1/ITGA2/ITGB4/COL1A2/LAMB1/LAMA2/FZD8
           AGE-RAGE signaling pathway           P < 0:001             COL4A2/COL4A1/TGFBR2/COL1A2/COL3A1
             in diabetic complications
            PI3K-Akt signaling pathway          P < 0:001   COL4A2/COL4A1/ITGA2/ITGB4/COL1A2/LAMB1/LAMA2/ERBB3
             Relaxin signaling pathway           0.002                COL4A2/COL4A1/TGFBR2/COL1A2/COL3A1
              Proteoglycans in cancer            0.012                   ITGA2/RRAS/COL1A2/ERBB3/FZD8

conclusion, radiotherapy shows great potential advantages          ing angiogenic genes can help reveal the mechanism of VS
as an alternative to surgery, taking into account patient          recurrence.
comfort, quality of life, cost of treatment, and avoidance             Neuropeptide Y (NPY) is a 36 amino acid peptide that is
of potential surgical complications (i.e., meningitis, hemor-      widely distributed in the central and peripheral nervous sys-
rhage, cerebrospinal fluid leakage, hearing, and neurologi-         tems. NPY infiltration is a manifestation of innervated tis-
cal collateral damage).                                            sues and cells [21]. Neuropeptides also have an effect on
    However, 34.7% of VS patients relapsed after SRS treat-        vascular development, and neuropeptides such as NPY are
ment [9]. Therefore, further research is still needed on the       widely distributed in the perivascular area [22, 23]. Now,
efficacy of radiotherapy for different types of VS. [10, 11]          upregulation of NPY has been found to be associated with
Several studies have examined the transcriptomic profile of         abnormal vascular function [24]. We speculate that NPY
different types of VS, but few have systematically explored         may have a potential relevance to the recurrence of vestibu-
the genes associated with SRS efficacy [12–15]. Indeed, if           lar schwannoma by regulating vascular-related function.
the molecular biological features associated with VS recur-            In this study, we used bioinformatics analysis to obtain
rence can be identified, more precise VS treatments can be          genes associated with VS recurrence and studied important
achieved. The GSE141801 dataset from the Gene Expression           genes associated with angiogenesis among them and NPY.
Omnibus (GEO) database analyzes the transcriptomic pro-            Pan-cancer analysis investigated the commonality of these
file of tumors between patients with VS who relapsed after          genes in tumorigenesis.
radiation therapy alone and another group of patients who
underwent direct surgery without radiation therapy [16].           2. Materials and Methods
    Tumor recurrence after radiotherapy is closely related to
vascular infiltration. Tumor recurrence areas have higher           2.1. Data Download and Preprocessing. We downloaded
vascular and cell density, and vascular infiltration plays an       transcriptome microarray data and corresponding clinical
important role in the development of tumors [17, 18]. The          data from the GSE141801 dataset for 67 patients with VS;
relationship between vascular infiltration and vestibular           of these, nine patients relapsed after radiation therapy and
Schwannoma has been revealed in recent years [19, 20].             58 patients were a first diagnosis. We transformed the
We speculate that excessive vascular infiltration may be            microarray gene names according to the microarray plat-
associated with recurrence of VS after radiotherapy. Explor-       form file and then obtained the gene expression matrix.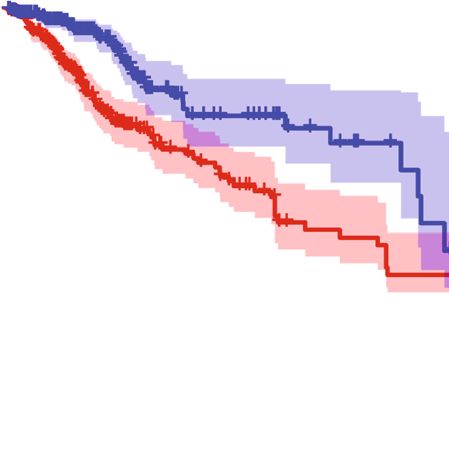
4                                                                                                                                        Disease Markers

                                    8
                                                                                 8

                                                                                                  COL4A1
                                                                                 6
                                                                                       STARD13

                                                                −Log10 P−value
                                                                                                         TGFBR2
        DEGs                                             ARGs                          COL1A2
                                                                                 4
                                                                                       COL5A1          PLA2G4A
                      257                     218
                                                                                       COL3A1
                                                                                 2
                                                                                                   COL15A1

                                                                                 0

                                                                                         −2         −1            0         1            2
                                                                                                         Log2 (fold change)
                                  (a)                                                                       (b)

                                                                                                                   6     Radiation
                                                                                              Radiation
                                                                                              Age                               YES
                                                                                              Sex                               NO
                                                                                              Tumor_subtype        4
                                                                                                                         Age
                                                                                              COL15A1                           40
                                                                                              COL4A1
                                                                                                                                N/A
                                                                                              COL1A2                     Sex
                                                                                                                   0            Male
                                                                                              COL5A1                            Female
                                                                                                                                N/A
                                                                                              COL3A1               −2
                                                                                                                         Tumor_subtype
                                                                                              STARD13                           SPO
                                                                                                                                NF2
                                                                                                                   −4
                                                                                              TGFBR2                            CYS

                                                                                              PLA2G4A
                                                                                                                   −6
                                                                    (c)

Figure 2: Results of differential and intersection analysis. (a) Venn diagram showing eight genes after taking intersection of DEGs and
ARGs. (b) Volcano diagram showing differential and intersection genes. (c) Heat map showing expression of intersecting genes in tumor
tissue and relationship to clinical traits.

The angiogenesis-associated gene set was retrieved and down-                     microarrays and tested for differences between the postra-
loaded from the MSigDB database (http://www.gsea-msigdb                          diotherapy relapse and nonradiotherapy groups. Differential
.org/gsea/msigdb/index.jsp). 226 angiogenesis-related genes                      genes were filtered by FDR < 0:05 and log2 FC > 1. GO and
were downloaded and collated from the MSigDB database.                           KEGG performed a pathway enrichment analysis of up-
The 33 pan-cancer transcriptome expression data, immune                          and downregulated genes in the tumor tissue, respectively.
subtypes, tumor microenvironment score data, and clinical
information data from the Cancer Genome Atlas (TCGA)                             2.3. Angiogenesis-Related Genes. We performed intersection
were downloaded from UCSC Xena (https://xenabrowser                              analysis between differential genes and the set of
.net/datapages/).                                                                angiogenesis-related genes. We then obtained the
                                                                                 angiogenesis-related differentially expressed genes (DEGs).
2.2. Differentially Expressed Genes. The limma package per-                       Heat and volcano maps were used to demonstrate the gene
formed batch correction of gene expression on intersample                        expression and fold change of angiogenesis-related DEGs.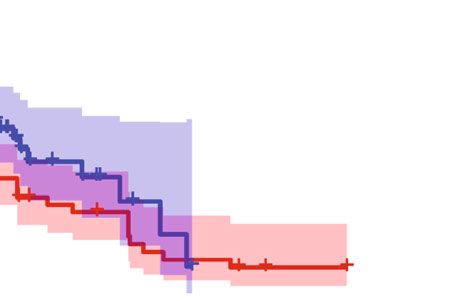
Disease Markers                                                                                                                                       5

                                                      Table 2: Eight different expression genes.

Id                             logFC                       t                      P value                       Adjust P value                    B
COL4A1                          -1.30                    -5.30                  1:42E − 06                        1:00E − 03                  5.11
STARD13                         -1.25                    -4.66                  1:54E − 05                        2:64E − 03                  2.91
TGFBR2                          -1.01                    -4.38                  4:34E − 05                        3:81E − 03                  1.97
COL1A2                          -1.38                    -4.29                  5:95E − 05                        4:18E − 03                  1.68
COL5A1                          -1.10                    -4.25                  6:69E − 05                        4:40E − 03                  1.57
PLA2G4A                         -1.26                    -3.62                  5:72E − 04                        1:15E − 02                 -0.37
COL3A1                          -1.34                    -3.05                  3:28E − 03                        3:24E − 02                 -1.93
COL15A1                         -1.19                    -2.97                  4:12E − 03                        3:73E − 02                 -2.13

                               Table 3: Uni- and multilogistics regression analyses for recurrence after radiation.

                                        Unilogistics regression                                            Multilogistics regression
Variables
                        β               Odds ratio (95% CI)          P value                β               Odds ratio (95% CI)            P value
COL4A1          -3.485                   0.031 (0.001-0.309)          0.012              -6.812                0.001 (0-0.258)              0.065
STARD13         -1.355                    0.258 (0.07-0.579)          0.008              0.613              1.847 (0.141-114.581)           0.670
TGFBR2          -2.171                   0.114 (0.009-0.531)          0.052              -6.969                0.001 (0-1.695)              0.177
COL1A2          -1.773                   0.17 (0.008-0.703)           0.198
COL5A1          -1.682                   0.186 (0.025-0.593)          0.043             -10.102                  0 (0-0.066)                0.045
PLA2G4A         -0.870                   0.419 (0.193-0.758)          0.010              -0.365              0.694 (0.046-9.363)            0.766
COL3A1          -0.551                   0.577 (0.281-0.903)          0.037              4.460            86.455 (3.837-16515.578)          0.020
COL15A1         -0.627                   0.534 (0.282-0.884)          0.025              3.490            32.775 (2.271-5105.412)           0.058
Tumor_subtype (CYS)
  NF2           0.731                    2.077 (0.223-45.81)          0.553
  SPO           0.223                    1.25 (0.171-25.518)          0.847
Note: β is the regression coefficient.

2.4. Logistic Regression Model Construction for Predicting                          Table 4: Prediction factors for recurrence after radiation.
Recurrence Rates after Radiation Therapy. Univariate and                                                        Prediction model
multifactorial logistic regression analyses were used for the                  Variables
                                                                                                β              Odds ratio (95% CI)         P value
analysis of angiogenesis-related DEGs and clinical character-
istics. The filtering criterion of risk factors for recurrence                  (intercept) 48.356 1:00E + 21 ð6:21E + 08 − 1:49E + 42Þ      0.011
after radiotherapy was P < 0:1, and risk factors were then                     COL5A1 -5.393                     0.005 (0-0.429)            0.042
screened for use in constructing logistic regression models.                   COL3A1  3.812                 45.238 (3.515-1849.766)        0.014
Next, we further constructed a nomogram to calculate the                       COL4A1 -6.648                     0.001 (0-0.068)            0.007
probability of recurrence after radiotherapy in VS patients                    COL15A1 1.525                  4.596 (0.933-42.261)          0.098
for ease of use in the clinic.
                                                                               Note: β is the regression coefficient.

2.5. Clinical Predictive Model Validation. The Caret package                   2.6. Pan-Cancer Analysis. We performed a pan-cancer anal-
was used to split the entire dataset into training and test                    ysis of the genes included in the model in the TCGA data-
groups by 7 : 3. The model was trained in the training group                   base. First, we performed differential gene expression
and then validated in the test group. The receiver operating                   analysis of the included genes in pan-cancerous and corre-
characteristic (ROC) curve and C-index were used to assess                     sponding paracancerous tissues. Correlation with heat maps
the predictive classification ability of the model in the train-                was used to demonstrate the relationship between incorpo-
ing group, the overall cohort, and the test group. C-indices                   rated gene expressions in pan-cancerous tissues. Cox pro-
between 0.7 and 1.0 represented good predictive perfor-                        portional regression models divided tumor patients into
mance of the model. A calibration curve was also produced                      the high- and low-expression groups by median gene expres-
to assess the calibration of the model. Finally, decision                      sion, and the KM method was then used to perform survival
curves were used to assess the net benefit at different proba-                   curve mapping. Finally, the relationship between genes
bility thresholds and also to assess the clinical usability and                incorporated into the model, immune-related features, and
safety of the nomogram and the model.                                          tumor microenvironment scores were further analyzed.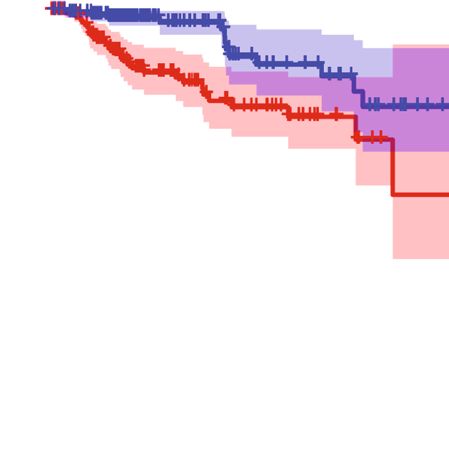
6 Disease Markers
Actual diagnosed volume increase (proportion)
0.6
0 10 20 30 40 50 60 70 80 90 0.5
Points
0.4
COL5A1
9.5 8.5 7.5 6.5 5.5 4.5 3.5
0.3
COL3A1
2 3 4 5 6 7 8 9 10 11
0.2
COL4A1
9.5 9 8.5 8 7.5 7 6.5 6 5.5 5 4.5 4
0.1
COL15A1
2 4 6 8 10
0.0
Total points
0 20 40 60 80 120 160 200 0.0 0.1 0.2 0.3 0.4 0.5 0.6
Probability of radiation Nomogram−predicted probability of volume increase
1e−04 0.9999 B = 1000 repetitions, boot Mean absolute error = 0.034 n = 67
Apparent
Bias−corrected
Ideal
(a) (b)
Figure 3: (a) Nomogram showing the column line graph prediction model for recurrence after radiotherapy. (b) Calibration graph showing
the calibration of the prediction model.
0.15
0.10
Net benefit
1.0
0.05
0.8
True positive rate
0.6
0.00
0.4
AUC of entire cohort = 0.941
0.2
AUC of training set = 0.964
AUC of validation set = 0.889 −0.05
0.0
0.0 0.2 0.4 0.6 0.8 1.0 0.0 0.2 0.4 0.6 0.8 1.0
False positive rate Threshold probability
1:100 1:4 2:3 3:2 4:1 100:1
Cost: benefit ratio
Entire cohort All
Training set None
Validation set
(a) (b)
Figure 4: (a) ROC curves showing the classification and predictive efficacy of the predictive model. (b) DCA curves showing the range of
clinical predictive safety.
2.7. Statistical Analysis. All statistics were plotted using R The ROCR package was used to plot ROC curves; the Hmisc
software (version 4.0.5). All statistical defaults were bilateral, package was used to calculate the C-index. The rms package
while P < 0:05 was considered to be statistically significant. was used for plotting the nomograms and calibration curves.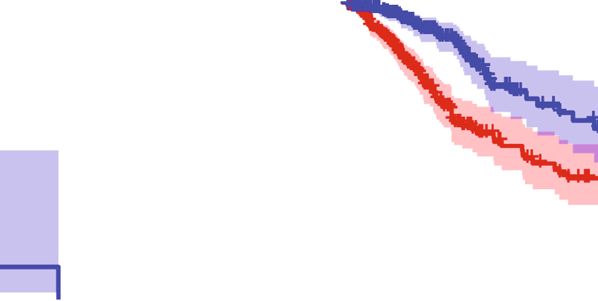
Disease Markers                                                                                                                7

The rmda package was used to plot the decision curve anal-             Table 5: C-index of the nomogram prediction model.
ysis (DCA) curves.
                                                                                             C-index of the prediction model
                                                                  Dataset group
                                                                                         C-index           The C-index (95% CI)
3. Results                                                        Training set            0.964                   0.908-1
3.1. Analysis of the Differences between the Recurrence Group      Validation set          0.889                   0.707-1
and the First Diagnosis Group after Radiotherapy. The             Entire cohort           0.941                   0.878-1
research flow chart is shown in Figure 1. The results of the
differential analysis of gene expression in both groups of
patients were saved in Supplementary table 1, and a total         3.5. Pan-Cancer Analysis. We further explored the expres-
of 265 DEGs were obtained. GO and KEGG functional                 sion of these four genes in pan-cancer and their role in the
pathway analysis results are presented in a bar chart             tumor microenvironment. Figures 5(a)–5(d) show that these
(Supplementary Figure 1), and Table 1 shows the top 10            four genes were relatively highly expressed in pan-cancerous
up- and downregulated pathways in KEGG.                           tissues compared to their paracancerous counterparts.
                                                                  Figure 6(a) shows how the expression of these four genes
                                                                  was relatively high in GBM, HNSC, STAD, LUAD, and
3.2. Angiogenesis-Related DEGs. Venn diagrams and volcano
                                                                  CHOL and relatively low in UCEC, BLCA, KIRP, and
plots (Figures 2(a) and 2(b)) showed that the eight DEGs
                                                                  PRAD, and Figure 6(b) shows the positive correlation
were also angiogenesis-related genes. All eight of these DEGs
                                                                  between the expressions of these four genes in the pan-
were highly expressed in the recurrence group after radiation
                                                                  cancerous tissue.
therapy. Table 2 shows the analysis of variance for these
eight DEGs, and the heat map (Figure 2(c)) shows their            3.6. Survival Analysis. We applied the KM method and Cox
expression of in tumor tissue and their relationship with         proportional regression models to the survival analysis of
clinical traits. These results suggest that the high expression   four genes in pan-cancer. Figure 6(c) shows the results of
of these eight DEGs is associated with recurrence after radi-     applying cox regression analysis to the four genes in the
ation therapy.                                                    pan-cancer. The HR and significance results of these four
                                                                  genes for pan-cancer were shown in Figure 6(c). Figure 7
3.3. Single- and Multifactor Logistic Regression Analysis. All    shows the statistically significant differences in the survival
characteristics were included for single- and multifactor         analysis of these four genes in MESO, KIRP, and LGG
logistic regression analyses (Table 3). Seven genes (COL4A1,      (P < 0:001).
STARD13, COL5A1, PLA2G4A, COL3A1, COL15A1, and
TGFBR2) were filtered for multivariate analysis at P < 0:1,        3.7. Immune Subtypes and the Tumor Microenvironment.
and the final four collagen family genes (COL5A1, COL3A1,          We performed differential analysis and correlation analysis
COL4A1, and COL15A1) were retained for further analysis.          of these four genes and tumor immune subtypes with tumor
                                                                  microenvironment scores. In these 33 cancers, these four
                                                                  genes differed significantly in the six tumor immune sub-
3.4. Construction and Evaluation of the Logistics Regression
                                                                  types (C1, C2, C3, C4, C5, and C6) (P < 0:05), Figure 8(a)).
Model. COL5A1, COL3A1, COL4A1, and COL15A1 were
                                                                  These four genes (COL5A1, COL3A1, COL4A1, and
included for logistic regression model construction. The
                                                                  COL15A1) and the stromal, immune, and total scores in
weights and statistical differences of the included factors in
                                                                  the tumor microenvironment were significantly correlated
the constructed logistics regression model are shown in
                                                                  in most tumors (Figures 8(b)–8(d)).
Table 4. A nomogram was used to calculate the likelihood
of recurrence after radiotherapy according to a logistics         3.8. Correlation of NPY with Collagen Family Genes and
regression model (Figure 3(a)), and a calibration graph eval-     Vestibular Schwannoma Recurrence after Radiotherapy. Four
uated the calibration of the fit of the model predictions and      collagen family genes (COL3A1, COL4A1, COL5A1, and
the actual classification (Figure 3(b)). Figure 4(a) shows the     COL15A1) were significantly positively correlated with
ROC curves and area under the curve (AUC) values for              each other (Figure 9(a)). Low expression of COL4A1 and
the model in the training set, test set, and overall cohort,      COL5A1 was associated with recurrence of vestibular
respectively (training set: 0.964, validation set: 0.889, and     schwannoma, while high expression of NPY was associated
entire cohort: 0.941). Table 5 shows the C-index for the three    with recurrence of vestibular schwannoma (Table 6). In addi-
groups and ranges from 0.889-0.964, indicating that this          tion, these genes were not significantly associated with age and
model had good predictive classification efficacy. The DCA           sex (Figures 9(b) and 9(c)). These results suggest that NPY is
curve demonstrated that the model had a good range of reli-       significantly associated with four collagen family genes
ability and safety in clinical prediction (Figure 4(b)). These    (COL3A1, COL4A1, COL5A1, and COL15A1) and recur-
results above show that the model has excellent predictive        rence after radiotherapy for vestibular schwannoma.
power. Therefore, the four collagen family genes were fur-
ther screened by combining the clinical information pro-          4. Discussion
vided from the database with the results of univariate and
multivariate logistic analyses and were used to construct a       In this study, genes associated with VS recurrence were
prediction model for the risk of recurrence of VS.                obtained using bioinformatics analysis. To investigate the
8 Disease Markers
COL3A1 expression
COL4A1 expression
10.0
10 7.5
5.0
5
2.5
0
BLCA
BRCA
CHOL
COAD
ESCA
GBM
HNSC
KICH
KIRC
KIRP
LIHC
LUAD
LUSC
BLCA
PRAD
BRCA
READ
CHOL
STAD
THCA
COAD
ESCA
UCEC
GBM
HNSC
KICH
KIRC
KIRP
LIHC
LUAD
LUSC
PRAD
READ
STAD
THCA
UCEC
Cancer type Cancer type
Type Type
Normal Normal
Tumor Tumor
(a) (b)
COL5A1 expression
COL15A1 expression
8
7.5
6
5.0
4
2.5 2
0.0 0
BLCA
BRCA
CHOL
COAD
ESCA
GBM
HNSC
KICH
KIRC
KIRP
LIHC
LUAD
LUSC
PRAD
READ
STAD
THCA
UCEC
BLCA
BRCA
CHOL
COAD
ESCA
GBM
HNSC
KICH
KIRC
KIRP
LIHC
LUAD
LUSC
PRAD
READ
STAD
THCA
UCEC
Cancer type Cancer type
Type Type
Normal Normal
Tumor Tumor
(c) (d)
Figure 5: Box plot showing the expression of the four genes in the pan-cancerous tissue and its paracancerous tissues.
role of angiogenic genes in this process, we obtained a col- ing: ESTIMATEScore, StromalScore, and StromalScore). With
lection of angiogenesis-related genes at MSigDB and inter- the exception of ACC, LAML, and SARC, all of these genes
sected them with differentially expressed genes from the (COL5A1, COL3A1, COL4A1, and COL15A1) were found to
GSE141801 dataset. Eight genes were obtained for univariate be significantly associated with immune infiltration. KEGG
and multifactorial logistic analyses, and four genes (COL5A1, and GO enrichment analyses revealed that these four collagen
COL3A1, COL4A1, and COL15A1) were screened. A column family genes played important roles in a variety of biological
line graph prediction model was constructed by applying functions and cellular pathways. Furthermore, NPY was found
logistic regression to predict the recurrence status after radi- significantly associated with four collagen family genes
ation therapy. To further investigate the commonality of (COL3A1, COL4A1, COL5A1, and COL15A1) and recur-
these genes in tumorigenesis, pan-cancer analysis was used rence after radiotherapy for VS.
to explore the role of these four target genes in tumor devel- M2-type macrophages in VS are associated with angio-
opment. Finally, the relevance of NPY to vestibular schwan- genesis and tumor growth [25]. Collagen cleavage leads to
noma was also revealed for the first time. increased macrophage adhesion and promotes macrophage
We identified eight genes from the GSE141801 dataset infiltration. [26] The expression of three collagen family
that were highly expressed in the VS recurrence samples genes (COL5A1, COL3A1, and COL4A1) was negatively
(including: COL15A1, COL4A1, COL1A2, COL5A1, correlated with the expression of NPY, which was found to
COL3A1, STARD13, TGFBR2, and PLA2G4A). Four collagen promote the migration of macrophages in collagen in vitro
family genes (COL5A1, COL3A1, COL4A1, and COL15A1) [27]. The crosstalk between collagen production and radio-
were further screened by combining the clinical information therapy has been studied extensively [16, 17]. We have
provided by the database with the results of univariate and revealed an important function of these four collagen family
multifactorial logistic analyses, and a prediction model for genes (COL5A1, COL3A1, COL4A1, and COL15A1) in VS,
the risk of recurrence of VS was constructed accordingly. and their high expression may be associated with VS radio-
These four collagen family genes were found to be highly therapy recurrence. Mutations in COL3A1 are associated
expressed in most tumor tissues. There was significant hetero- with the development of mesothelioma. [28] High expres-
geneity in the expression of these genes in different immuno- sion of COL4A1 is associated with poor prognosis in renal
phenotypes. We assessed the association of these four collagen papillary cell carcinoma [29]. In lower-grade glioma,
family genes (COL5A1, COL3A1, COL4A1, and COL15A1) COL3A1, COL4A1, and COL5A1 are associated with patient
with immune infiltration using three scoring systems (includ- prognosis and tumor progression [30, 31]. Also, theDisease Markers 9
COL4A1 COL5A1 COL3A1 COL15A1
ACC
BLCA
BRCA
CESC
CHOL
COAD
DLBC
UCEC 4 ESCA
BLCA
GBM
KIRP
KICH HNSC
3
PRAD KICH
GBM KIRC
HNSC 2
ESCA KIRP
STAD LAML
THCA 1 LGG
COAD
LIHC
READ
BRCA LUAD
0
LUAD LUSC
LUSC MESO
LIHC −1
CHOL OV
KIRC PAAD
COL3A1
COL15A1
COL4A1
COL5A1
PCPG
PRAD
READ
(a) SARC
SKCM
COL15A1
COL5A1
COL3A1
COL4A1
STAD
TGCT
1 THCA
COL5A1 0.8
0.6 THYM
0.4 UCEC
COL3A1 0.92 0.2 UCS
0
UVM
COL15A1 0.67 0.74 −0.2
−0.4
−0.6
COL4A1 0.64 0.71 0.75 0.1 1 10 0.1 1 10 0.1 1 10 0.1 1 10
−0.8
−1 HR
(b) (c)
Figure 6: (a) Heat map showing the expression of the four genes in pan-cancerous tumor tissue. (b) Correlation heat map showing the
correlation results of the expression of the four genes in pan-cancerous tissue. (c) Cox analysis showing the results of the four genes in
pan-cancerous survival analysis. Intersection with the midline represents no statistical significance.
prognosis of mesothelioma is associated with COL3A1, bioinformatics analysis to obtain genes associated with VS
COL4A1, and COL15A1. In addition, COL3A1, COL4A1, recurrence and vascularity, and the pan-cancer analysis
COL5A1, and COL15A1 are associated with immune infil- allowed the commonality of these genes in tumorigenesis to
tration in head and neck squamous cell carcinoma, breast be studied. Therefore, our database-based pan-cancer analy-
cancer, mesothelioma, and other tumors [32–35]. We per- sis suggests that these four collagen family genes (COL5A1,
formed differential analysis and correlation analysis of these COL3A1, COL4A1, and COL15A1) have commonality with
four genes (COL3A1, COL4A1, COL5A1, and COL15A1) and the progression of various tumors.
tumor immune subtypes with tumor microenvironment Low expression of COL4A1 and COL5A1 was associated
scores. Our results are consistent with previous studies, with recurrence of vestibular schwannoma; while high
showing that these four genes and the stromal scores, expression of NPY was associated with recurrence of vestib-
immune scores, and total scores in the tumor microenviron- ular schwannoma. NPY was found to promote the migration
ment are significantly correlated in most tumors. We used of macrophages in collagen in vitro [27]. Recent studies have10 Disease Markers
Cancer: MESO Cancer: KIRP
1.00 1.00
Overall survival
Overall survival
0.75 0.75
0.50 0.50
0.25 0.25
p < 0.001 p < 0.001
0.00 0.00
0 2 4 6 8 0 2 4 6 8 10 12 14 16
Time (years)
COL3A1 levels
COL4A1 levels
Time (years)
High 41 8 0 0 0 High 143 66 33 13 3 2 1 1 1
Low 43 22 8 3 0 Low 143 84 43 23 10 2 0 0 0
0 2 4 6 8 0 2 4 6 8 10 12 14 16
Time (years) Time (years)
COL3A1 levels COL4A1 levels
High High
Low Low
Cancer: LGG Cancer: MESO
1.00 1.00
Overall survival
Overall survival
0.75 0.75
0.50 0.50
0.25 0.25
p < 0.001 p < 0.001
0.00 0.00
0 2 4 6 8 10 12 14 16 18 20 0 2 4 6 8
COL4A1 levels
COL4A1 levels
Time (years) Time (years)
High 262 127 48 31 12 9 4 4 1 0 0 High 42 8 0 0 0
Low 262 127 47 25 15 10 5 1 0 0 0 Low 42 22 8 3 0
0 2 4 6 8 10 12 14 16 18 20 0 2 4 6 8
Time (years) Time (years)
COL4A1 levels COL4A1 levels
High High
Low Low
Cancer: MESO Cancer: LGG
1.00 1.00
Overall survival
Overall survival
0.75 0.75
0.50 0.50
0.25 0.25
p < 0.001 p < 0.001
0.00 0.00
0 2 4 6 8 0 2 4 6 8 10 12 14 16 18 20
COL15A1 levels
COL5A1 levels
Time (years) Time (years)
High 42 8 1 0 0 High 262 123 43 28 15 12 6 5 1 0 0
Low 42 22 7 3 0 Low 262 131 52 28 12 7 3 0 0 0 0
0 2 4 6 8 0 2 4 6 8 10 12 14 16 18 20
Time (years) Time (years)
COL15A1 levels COL5A1 levels
High High
Low Low
Figure 7: Survival curves showing the results of four genes in MESO, KIRP, and LGG (KM method).Disease Markers 11
⁎⁎⁎ ⁎⁎⁎ ⁎⁎⁎ ⁎⁎⁎
COL4A1 COL5A1 COL3A1 COL15A1
10
Gene expression
5
0
C1 C2 C3 C4 C5 C6 C1 C2 C3 C4 C5 C6 C1 C2 C3 C4 C5 C6 C1 C2 C3 C4 C5 C6
Immune subtype
Immune subtype
C1 C4
C2 C5
C3 C6
(a)
ESTIMATEScore
THYM
COAD
THCA
CHOL
SKCM
MESO
LUAD
LAML
HNSC
UCEC
READ
TGCT
PRAD
BRCA
PAAD
DLBC
PCPG
BLCA
SARC
KICH
LUSC
ESCA
STAD
CESC
UVM
LIHC
KIRC
KIRP
GBM
ACC
LGG
UCS
OV
1
COL4A1 0.6
COL5A1 0.2
COL3A1 −0.2
COL15A1 −0.6
−1
(b)
StromalScore
THYM
COAD
THCA
CHOL
SKCM
MESO
LUAD
LAML
HNSC
UCEC
READ
TGCT
PRAD
BRCA
PAAD
DLBC
PCPG
BLCA
SARC
KICH
LUSC
ESCA
STAD
CESC
UVM
LIHC
KIRC
KIRP
GBM
ACC
LGG
UCS
OV
1
COL4A1 0.6
COL5A1 0.2
COL3A1 −0.2
COL15A1 −0.6
−1
(c)
Figure 8: Continued.12 Disease Markers
ImmuneScore
THYM
COAD
THCA
CHOL
SKCM
MESO
LUAD
LAML
HNSC
UCEC
READ
TGCT
PRAD
BRCA
PAAD
DLBC
PCPG
BLCA
SARC
KICH
LUSC
ESCA
STAD
CESC
UVM
LIHC
KIRC
KIRP
GBM
ACC
LGG
UCS
OV
1
COL4A1 0.6
COL5A1 0.2
COL3A1 −0.2
COL15A1 −0.6
−1
(d)
Figure 8: The results of the analysis of variance and correlation analysis demonstrate the relationship between the four genes and (a) the
tumor immune subtype and (b–d) the tumor microenvironment score. Blanks in the heat map represent no statistically significant
differences in correlation analysis.
⁎ p < 0.05
COL15A1
COL3A1
COL4A1
COL5A1
NPY ⁎⁎ p < 0.01
Correlation
1.0
COL3A1 ⁎⁎ ⁎⁎ ⁎⁎ ⁎⁎ ⁎ ns ns ns ns ns
12
0.5 10
COL4A1 ⁎⁎ ⁎⁎ ⁎⁎ ⁎⁎ ⁎⁎
8
⁎⁎ ⁎⁎ ⁎⁎ ⁎⁎ ⁎⁎
Score
COL5A1 0.0
6
COL15A1 ⁎⁎ ⁎⁎ ⁎⁎ ⁎⁎ 4
−0.5
2
NPY ⁎ ⁎⁎ ⁎⁎ ⁎⁎
−1.0
0
COL3A1 COL4A1 COL5A1 COL15A1 NPY
40
(a) (b)
12 ns ns ns ns ns
10
8
Score
6
4
2
COL3A1 COL4A1 COL5A1 COL15A1 NPY
Female
Male
(c)
Figure 9: Correlation of NPY with collagen family genes and tumor recurrence after radiotherapy. Correlation analysis of NPY, COL3A1,
COL4A1, COL5A1, and COL15A1 with each other (a). Differential expression of these genes (NPY, COL3A1, COL4A1, COL5A1, and
COL15A1) in different ages and genders.
shown that these four collagen family genes (COL3A1, VS angiogenesis by affecting macrophages to regulate the
COL4A1, COL5A1, and COL15A1) are regulated by macro- expression of COL5A1, COL3A1, and COL4A1. This
phages [27, 36, 37]. We speculate that NPY may influence hypothesis needs to be tested by further studies.Disease Markers 13
Table 6: The basic characteristics of the patients.
Characteristic First diagnosis Relapsed P value
n 58 9
Sex, n (%) 0.888
9 (13.4%) 1 (1.5%)
Female 20 (29.9%) 4 (6%)
Male 29 (43.3%) 4 (6%)
Age, n (%) 1.000
9 (13.4%) 1 (1.5%)
40 year 23 (34.3%) 4 (6%)
COL3A1, median (IQR) 8.91 (8.61, 9.31) 8.92 (8.35, 9.48) 0.720
COL4A1, median (IQR) 8.4 (8.09, 8.68) 7.9 (7.44, 8.1) 3 cm, with brainstem COAD: Colon adenocarcinoma
displacement. And the specific mechanisms by which these DEGs: Differentially expressed genes
four collagen family genes are associated with recurrence DLBC: Lymphoid neoplasm diffuse large B-cell lymphoma
after radiation therapy for VS remains unstudied. In the ESCA: Esophageal carcinoma
future, VS-related single-cell RNA-seq would validate our FSRT: Fractionated stereotactic radiotherapy
findings. Second, the association of these four collagen fam- GBM: Glioblastoma multiforme
ily genes with NPY has not been elucidated. Third, more cel- GEO: Gene Expression Omnibus
lular and animal experiments need to be performed to GO: Gene Ontology
further explore the mechanisms involved. In addition, we LGG: Brain lower-grade glioma
have only focused on the expression abundance of these HNSC: Head and neck squamous cell carcinoma
genes; consequently, gene polymorphisms also need to be KEGG: Kyoto Encyclopedia of Genes and Genomes
explored. Third, all the data are from the database and we KICH: Kidney chromophobe
will need sufficient specimens from the clinic in the future KIRC: Kidney renal clear cell carcinoma
to verify this conclusion. In addition, patients who have KIRP: Kidney renal papillary cell carcinoma
not relapsed after radiotherapy should be selected as controls KM: Kaplan-Meier
versus those who have relapsed after radiotherapy, which LAML: Acute myeloid leukemia
will improve the scientific validity of future studies. There- LIHC: Liver hepatocellular carcinoma
fore, future cohort studies and controlled population-based LUAD: Lung adenocarcinoma
pathology studies are necessary. LUSC: Lung squamous cell carcinoma
MESO: Mesothelioma
NPY: Neuropeptide Y
5. Conclusions OV: Ovarian serous cystadenocarcinoma
PAAD: Pancreatic adenocarcinoma
In this study, the expression of four angiogenesis-related col- PCPG: Pheochromocytoma and paraganglioma
lagen family genes (COL5A1, COL3A1, COL4A1, and PRAD: Prostate adenocarcinoma
COL15A1) was a predictor of recurrence after radiation ther- READ: Rectum adenocarcinoma
apy for VS. Pan-cancer analysis also revealed their potential ROC: Receiver operating characteristic
correlation with the progression of other tumors, revealing SARC: Sarcoma
an association between the pathogenesis of VS and other SKCM: Skin cutaneous melanoma
tumorigenic factors. And the relevance of NPY to VS was SRS: Stereotactic radiosurgery
also revealed for the first time. STAD: Stomach adenocarcinoma14 Disease Markers
TCGA: The Cancer Genome Atlas and functional preservation in 70 patients,” American Journal
TGCT: Testicular germ cell tumors of Clinical Oncology, vol. 34, no. 3, pp. 265–269, 2011.
THCA: Thyroid carcinoma [7] K. D. Foote, W. A. Friedman, J. M. Buatti, S. L. Meeks, F. J.
THYM: Thymoma Bova, and P. S. Kubilis, “Analysis of risk factors associated with
UCEC: Uterine corpus endometrial carcinoma radiosurgery for vestibular schwannoma,” Journal of Neuro-
UCS: Uterine carcinosarcoma surgery, vol. 95, no. 3, pp. 440–449, 2001.
UVM: Uveal melanoma [8] B. Rykaczewski and M. Zabek, “A meta-analysis of treatment
VS: Vestibular schwannoma. of vestibular schwannoma using gamma knife radiosurgery,”
Contemp Oncol (Pozn)., vol. 18, no. 1, pp. 60–66, 2014.
[9] M. Abouzari, K. Goshtasbi, B. Sarna et al., “Prediction of ves-
Data Availability tibular schwannoma recurrence using artificial neural net-
Readers may contact the corresponding author to obtain the work,” Laryngoscope Investig Otolaryngol., vol. 5, no. 2,
pp. 278–285, 2020.
original data if desired.
[10] L. Leksell, “The stereotaxic method and radiosurgery of the
brain,” Acta Chirurgica Scandinavica, vol. 102, no. 4,
Conflicts of Interest pp. 316–319, 1951.
[11] M. Bailo, N. Boari, A. Franzin et al., “Gamma knife radio-
The authors declare no competing interests.
surgery as primary treatment for large vestibular schwan-
nomas: clinical results at long-term follow-up in a series
Authors’ Contributions of 59 patients,” World Neurosurgery, vol. 95, pp. 487–501,
2016.
Qingyuan Shi1 and Xiaojun Yan contributed equally to this [12] C. J. Przybylowski, J. F. Baranoski, G. M. Paisan et al., “Cyber-
work. Knife radiosurgery for acoustic neuromas: Tumor control and
clinical outcomes,” Journal of Clinical Neuroscience, vol. 63,
Acknowledgments pp. 72–76, 2019.
[13] J. C. Flickinger, L. D. Lunsford, M. E. Linskey, C. M. Duma,
This study was funded by the HwaMei Hospital. and D. Kondziolka, “Gamma knife radiosurgery for acoustic
tumors: multivariate analysis of four year results,” Radiother-
apy and Oncology, vol. 27, no. 2, pp. 91–98, 1993.
Supplementary Materials
[14] J. G. Rowe, M. W. Radatz, L. Walton, A. Hampshire,
Supplementary Figure 1: GEO database differential analysis S. Seaman, and A. A. Kemeny, “Gamma knife stereotactic
of GO and KEGG pathway enrichment analyses. Supple- radiosurgery for unilateral acoustic neuromas,” Journal of
mentary Table 1: the results of the differential analysis of Neurology, Neurosurgery, and Psychiatry, vol. 74, no. 11,
gene expression in both groups of patients. (Supplementary pp. 1536–1542, 2003.
Materials) [15] C. H. Wu, C. M. Chen, P. W. Cheng, and Y. H. Young, “Acute
sensorineural hearing loss in patients with vestibular schwan-
noma early after cyberknife radiosurgery,” Journal of the Neu-
References rological Sciences, vol. 399, pp. 30–35, 2019.
[1] S. D. Adib, F. H. Ebner, A. Bornemann, J. M. Hempel, and [16] I. Gugel, F. H. Ebner, F. Grimm et al., “Contribution of mTOR
M. Tatagiba, “Surgical management of primary cerebellopon- and PTEN to radioresistance in sporadic and NF2-associated
tine angle melanocytoma: outcome, recurrence and additional vestibular schwannomas: a microarray and pathway analysis,”
therapeutic options,” World Neurosurgery, vol. 128, pp. e835– Cancers (Basel), vol. 12, no. 1, p. 177, 2020.
e840, 2019. [17] M. Jarosz-Biej, R. Smolarczyk, T. Cichoń, and N. Kułach,
[2] J. Halliday, S. A. Rutherford, M. G. McCabe, and D. G. Evans, “Tumor microenvironment as a "game changer" in cancer
“An update on the diagnosis and treatment of vestibular radiotherapy,” International Journal of Molecular Sciences,
schwannoma,” Expert Review of Neurotherapeutics, vol. 18, vol. 20, no. 13, p. 3212, 2019.
no. 1, pp. 29–39, 2018. [18] N. Zarco, E. Norton, A. Quiñones-Hinojosa, and H. Guerrero-
[3] N. Aihara, H. Yamada, M. Takahashi, A. Inagaki, Cázares, “Overlapping migratory mechanisms between neu-
S. Murakami, and M. Mase, “Postoperative headache after ral progenitor cells and brain tumor stem cells,” Cellular
undergoing acoustic neuroma surgery via the retrosigmoid and Molecular Life Sciences, vol. 76, no. 18, pp. 3553–3570,
approach,” Neurologia Medico-Chirurgica (Tokyo), vol. 57, 2019.
no. 12, pp. 634–640, 2017. [19] L. B. Johnson, L. N. Jorgensen, D. Adawi et al., “The effect of
[4] A. J. Fishman, M. S. Marrinan, J. G. Golfinos, N. L. Cohen, and preoperative radiotherapy on systemic collagen deposition
J. T. Roland Jr., “Prevention and management of cerebrospinal and postoperative infective complications in rectal cancer
fluid leak following vestibular schwannoma surgery,” The patients,” Diseases of the Colon and Rectum, vol. 48, no. 8,
Laryngoscope, vol. 114, no. 3, pp. 501–505, 2004. pp. 1573–1580, 2005.
[5] U. Hani, S. Bakhshi, and M. S. Shamim, “Steriotactic radiosur- [20] J. M. Straub, J. New, C. D. Hamilton, C. Lominska,
gery for vestibular schwannomas,” The Journal of the Pakistan Y. Shnayder, and S. M. Thomas, “Radiation-induced fibrosis:
Medical Association, vol. 70, no. 5, pp. 939–941, 2020. mechanisms and implications for therapy,” Journal of Cancer
[6] B. J. Arthurs, W. T. Lamoreaux, A. R. Mackay et al., “Gamma Research and Clinical Oncology, vol. 141, no. 11, pp. 1985–
knife radiosurgery for vestibular schwannomas: tumor control 1994, 2015.Disease Markers 15
[21] R. M. Williams, J. Singh, and K. A. Sharkey, “Innervation and [36] C. E. Witherel, K. Sao, B. K. Brisson et al., “Regulation of extra-
mast cells of the rat exorbital lacrimal gland: the effects of age,” cellular matrix assembly and structure by hybrid M1/M2 mac-
Journal of the Autonomic Nervous System, vol. 47, no. 1-2, rophages,” Biomaterials, vol. 269, p. 120667, 2021.
pp. 95–108, 1994. [37] F. C. Simões, T. J. Cahill, A. Kenyon et al., “Macrophages
[22] J. L. Connat, D. Busseuil, S. Gambert et al., “Modification of directly contribute collagen to scar formation during zebrafish
the rat aortic wall during ageing; possible relation with heart regeneration and mouse heart repair,” Nature Communi-
decrease of peptidergic innervation,” Anat Embryol (Berl)., cations, vol. 11, no. 1, p. 600, 2020.
vol. 204, no. 6, pp. 455–468, 2001.
[23] M. Barr-Agholme, T. Modéer, and J. Luthman, “Immunohis-
tological study of neuronal markers in inflamed gingiva
obtained from children with Down's syndrome,” Journal of
Clinical Periodontology, vol. 18, no. 8, pp. 624–633, 1991.
[24] B. Choi, M. K. Shin, E. Y. Kim et al., “Elevated neuropeptide Y
in endothelial dysfunction promotes macrophage infiltration
and smooth muscle foam cell formation,” Frontiers in Immu-
nology, vol. 10, p. 1701, 2019.
[25] W. Wu, S. Peng, Y. Shi, L. Li, Z. Song, and S. Lin, “NPY pro-
motes macrophage migration by upregulating matrix
metalloproteinase-8 expression,” Journal of Cellular Physiol-
ogy, vol. 236, no. 3, pp. 1903–1912, 2021.
[26] A. Mazur, E. Holthoff, S. Vadali, T. Kelly, and S. R. Post,
“Cleavage of type I collagen by fibroblast activation pro-
tein-α enhances class A scavenger receptor mediated macro-
phage adhesion,” PLoS One, vol. 11, no. 3, article e0150287,
2016.
[27] W. Q. Wu, S. Peng, X. Q. Wan, S. Lin, L. Y. Li, and Z. Y. Song,
“Physical exercise inhibits atherosclerosis development by reg-
ulating the expression of neuropeptide Y in apolipoprotein E-
deficient mice,” Life sciences, vol. 237, p. 116896, 2019.
[28] M. Pagano, L. G. Ceresoli, P. A. Zucali et al., “Mutational pro-
file of malignant pleural mesothelioma (MPM) in the phase II
RAMES study,” Cancers (Basel)., vol. 12, no. 10, p. 2948, 2020.
[29] F. Li, P. Guo, K. Dong, P. Guo, H. Wang, and X. Lv, “Identifi-
cation of key biomarkers and potential molecular mechanisms
in renal cell carcinoma by bioinformatics analysis,” Journal of
Computational Biology, vol. 26, no. 11, pp. 1278–1295, 2019.
[30] Y. Jiang, J. He, Y. Guo, H. Tao, F. Pu, and Y. Li, “Identifi-
cation of genes related to low-grade glioma progression and
prognosis based on integrated transcriptome analysis,” Jour-
nal of Cellular Biochemistry, vol. 121, no. 5-6, pp. 3099–
3111, 2020.
[31] T. Deng, Y. Z. Gong, X. K. Wang et al., “Use of genome-scale
integrated analysis to identify key genes and potential molecu-
lar mechanisms in recurrence of lower-grade brain glioma,”
Medical Science Monitor, vol. 25, pp. 3716–3727, 2019.
[32] Y. Chen, Z. Y. Li, G. Q. Zhou, and Y. Sun, “An immune-related
gene prognostic index for head and neck squamous cell carci-
noma,” Clinical Cancer Research, vol. 27, no. 1, pp. 330–341,
2021.
[33] P. Xu, F. Yan, Y. Zhao et al., “Green tea polyphenol EGCG
attenuates MDSCs-mediated immunosuppression through
canonical and non-canonical pathways in a 4T1 murine breast
cancer model,” Nutrients, vol. 12, no. 4, p. 1042, 2020.
[34] H. Chen, M. Yang, Q. Wang, F. Song, X. Li, and K. Chen, “The
new identified biomarkers determine sensitivity to immune
check-point blockade therapies in melanoma,” Oncoimmunol-
ogy., vol. 8, no. 8, p. 1608132, 2019.
[35] B. Cox, M. Tsamou, K. Vrijens et al., “A co-expression analysis
of the placental transcriptome in association with maternal
pre-pregnancy BMI and newborn birth weight,” Frontiers in
Genetics, vol. 10, p. 354, 2019.You can also read