Choline PET for Monitoring Early Tumor Response to Photodynamic Therapy
←
→
Page content transcription
If your browser does not render page correctly, please read the page content below
Choline PET for Monitoring Early Tumor
  Response to Photodynamic Therapy
  Baowei Fei1, Hesheng Wang2, Chunying Wu3, and Song-mao Chiu4
  1Department  of Radiology, Emory Center for Systems Imaging, Emory University, Atlanta, Georgia; 2Department of Biomedical
  Engineering, Case Western Reserve University, Cleveland, Ohio; 3Department of Radiology, Case Western Reserve University,
  Cleveland, Ohio; and 4Department of Radiation Oncology, Case Western Reserve University, Cleveland, Ohio

Photodynamic therapy (PDT) is a relatively new therapy that has        wavelength, and oxygen. On absorption of photons, the
shown promise for treating various cancers in both preclinical         photosensitizer generates singlet oxygen and other reactive
and clinical studies. The present study evaluated the potential
                                                                       oxygen species that are toxic to cells (2). Various photo-
use of PET with radiolabeled choline to monitor early tumor re-
sponse to PDT in animal models. Methods: Two human prostate            sensitizing drugs have been synthesized for treating cancers
cancer models (PC-3 and CWR22) were studied in athymic nude            in both animals and human patients (3–7). Noninvasive
mice. A second-generation photosensitizer, phthalocyanine 4            approaches for monitoring PDT effects are now needed to
(Pc 4), was delivered to each animal by a tail vein injection 48 h     improve drug development and optimize treatment.
before laser illumination. Small-animal PET images with 11C-cho-          PET is noninvasive, and it is widely used in oncologic
line were acquired before PDT and at 1, 24, and 48 h after PDT.        applications. PET with 18F-FDG is routinely used to assess
Time–activity curves of 11C-choline uptake were analyzed before
and after PDT. The percentage of the injected dose per gram of
                                                                       tumor response to therapy in cancer patients. Small-animal
tissue was quantified for both treated and control tumors at each      PET with 18F-FDG has been used to monitor changes in
time point. In addition, Pc 4-PDT was performed in cell cultures.      glucose uptake after PDT in animals, as reported by us (8,9)
Cell viability and 11C-choline uptake in PDT-treated and control       and others (10,11). A decrease of 18F-FDG uptake was
cells were measured. Results: For treated tumors, normalized           observed in treated tumors after PDT. Other imaging
11C-choline uptake decreased significantly 24 and 48 h after
                                                                       tracers, such as radiolabeled annexin V, have been de-
PDT, compared with the same tumors before PDT (P , 0.001).
                                                                       veloped for imaging PDT-induced apoptosis (12,13).
For the control tumors, normalized 11C-choline uptake increased
significantly. For mice with CWR22 tumors, the prostate-specific          In this study, we evaluated a second-generation PDT
antigen level decreased 24 and 48 h after PDT. Pc 4-PDT in cell        drug, phthalocyanine 4 (Pc 4), and explored the potential
culture showed that the treated tumor cells, compared with the         use of PET to study tumor response to Pc 4-PDT. Pc 4 has
control cells, had less than 50% 11C-choline activity at 5, 30,        been evaluated for treating various human cancers and is
and 45 min after PDT, whereas the cell viability test showed           currently undergoing clinical trials (3). Pc 4 localizes at the
that the treated cells were viable longer than 7 h after PDT. Con-
                                                                       mitochondria, and photodynamic damage to cell mem-
clusion: PET with 11C-choline is sensitive for detecting early
changes associated with Pc 4-PDT in mouse models of human
                                                                       branes occurs immediately after PDT (14). On the other
prostate cancer. Choline PET has the potential to determine            hand, choline is taken up into cells via a choline transporter,
whether a PDT-treated tumor responds to treatment within 48            then metabolized to generate phosphocholine, and finally
h after therapy.                                                       transferred to diacylglycerol to generate phosphatidyl
Key Words: small-animal PET; choline molecular imaging; pho-           choline, which is a major constituent of membrane lipids
todynamic therapy (PDT); prostate cancer; tumor response               (Kennedy pathway) (15). In cancer cells, membrane syn-
J Nucl Med 2010; 51:130–138                                            thesis is activated during cell proliferation, and the phos-
DOI: 10.2967/jnumed.109.067579                                         phocholine level is elevated (16–18). Malignant tumors
                                                                       show an increased uptake of choline, as documented in
                                                                       the literature (18). Robust overexpression of choline kinase

P    hotodynamic therapy (PDT) is a relatively new therapy
that has shown promise for treating various cancers in both
                                                                       has been found in most primary tumors (19), providing
                                                                       the basis for imaging cancer using choline PET (20)
                                                                       and choline MR spectroscopy (21). Both choline and the
preclinical and clinical studies (1). PDT requires a photo-            photosensitizer Pc 4 are related to cell membranes, possibly
sensitizing drug, low-power laser light of an appropriate              providing a rationale for the evaluation of choline PET as
    Received Jun. 22, 2009; revision accepted Sep. 25, 2009.
                                                                       a means of detecting changes in tumor choline uptake after
   For correspondence or reprints contact: Baowei Fei, Department of   Pc 4-PDT. Although choline PET has been reported as a
 Radiology, Emory Center for Systems Imaging, Emory University, 1841
 Clifton Rd. NE, Atlanta, GA 30329.                                    means of detecting various cancers including prostate cancer
   E-mail: bfei@emory.edu                                              (22), it has not been used to monitor PDT and tumor
   COPYRIGHT ª 2010 by the Society of Nuclear Medicine, Inc.
                                                                       response. Here, we report our choline studies for Pc 4-PDT

130      THE JOURNAL      OF   NUCLEAR MEDICINE • Vol. 51 • No. 1 • January 2010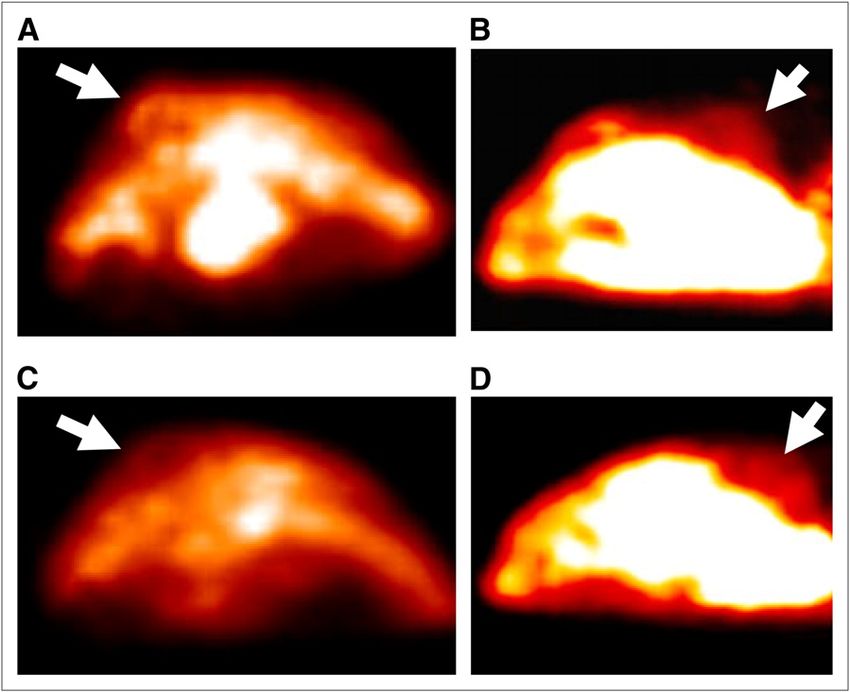
both in vivo and in vitro and discuss the potential clinical         mouse). Forty-eight hours after the photosensitizer injection, the
applications.                                                        animals were taken to the small-animal imaging facility for imaging
                                                                     and PDT. A diode laser (Applied Optronics Corp.) delivered
MATERIALS AND METHODS                                                672-nm light to the tumor surface, the longest wavelength absorp-
                                                                     tion maximum of Pc 4. The laser was coupled to a fiberoptic cable
Photosensitizer                                                      terminating in a microlens. The treatment light covered the entire
   Pc 4 [HOSiPcOSi(CH3)2(CH2)3N(CH3)2] was synthesized and           tumor and was uniformly distributed throughout the treatment field.
characterized in the laboratory of Malcolm Kenney at Case            The tumor on each animal was irradiated with a fluence of 150
Western Reserve University, using a previously detailed method       J/cm2 and an irradiance of 100 mW/cm2, which have been shown
(23). A stock solution (1 mg/mL) was made by dissolving Pc 4 in      to produce a complete response and some cures in PC-3 tumors
50% Cremophor EL (Sigma-Aldrich) and 50% absolute ethanol            (26). For the PC-3 tumor model, the second tumor in each animal
and then adding 9 volumes of normal saline with mixing. For          served as a control (receiving photosensitizer but no light).
injection, the Pc 4 stock solution was mixed with an equal volume       In this study, 15 mice were treated, among which 8 had PC-3
of 5% Cremophor EL, 5% ethanol, and 90% saline to give a final       tumors and 7 had CWR22 tumors. For the PC-3 model, each
concentration of 0.05 mg/mL (0.07 mM).                               mouse had 2 tumors, one of which was randomly selected for
Animal Tumor Models                                                  treatment and the other served as the control. The 2 tumors were
   The study was conducted with the approval of the Institutional    approximately the same size when PDT was performed. For the
Animal Care and Use Committee of Case Western Reserve                CWR22 study, each mouse had only 1 tumor because the PSA
University and conformed to the guidelines of the National           levels were measured as an independent parameter to determine
Institutes of Health for the care and use of laboratory animals.     the treatment effect.
Two human prostate cancer models (CWR22 and PC-3) were
studied in the animals. Male athymic nude mice (age, 4–6 wk;         Radiosynthesis of 11C-Choline
weight, between 25 and 30 g) were obtained from the Case                 The synthesis method for 11C-choline was previously reported
Comprehensive Cancer Center Athymic Animal Facility (Case            (27). 11C-carbon dioxide was produced by a Scanditronix MC17
Western Reserve University) and were housed 1 mouse/cage under       cyclotron and was then bubbled into a reaction vial previously
pathogen-free conditions. They were maintained under controlled      filled with LiAlH4 in a tetrahydrofuran solution (0.1 mol/L, 1 mL)
conditions (12-h dark–light cycles; temperature, 20224C), with     at room temperature. After the tetrahydrofuran was completely
free access to sterilized mouse chow.                                evaporated, hydriodic acid (57%, 1 mL) was added, and the
   The CWR22 xenograft model of human, androgen-dependent            reaction vial was heated to 120C. 11C-CH3I obtained by this wet
prostate cancer was maintained as previously described (24). A       chemistry was then distilled, dried, and trapped onto an Accell
cell suspension containing approximately 1 · 107 cells in 0.2 mL     Plus CM Sep-Pak cartridge that had been previously loaded with
of Matrigel (Collaborative Research) was injected subcutaneously     precursor N,N-dimethylaminoethanol (60 mL), which was at room
through a 19-gauge needle into the rear flank of male, athymic,      temperature. The methylation reaction took place immediately.
nude mice. Mice with CWR22 were given 12.5-mg sustained-             The final product was eluted from the cartridge by saline after
release testosterone pellets (Innovative Research of America)        being washed with ethanol and water and then passed through
subcutaneously before receiving tumor cells and at intervals of 3    a 0.2-mm sterile filter. The radiolabeling yield was approximately
mo until their death. For this CWR22 tumor model, only 1 tumor       80% (corrected to 11C-CH3I). The radiochemical purity was
was initiated on each mouse; these animals were used to measure      greater than 99%, as determined by high-performance liquid
prostate-specific antigen (PSA) after treatment, to independently    chromatography (Partisil SCX cation exchange column, 250
monitor therapeutic effect.                                          mM NaH2PO4/CH3CN [9:1, v/v]; flow rate, 1.8 mL/min).
   The PC-3 cell line was derived from a primary, malignant,
human prostate tumor (25). PC-3 cells were grown as monolayers       PET Studies
in Eagle’s minimum essential medium supplemented with 15%               Two days before PDT (day 22), the animal was injected with
fetal bovine serum at 37C. Cells were harvested by trypsinization   the photosensitizing drug Pc 4. Forty-eight hours later, the animal
in ethylenediaminetetraacetic acid/trypsin, washed in Hank’s         was taken to the small-animal PET facility for baseline image
balanced salt solution (HBSS) without Ca21 and Mg21, and             acquisition on day 0, immediately before laser irradiation for PDT.
centrifuged at 150g for 5 min. Cells were counted in a hemacy-       The first group of mice (n 5 4) underwent an additional PET scan
tometer with 0.4% trypan blue, and the cell suspension was           1 h after PDT. Because the 11C has a half-life of 20 min, there was
brought to a final concentration of 1 · 106 viable cells/mL and      a 4-h (.10 times of half-life) interval between the first and second
kept on ice for immediate injection. For this tumor cell line, 2     PET scans. The second group of mice (n 5 5) was scanned 24 h
tumors were initiated in each mouse by subcutaneous injection of     after PDT. The third group (n 5 6) was imaged 48 h after PDT.
50 mL containing 5 · 104 PC-3 cells on each flank at least 20 mm     Because our study focuses on detecting early tumor response to
apart and as far from the lung and heart as possible to minimize     PDT, the mice were imaged no more than 2 d after PDT. A
motion effects on PET.                                               dedicated microPET imaging system (R4; Siemens Preclinical
                                                                     Solutions) was used in this study. Approximately 18.5 MBq of
PDT Protocol                                                         11C-choline in 0.1 mL of physiologic saline were injected into

   Tumors were treated when the shortest dimension of the tumor      each animal via the tail vein. The mice were then immediately
reached 4–5 mm, which typically occurred 2–4 wk after implan-        scanned for 60 min with a list-mode acquisition that allowed
tation. Each animal was weighed at the time of injection, and a      retrospective determination of time binning of dynamic data.
volume of Pc 4 solution was injected into the tail vein to give      During each imaging session, the animals were taped onto a plastic
a drug dose of 0.6 mg/kg of body weight (e.g., 240 mL to a 20-g      holder and were provided with a continuous supply of 2%

                                                              CHOLINE PET     FOR   PHOTODYNAMIC THERAPY • Fei et al.               131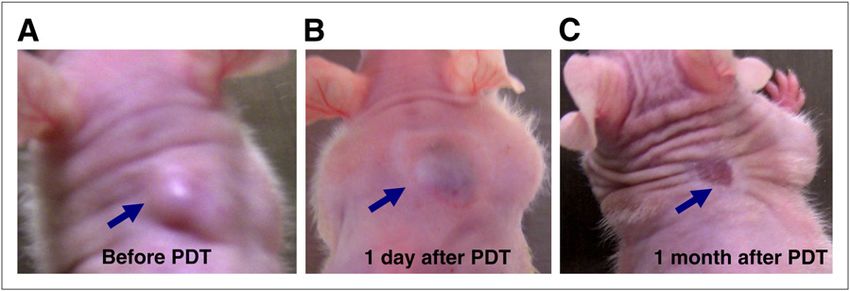
isoflurane (EZAnesthesia) in air. Animal respiration rates were        were incubated at 37C for 5, 30, and 45 min, respectively. After
monitored throughout the entire experiment; typically, the respi-      incubation, the medium was removed from the wells, and the cells
ration rate was maintained at 40/min.                                  were washed twice with 2 mL of HBSS, lysed with 2 mL of
   The PET emission scans were reconstructed using an ordered-         1% Sarkosyl NL-97 (ICN), and then washed again with HBSS.
subset expectation maximum reconstruction algorithm. Dynamic           The radioactivity in the incubation medium, lysates, and all of the
PET data were rebinned into 7 frames (600, 600, 600, 600, 600,         washes was then determined separately using a 1282 Compu-
300, and 300 s). The dimension of the reconstructed volume was         gamma g-well counter (Wallac, Inc.). Each procedure was
128 · 128 · 63 voxels. The interpolated pixel size of the PET          carefully planned and timed during the experiment. All measured
images was 0.8 · 0.8 mm with a slice thickness of 1.2 mm.              radioactivity was corrected for decay.

Quantitative Image Analysis                                            Cell Viability Test
   The percentage of the injected dose per gram of tissue (%ID/g)         After PDT, the viability of the cell populations was estimated
was obtained using the Acquisition Sinogram and Image Process-         using the trypan blue dye exclusion test (28) because the dye stains
ing software package installed with the microPET system and our        only the nonviable cells that have lost their plasma membrane
in-house software. The %ID/g was calculated as the measured            integrity.
activity per unit of volume (calibrated in kBq/mL) divided by the         PC-3 cells were grown on glass cover slips in P60 dishes. Half
injection dose (kBq) · 1 mL/g · 100. From the 7 frames of              of the plates served as controls and the other half was treated with
reconstructed PET images, normalized uptake values were calcu-         PDT. At various times after receiving PDT, cell cultures were
lated to generate normalized time–activity curves. The localiza-       stained in situ for 10 min with 0.4% trypan blue solution at room
tion of the 11C-choline accumulation on the PET images in              temperature. The stained and unstained cells were then counted
relationship to the anatomic structures was aided by the visual        under a light microscope at ·20 magnification. At least 200 cells
comparison of the PET images with the transmission images. Each        were randomly counted to determine the cell viability after each
tumor was manually segmented on each image slice using the PET         treatment because viable cells with membrane integrity were
image. A 3-dimensional region of interest was drawn around the         capable of trypan blue dye exclusion and thus remained unstained.
tumor regions. A separate 3-dimensional region of interest was         Nonviable cells with compromised membrane integrity were in-
used for each time point because the tumor size tended to change       capable of trypan blue dye exclusion and were, therefore, stained.
24–48 h after treatment.                                               Cell viability was determined as the percentage of the ratio of
   To quantify the tumor response in terms of the change of 11C-       the number of stained cells (nonviable) to the total number of
choline uptake, the %ID/g response was calculated as a percentage      unstained (viable) and stained (nonviable) cells.
change as indicated below:                                             Statistical Analysis
                                                                        Statistical analyses were performed to compare the 11C-choline
                           %ID=gdayn 2 %ID=gday0                       uptake values obtained at 4 different time points (before PDT and
      %ID=g response 5                             · 100:
                                %ID=gday0                              at 1, 24, and 48 h after PDT). The mean and SD of the uptake
                                                                       values at 7 different time frames were calculated for the treated
                                                                       tumors. Similar analysis was performed for the control tumors.
Histopathology                                                         Furthermore, the difference between the pre-PDT and post-PDT
   All tumors were stained with hematoxylin and eosin for the          uptake values was also analyzed for both treated and control
histopathologic assessment of the tumor features. To verify the        tumors. We used Excel 2007 (Microsoft) to compute a 2-tailed,
histologic tumor responses to Pc 4-PDT, mice were euthanized           2-sample Student t test. A P value less than or equal to 0.05 was
24 or 48 h after PDT. For the CWR22 mice, the tumors were              assigned statistical significance.
harvested 24 (n 5 5) and 48 h (n 5 2) after PDT. For the PC-3
mice, 16 tumors (8 PDT-treated, 8 controls) were dissected 1 (n 5      RESULTS
8) and 48 h (n 5 8) after PDT. Dissected tumors were sliced into
2–3 slices, and excised tissues were fixed overnight in a large        Treated Tumors Responded to Therapy Within 48 h
volume of 10% formalin. Histology slides were prepared at the          After Pc 4-PDT
Case Comprehensive Cancer Center Histology Core Facility.                 Figure 1 shows photographs taken of a tumor-bearing
Tissue sections of the entire specimen were then examined with         mouse before PDT and at 1 d and 1 mo after PDT. One day
an Olympus BX40 microscope at magnifications ranging from              after treatment, the mouse picture shows that the tumor
·40 to ·400.                                                           rapidly responded to the therapy. Within 2 wk after treat-
                                                                       ment, the tumor shrank. One month after PDT, the tumor
In Vitro PDT in Cell Culture                                           was healed, as shown in the picture. The mouse was
   Pc 4-PDT was performed in cells, and choline uptake was             monitored for 300 d, during which the tumor did not recur.
measured at various time points after PDT. PC-3 cells were                Table 1 shows that the PSA values of the 2 treated mice
cultured in RPMI 1640 medium in 3 wells of 6-well plates at a
                                                                       decreased at 24 and 48 h after PDT, further indicating the
concentration of 2–3 · 105 cells per well. Half of the plates served
                                                                       tumor response to Pc 4-PDT. The 2 mice (M1 and M2)
as controls and the other half was treated with PDT (200 nM of Pc
4, 200 mW/cm2, 200 mJ/cm2). Immediately after PDT, culture             were imaged and treated at the same time. Forty-eight hours
medium was replaced with HBSS supplemented with 10 mM                  after PDT, visible change of tumor tissue was observed in
N-(2-hydroxyethyl)piperazine-N9-(2-ethanesulfonic acid) (pH 7.3)       both mice. Tumor tissue demonstrated a greater change on
and 2% glucose because RPMI medium contains choline cholide.           mouse M2 than on mouse M1. Although the PSA values
11C-choline (0.5 MBq) was loaded into each well, and the cultures      decreased in both mice, the decrease in PSA was greater in

132      THE JOURNAL     OF   NUCLEAR MEDICINE • Vol. 51 • No. 1 • January 2010
FIGURE 1. Photographs of tumor-
bearing mouse before PDT (A), 1 d after
PDT (B), and 1 mo after PDT (C).
CWR22 tumor (arrow) showed rapid
response 1 d after treatment but had
disappeared 1 mo after therapy.
mouse M2, which had a higher PSA level (66.6 ng/mL) tumors, the control tumor showed slightly increased 11C-
than did mouse M1 (44.6 ng/mL) before treatment. How- choline activity and an increased tumor size due to the
ever, 2 d after PDT, both mice had similar PSA levels tumor growth during the 2 d.
(28.1 ng/mL for mouse M1 and 29.3 ng/mL for mouse M2). Figure 3 shows the time–activity curves of 11C-choline
The choline uptake decreased 48 h after PDT, compared uptake in PC-3 tumors before PDT and 48 h after PDT. The
with the pre-PDT values, in both mice (Table 1), but the %ID/g at the 7 frames (5, 15, 25, 35, 45, 53, and 57 min)
decrease was greater in mouse M2. For mouse M1, the was 17.7 6 0.2 (mean 6 SD) and 10.9 6 0.1, respectively,
normalized uptake values (%ID/g) were 12.5 and 9.5 before immediately before therapy and 48 h after PDT. Therefore,
therapy and 48 h after PDT, respectively. Therefore, the the uptake by the treated tumors decreased by 38.4% 48 h
uptake decreased by 24.1% 48 h after PDT. For mouse M2, after PDT (P , 0.001). In contrast, 11C-choline uptake by
the mean uptake values were 19.0 and 7.8 before therapy the control tumors was increased at the 48-h time point. For
and 48 h after PDT, respectively. The uptake decreased by the 4 untreated tumors from the same 4 mice, the nor-
59.2% 48 h after PDT. The choline uptake was consistent malized uptakes were 19.5 6 2.0 and 26.3 6 1.3 imme-
with both changes of PSA level. This observation is en- diately before PDT and 48 h after PDT, respectively.
couraging because the change in choline uptake may be Therefore, the 11C-choline uptake by the untreated tumors
able to predict therapeutic effect on PDT-treated tumors. increased by 35.0% during 2 d (P , 0.001). The increase in
11C-Choline
the choline uptake may have been caused by tumor growth,
Uptake Decreased in Treated Tumors and
as suggested by the increase in tumor size.
Increased in Control Tumors at 48, 24, and 1 h After PDT
Table 2 shows the 11C-choline activity of the treated and
Figure 2 shows the small-animal PET images of a tumor-
bearing mouse before PDT and 48 h after PDT. The mouse control tumors for each mouse. A decrease in 11C-choline
uptake was observed in all of the treated tumors 48 h after
was implanted with 2 PC-3 tumors. One tumor was treated,
therapy. The average %ID/g response was 237.8% for the
and the other served as the control (which received Pc 4 but
4 treated tumors. In contrast, an increase in 11C-choline
no light). Forty-eight hours after PDT, the PET images
uptake was observed in all of the control tumors 48 h after
showed that the 11C-choline activity within the PDT-treated
therapy. The average %ID/g response was 34.6% for the 4
tumor decreased. The PET images also showed high ac-
control tumors. Histologic images (Fig. 4) show the
tivity in the kidneys, which is consistent with other reports
dramatic difference between the treated and control tumors
on 11C-choline PET of animals. Compared with the treated
48 h after PDT in that there were massive areas of
inflammation and damage within the treated tumor, al-
though the untreated tumor was not damaged and the cells
TABLE 1. PSA Values (ng/mL) of Treated Mice and
11C-Choline Uptake of Treated Tumors (CWR22) were intact.
Before PDT and 48 Hours After PDT This PET study was repeated in another mouse model
(CWR22). Once again, the choline uptake was decreased at
Mouse ID
48 h after PDT, as shown in Table 1 (n 5 2). The average
Parameter M1 M2 uptake of the PDT-treated tumors was 15.7 and 8.6 im-
PSA
mediately before therapy and at 48 h after PDT, respec-
Before 44.6 66.6
24 h 34.8 41.8 tively. In this group, the uptake by the treated tumors was
48 h 28.1 29.3 decreased by 45.3% 48 h after PDT.
%ID/g To test other time points for imaging, we repeated the
Before 12.5 6 1.5 19.0 6 1.9 PET experiment 24 h after PDT (n 5 5). The choline
48 h 9.5 6 1.8 7.8 6 1.3
uptake for each mouse is listed in Table 3. For the 5 PDT-
%ID/g response 224.1% 259.2%
treated CWR22 tumors, the normalized uptake (%ID/g)
was 17.4 6 1.9 and 4.3 6 0.4 immediately before therapy
Uptake was measured by %ID/g. Numbers are means 6 SDs
and 24 h after PDT, respectively. Therefore, the uptake by
of measurements at 7 frames (5, 15, 25, 35, 45, 53, and 57 min).
the treated tumors was decreased by 75.5% 24 h after PDT
CHOLINE PET FOR PHOTODYNAMIC THERAPY • Fei et al. 133FIGURE 2. Transverse small-animal
PET images of 2 PC-3 tumors (arrows).
Images of treated tumor before PDT (A)
and 48 h after PDT (C) show that 11C-
choline uptake of treated tumor had
decreased 48 h after PDT. Images of
control tumor before PDT (B) and 48 h
after PDT (D) show slightly increased
11C-choline uptake 48 h after PDT.
Quantitative analysis results of 11C-
choline uptake in treated and control
tumors confirmed our visual inspection;
these results are shown in Figure 3.
(P , 0.001). The 24-h group showed a greater decrease untreated tumors from the same 4 mice, the average uptake
than did the 48-h group, suggesting we should image the was 20.7 and 22.7 at baseline and 1 h later, respectively.
animals at an even earlier time. 11C-Choline Uptake of PDT-Treated Tumor Cells
Table 4 shows the PET analysis results 1 h after PDT.
Decreased Within 45 min After Treatment, but Cells
Each mouse had 1 treated and 1 untreated tumor. The Were Viable Within 7 h After PDT
treated tumors had less choline uptake 1 h after therapy To separate the effect of the in vivo tissue microenvi-
than did the pre-PDT tumors. The average %ID/g response ronment from that of cellular activity, we studied the effect
was 227.7% for the 4 treated tumors just 1 h after PDT. of PDT on the uptake of 11C-choline in cultured PC-3 cells.
Rapid tumor responses to Pc 4-PDT included acute edema As shown in Figure 5, the choline uptake of cultured cells
and inflammation immediately after the treatment. How- decreased at all 3 time points (5, 30, and 45 min after PDT)
ever, the control tumors, except that in mouse M15, showed by more than 50% (56.2% 6 6.0%) in the treated cells,
slightly increased choline uptake 1 h after therapy. For the 4 compared with the control cells. There was only a small SD
at each time point (5% 6 2%). The uptake rate of 11C-
choline in the treated cells is only 46% of that in the control
cells. The choline uptake of the treated cells decreased
immediately (5 min) after PDT.
To further examine the viability of the treated cells, the
trypan blue test was performed after PDT at different time
points (30, 45, 60, and 450 min). Table 5 shows that the PDT-
treated cells were still viable within 60 min after therapy.
The percentage of nonviable cells was less than 3% at 60 min
after PDT, which is within the same range as control cells
without PDT (Table 5). More than 90% of the PDT-treated
cells were still viable even 450 min after treatment. This
viability result was consistent with those of our early in vitro
studies with Pc 4-PDT of various types of cancer cells.
FIGURE 3. Time–activity curves of 11C-choline in PDT-
treated PC-3 tumors (n 5 4) (A) and in control tumors (n 5 4) DISCUSSION
(B) of same mice before PDT and 48 h after PDT. Uptake of The PET technique can be used to noninvasively monitor
11C-choline was measured as %ID/g. Error bars represent
early tumor response to PDT and thus has the potential to
SEs.
optimize PDT in preclinical and clinical studies. PET may
134 THE JOURNAL OF NUCLEAR MEDICINE • Vol. 51 • No. 1 • January 2010TABLE 2. 11C-Choline Uptake of PDT-Treated and Control Tumors (PC-3) Before PDT and 48 Hours After PDT
Mouse ID
Parameter M3 M4 M5 M6
Treated tumors
Before 10.2 6 0.9 21.2 6 1.8 22.2 6 1.6 17.3 6 2.6
48 h 6.4 6 0.4 12.2 6 2.3 13.0 6 1.6 12.1 6 1.5
%ID/g response 237.3% 242.5% 241.5% 230.0%
Control tumors
Before 12.9 6 0.5 22.5 6 1.3 23.1 6 3.2 19.5 6 1.7
48 h 17.0 6 0.4 27.5 6 2.5 34.4 6 3.6 26.3 6 2.2
%ID/g response 32.3% 22.3% 48.8% 34.9%
Numbers are %ID/g. Means 6 SDs of %ID/g were calculated at 7 frames (5, 15, 25, 35, 45, 53, and 57 min). Each mouse (M3–M6)
had 2 tumors; one was treated and other served as control.
also be used to design and optimize the treatment for each human colon cancer (31), and human glioma (32). The
patient. If a patient does not have an early response, National Cancer Institute’s Drug Decision Network spon-
alternative treatments can then be initiated and the patient sored preclinical toxicity and pharmacokinetic evaluations
can be spared the potential morbidity resulting from of Pc 4 and developed a formulation appropriate for its use
delayed treatment. We recently demonstrated the promise in humans (33). Pc 4-PDT is under 2 phase I clinical trials
of Pc 4-PDT for treating human prostate cancer in an for treating patients with cutaneous T-cell lymphoma (3),
animal model (26). It has also been demonstrated in animal ensuring the ability to translate this animal PET study to
models that Pc 4-PDT is effective for treating human breast human patients for monitoring PDT in clinical settings
cancer (29), human ovarian epithelial carcinoma (30), because all major hospitals have PET scanners.
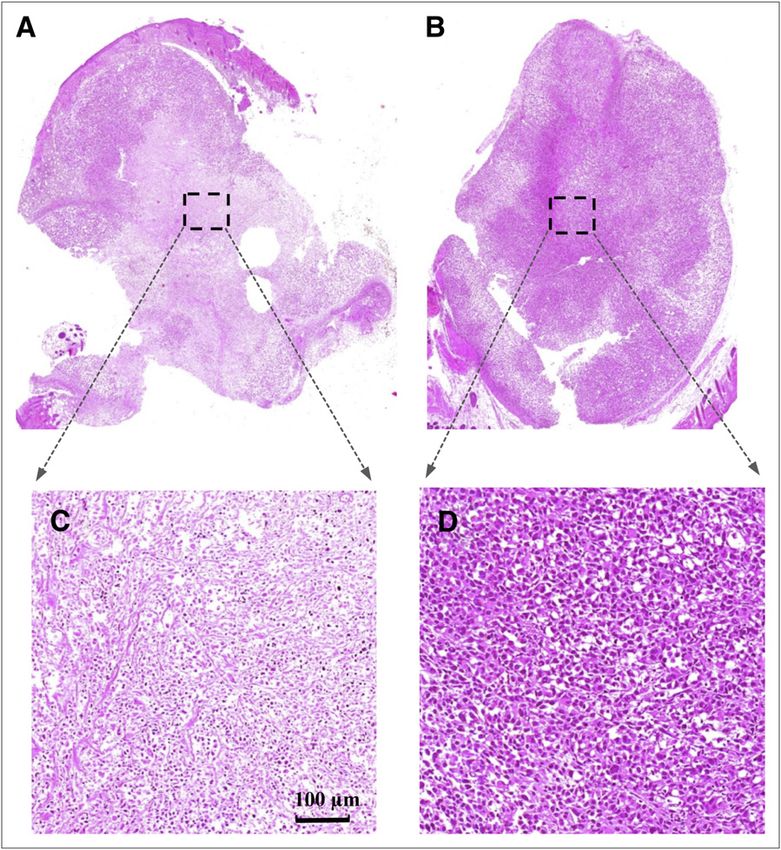
FIGURE 4. Histologic images of
treated and control PC-3 tumors at
48 h after PDT. Inflammatory response
with edema was observed in treated
tumor (A) but was not seen in control
tumor (B). Rectangular areas on A and B
are magnified and shown in C and D,
respectively. In C, massive areas of
treated tissue were damaged by PDT;
however, control tumor cells remained
intact (D).
CHOLINE PET FOR PHOTODYNAMIC THERAPY • Fei et al. 135TABLE 3. PSA Values (ng/mL) of PDT-Treated Mice and 11C-Choline Uptake of Treated Tumors (CWR22) Before PDT
and 24 Hours After PDT
Mouse ID
Parameter M7 M8 M9 M10 M11
PSA
Before 27.4 48.4 20.4 43.6 NA
24 h 26.4 34.5 14.3 35.5 NA
%ID/g
Before 16.2 6 3.6 14.2 6 2.4 15.1 6 3.8 17.7 6 1.7 23.6 6 2.3
24 h 1.0 6 0.2 4.6 6 0.3 7.2 6 1.1 4.2 6 0.8 4.2 6 1.0
%ID/g response 294.1% 267.3% 252.2% 276.0% 282.0%
Uptake was measured as %ID/g. Numbers are means 6 SDs at 7 frames (5, 15, 25, 35, 45, 53, and 57 min). PSA was not available
(NA) for mouse M11.
Choline PET may offer a new approach for PDT moni- and Bcl-xL as targets of Pc 4-PDT; the intrinsic pathway of
toring and tumor response assessment. Previous studies for apoptosis, with the key participation of caspase-3, as the
monitoring PDT have focused on measuring the light dose, central response of many human cancer cells to Pc 4-PDT;
oxygen level, or drug concentration. Light dosimetry is and signaling pathways that could modify apoptosis (3). It
critically important for limiting the light dose delivered to has been shown that Pc 4 exhibits mitochondrial localiza-
vulnerable areas of normal tissue (34). Other studies have tion and binds at or near cardiolipin (39). Cardiolipin is a
monitored the hemoglobin oxygen levels (35) and the local phospholipid that comprises approximately 22% by weight
blood flow (36). Various methods have also been developed of the inner membrane lipid of mitochondria and partici-
to measure tissue photosensitizer levels (37). Because pates in membrane bilayers (40). It has been shown that
PDT requires 3 components—that is, drug, light, and Pc 4-PDT has profound effects on cellular membranes
oxygen—any of them can be the limiting factor in de- (14). Mitochondrial reactive oxygen species were detected
termining the PDT effect in a target tumor. The overall within minutes of cell exposure to Pc 4 and to photo-
amount of light delivered to a tumor is not a reliable activating light, followed by mitochondrial inner membrane
predictor of the PDT effect (38); however, monitoring all 3 permeabilization, depolarization and swelling, cytochrome
parameters and the interplay of the factors in tissue can be c release, and apoptotic cell death. On the other hand,
complicated. Furthermore, invasive monitoring approaches choline is a substrate for the synthesis of phosphocholine,
can limit their clinical applications. Because choline PET is a precursor of phosphatidylcholine (a major constituent of
noninvasive and can provide functional information re- membrane phospholipids), including cardiolipin (Kennedy
garding tumor response to the therapy, it may be used to pathway) (15). In cancer cells, membrane synthesis is
monitor the treatment and assess the therapeutic efficacy. activated during cell proliferation and the phosphocholine
The PDT-induced decrease of choline uptake represents level is elevated (16). Pc 4-PDT reduces choline uptake as
the early tumor response to PDT, which can be explained measured in both cell cultures and animals and may, thus,
by the observations of previous in vitro mechanism studies. represent an early tumor response to the therapy. As
Extensive, early Pc 4-PDT studies in cell cultures have demonstrated in this study, the early tumor response is
identified cardiolipin and the antiapoptotic proteins Bcl-2 detectable by small-animal PET with radiolabeled choline.
TABLE 4. 11C-Choline Uptake of Treated and Control Tumors (PC-3) Before PDT and 1 Hour After PDT
Mouse ID
Parameter M12 M13 M14 M15
Treated tumors
Before 11.9 6 1.3 13.6 6 1.9 24.9 6 2.9 23.3 6 3.8
1h 11.0 6 0.7 8.5 6 1.2 14.7 6 3.0 17.6 6 3.0
%ID/g response 28.1% 237.3% 241.0% 224.4%
Control tumors
Before 14.7 6 1.9 19.4 6 2.7 21.2 6 2.9 27.4 6 5.3
1h 16.4 6 1.0 23.9 6 1.9 26.6 6 1.3 23.7 6 1.2
%ID/g response 11.6% 23.2% 25.8% 213.3%
Numbers represent %ID/g and %ID/g response. Means 6 SDs were calculated from 7 frames (5, 15, 25, 35, 45, 53, and 57 min).
136 THE JOURNAL OF NUCLEAR MEDICINE • Vol. 51 • No. 1 • January 2010evaluation of treatment response. The choline PET tech-
nique may be able to assess the response of other types of
tumors to the therapy. To the best of our knowledge, this
represents the first reported study demonstrating the use-
fulness of PET with radiolabeled choline for detecting early
tumor response to PDT.
Caution should be used when applying the conclusion
from our data to other studies. Although we used 2 human
prostate cancer models (PC-3 and CWR22), the tumors
were implanted in athymic mice, which do not show the
expected immune response of a human patient. Results
from tumor xenografts in mice may not extrapolate directly
to human cancers. In this study, we did not evaluate the
tumors for more than 2 d after PDT because we focused on
the early tumor response to PDT. It is likely that the timing
of posttherapy imaging will be an important factor in the
usefulness of PET for monitoring the therapeutic response.
In this study, 11C-choline, rather than 18F-labeled choline
analogs, was used for the PET experiments because the
11C-choline tracer can provide information regarding the
natural choline, both in vivo and in vitro. 11C has a shorter
half-life than does 18F. In another study, we are currently
investigating the possible use of MRI to quantify tumor
FIGURE 5. Pc 4-PDT–induced changes in 11C-choline necrosis and the change of blood flow after PDT; this may
uptake as function of post-PDT incubation time (5, 30, and give a useful, further insight into the PDT mechanism. In
45 min). Activity of 11C-choline in PC-3 cells was measured
this preliminary study, our results indicate that in animal
by g-counter, and unit was counted per minute (CPM). Each
data point represents 3 wells of cells, and error bars are SD. models, in vivo PET with radiolabeled choline may be able
to reveal early tumor response to PDT within 48 h after
treatment.
The in vivo PET findings were consistent with change in
PSA level and histology. Choline PET is particularly useful
for androgen-independent prostate tumors such as the PC-3 CONCLUSION
model when PSA is not available as a biomarker for the We evaluated small-animal PET with 11C-choline as a
potential, noninvasive imaging marker for monitoring
tumor response to PDT in mice. PET images are able
TABLE 5. Cell Viability Test at Various Times After PDT to reveal PDT-induced changes in 11C-choline uptake of
Time after Nonviable treated tumors from 1 to 48 h after therapy. Treated tumors
PDT (min)Dish no. Total Viable Nonviable % demonstrated a marked decrease of choline uptake after
30 1 200 193 7 3.5% treatment, whereas increases in 11C-choline uptake were
2 200 198 2 1.0% observed in untreated tumors at the same time. Histologic
3 200 196 4 2.0% images verified the therapeutic effect on the treated tumors.
45 4 224 217 7 3.1%
5 235 225 10 4.3%
PET with radiolabeled choline may provide a noninvasive
6 452 430 22 4.9% tool for monitoring early tumor response to PDT, evaluat-
60 7 208 203 5 2.4% ing new PDT drugs, optimizing PDT, and assessing the
8 250 244 6 2.4% therapeutic efficacy of PDT.
9 273 268 5 1.8%
450 10 227 210 17 7.5%
11 230 212 18 7.8% ACKNOWLEDGMENTS
12 213 193 20 9.4%
No PDT450 13 211 207 4 1.9% We thank Dr. Nancy Oleinick for inspiring discussions,
14 322 315 7 2.2% Dr. Malcolm Kenney for providing Pc 4, Dr. Thomas
15 203 198 5 2.5% Pretlow and Nancy Edgehouse for providing the CWR22
cells and for the histologic preparation, Denise Feyes for
Cell cultures were stained with trypan blue solution. Un- providing the PC-3 cells, Joseph Meyers for the animal care
stained (viable) and stained (nonviable) cells were counted for assistance, Yu Kuang for assistance with the g-counting
each dish (nos. 1–15). Percentages of nonviable cells were experiment, and Bonnie Hami for editing assistance. This
calculated for both treated and control dishes.
work was supported by National Institutes of Health (NIH)
CHOLINE PET FOR PHOTODYNAMIC THERAPY • Fei et al. 137grant CA120536 (PI: B. Fei). The imaging facility was 20. DeGrado TR, Baldwin SW, Wang S, et al. Synthesis and evaluation of 18F-labeled
choline analogs as oncologic PET tracers. J Nucl Med. 2001;42:1805–1814.
partially supported by NIH/NCI grant CA110943. 21. Gillies RJ, Morse DL. In vivo magnetic resonance spectroscopy in cancer. Annu
Rev Biomed Eng. 2005;7:287–326.
22. DeGrado TR, Coleman RE, Wang S, et al. Synthesis and evaluation of 18F-
REFERENCES
labeled choline as an oncologic tracer for positron emission tomography: initial
1. Triesscheijn M, Baas P, Schellens JH, Stewart FA. Photodynamic therapy in findings in prostate cancer. Cancer Res. 2001;61:110–117.
oncology. Oncologist. 2006;11:1034–1044. 23. Oleinick NL, Antunez AR, Clay ME, Rihter BD, Kenney ME. New
2. Oleinick NL, Morris RL, Belichenko I. The role of apoptosis in response to phthalocyanine photosensitizers for photodynamic therapy. Photochem Photo-
photodynamic therapy: what, where, why, and how. Photochem Photobiol Sci. biol. 1993;57:242–247.
2002;1:1–21. 24. Pretlow TG, Delmoro CM, Dilley GG, Spadafora CG, Pretlow TP. Trans-
3. Miller JD, Baron ED, Scull H, et al. Photodynamic therapy with the phtha- plantation of human prostatic carcinoma into nude mice in Matrigel. Cancer Res.
locyanine photosensitizer Pc 4: the case experience with preclinical mechanistic 1991;51:3814–3817.
and early clinical-translational studies. Toxicol Appl Pharmacol. 2007;224: 25. Kaighn ME, Narayan KS, Ohnuki Y, Lechner JF, Jones LW. Establishment and
290–299. characterization of a human prostatic carcinoma cell line (PC-3). Invest Urol.
4. Weersink RA, Bogaards A, Gertner M, et al. Techniques for delivery and 1979;17:16–23.
monitoring of TOOKAD (WST09)-mediated photodynamic therapy of the 26. Fei B, Wang H, Meyers J, Feyes D, Oleinick NL, Duerk JL. High-field magnetic
prostate: clinical experience and practicalities. J Photochem Photobiol B. 2005; resonance imaging of the response of human prostate cancer to Pc4-based
79:211–222. photodynamic therapy in an animal model. Lasers Surg Med. 2007;39:723–730.
5. Zaak D, Sroka R, Stocker S, et al. Photodynamic therapy of prostate cancer by 27. Pascali C, Bogni A, Itawa R, Cambiè M, Bombardieri E. [11C]Methylation on
means of 5-aminolevulinic acid-induced protoporphyrin IX: in vivo experiments a C18 Sep-Pak cartridge: a convenient way to produce [N-methyl-11C]choline.
on the dunning rat tumor model. Urol Int. 2004;72:196–202. J Labelled Comp Radiopharm. 2000;43:195–203.
6. Moore CM, Nathan TR, Lees WR, et al. Photodynamic therapy using meso tetra 28. Ray SK, Karmakar S, Nowak MW, Banik NL. Inhibition of calpain and caspase-
hydroxy phenyl chlorin (mTHPC) in early prostate cancer. Lasers Surg Med. 3 prevented apoptosis and preserved electrophysiological properties of voltage-
2006;38:356–363. gated and ligand-gated ion channels in rat primary cortical neurons exposed to
7. Du KL, Mick R, Busch TM, et al. Preliminary results of interstitial motexafin glutamate. Neuroscience. 2006;139:577–595.
lutetium-mediated PDT for prostate cancer. Lasers Surg Med. 2006;38:427–434. 29. Whitacre CM, Satoh TH, Xue L, Gordon NH, Oleinick NL. Photodynamic therapy
8. Fei B, Wang H, Muzic RF Jr, et al. Deformable and rigid registration of MRI and of human breast cancer xenografts lacking caspase-3. Cancer Lett. 2002;179:
microPET images for photodynamic therapy of cancer in mice. Med Phys. 43–49.
2006;33:753–760. 30. Colussi VC, Feyes DK, Mulvihill JW, et al. Phthalocyanine 4 (Pc 4) photodynamic
9. Fei B, Muzic R, Lee Z, et al. Registration of micro-PET and high resolution MR therapy of human OVCAR-3 tumor xenografts. Photochem Photobiol. 1999;69:
images of mice for monitoring photodynamic therapy. Proc SPIE. 2004;5369: 236–241.
371–379. 31. Whitacre CM, Feyes DK, Satoh T, et al. Photodynamic therapy with the
10. Lapointe D, Brasseur N, Cadorette J, et al. High-resolution PET imaging for in phthalocyanine photosensitizer Pc 4 of SW480 human colon cancer xenografts in
vivo monitoring of tumor response after photodynamic therapy in mice. J Nucl athymic mice. Clin Cancer Res. 2000;6:2021–2027.
Med. 1999;40:876–882. 32. George JE, Ahmad Y, Varghai D, et al. Pc 4 photodynamic therapy of U87-
11. Berard V, Rousseau JA, Cadorette J, et al. Dynamic imaging of transient derived human glioma in the nude rat. Lasers Surg Med. 2005;36:383–389.
metabolic processes by small-animal PET for the evaluation of photosensitizers 33. Egorin MJ, Zuhowski EG, Sentz DL, Dobson JM, Callery PS, Eiseman JL.
in photodynamic therapy of cancer. J Nucl Med. 2006;47:1119–1126. Plasma pharmacokinetics and tissue distribution in CD2F1 mice of Pc4 (NSC
12. Subbarayan M, Hafeli UO, Feyes DK, Unnithan J, Emancipator SN, Mukhtar H. 676418), a silicone phthalocyanine photodynamic sensitizing agent. Cancer
A simplified method for preparation of 99mTc-annexin V and its biologic Chemother Pharmacol. 1999;44:283–294.
evaluation for in vivo imaging of apoptosis after photodynamic therapy. J Nucl 34. Zhu TC, Finlay JC, Hahn SM. Determination of the distribution of light, optical
Med. 2003;44:650–656. properties, drug concentration, and tissue oxygenation in-vivo in human prostate
13. Cauchon N, Langlois R, Rousseau JA, et al. PET imaging of apoptosis with during motexafin lutetium-mediated photodynamic therapy. J Photochem Photo-
64Cu-labeled streptavidin following pretargeting of phosphatidylserine with biol B. 2005;79:231–241.
biotinylated annexin-V. Eur J Nucl Med Mol Imaging. 2007;34:247–258. 35. Yu G, Durduran T, Zhou C, et al. Noninvasive monitoring of murine tumor blood
14. Lam M, Oleinick NL, Nieminen AL. Photodynamic therapy-induced apoptosis flow during and after photodynamic therapy provides early assessment of
in epidermoid carcinoma cells: reactive oxygen species and mitochondrial inner therapeutic efficacy. Clin Cancer Res. 2005;11:3543–3552.
membrane permeabilization. J Biol Chem. 2001;276:47379–47386. 36. Li H, Standish BA, Mariampillai A, et al. Feasibility of interstitial Doppler
15. Kennedy EP, Weiss SB. The function of cytidine coenzymes in the biosynthesis optical coherence tomography for in vivo detection of microvascular changes
of phospholipides. J Biol Chem. 1956;222:193–214. during photodynamic therapy. Lasers Surg Med. 2006;38:754–761.
16. Glunde K, Jacobs MA, Bhujwalla ZM. Choline metabolism in cancer: 37. Zhou X, Pogue BW, Chen B, et al. Pretreatment photosensitizer dosimetry reduces
implications for diagnosis and therapy. Expert Rev Mol Diagn. 2006;6:821–829. variation in tumor response. Int J Radiat Oncol Biol Phys. 2006;64:1211–1220.
17. Katz-Brull R, Margalit R, Degani H. Differential routing of choline in implanted 38. Sterenborg H, de Wolf J, Koning M, Kruijt B, van den Heuvel A, Robinson D.
breast cancer and normal organs. Magn Reson Med. 2001;46:31–38. Phosphorescence-fluorescence ratio imaging for monitoring the oxygen status
18. Yoshimoto M, Waki A, Obata A, Furukawa T, Yonekura Y, Fujibayashi Y. during photodynamic therapy. Opt Express. 2004;12:1873–1878.
Radiolabeled choline as a proliferation marker: comparison with radiolabeled 39. Morris RL, Azizuddin K, Lam M, et al. Fluorescence resonance energy transfer
acetate. Nucl Med Biol. 2004;31:859–865. reveals a binding site of a photosensitizer for photodynamic therapy. Cancer Res.
19. Lenkinski RE, Bloch BN, Liu F, et al. An illustration of the potential for 2003;63:5194–5197.
mapping MRI/MRS parameters with genetic over-expression profiles in human 40. Hoch FL. Cardiolipins and biomembrane function. Biochim Biophys Acta. 1992;
prostate cancer. MAGMA. 2008;21:411–421. 1113:71–133.
138 THE JOURNAL OF NUCLEAR MEDICINE • Vol. 51 • No. 1 • January 2010You can also read