NR2F2 Orphan Nuclear Receptor is Involved in Estrogen Receptor Alpha-Mediated Transcriptional Regulation in Luminal A Breast Cancer Cells - MDPI
←
→
Page content transcription
If your browser does not render page correctly, please read the page content below
International Journal of
            Molecular Sciences

Article
NR2F2 Orphan Nuclear Receptor is Involved in
Estrogen Receptor Alpha-Mediated Transcriptional
Regulation in Luminal A Breast Cancer Cells
Edina Erdős 1,2        and Bálint László Bálint 1, *
 1    Genomic Medicine and Bioinformatic Core Facility, Department of Biochemistry and Molecular Biology,
      Faculty of Medicine, University of Debrecen, 98 Nagyerdei krt., H-4032 Debrecen, Hungary;
      edina.erdos@med.unideb.hu
 2    Doctoral School of Molecular Cell and Immune Biology, Faculty of Medicine, University of Debrecen,
      98 Nagyerdei krt., H-4032 Debrecen, Hungary
 *    Correspondence: lbalint@med.unideb.hu

 Received: 10 February 2020; Accepted: 9 March 2020; Published: 11 March 2020

 Abstract: Nuclear Receptor Subfamily 2 Group F Member 2 (NR2F2) is a member of the steroid/thyroid
 hormone receptor superfamily with a crucial role in organogenesis, angiogenesis, cardiovascular
 development and tumorigenesis. However, there is limited knowledge about the cistrome and
 transcriptome of NR2F2 in breast cancer. In this study, we mapped the regulatory mechanism by
 NR2F2 using functional genomic methods. To investigate the clinical significance of NR2F2 in breast
 cancer, The Cancer Genome Atlas (TCGA) data were used. These results show that a high NR2F2 is
 associated with better survival of a specific subset of patients, namely those with luminal A breast
 cancer. Therefore, genome-wide NR2F2 and estrogen receptor alpha (ERα) binding sites were mapped
 in luminal A breast cancer cells using chromatin immunoprecipitation followed by high-throughput
 sequencing (ChIP-Seq), revealing that most NR2F2 overlap with ERα that are co-occupied by forkhead
 box A1 (FOXA1) and GATA binding protein 3 (GATA3) in active enhancer regions. NR2F2 overlaps
 with highly frequent ERα chromatin interactions, which are essential for the formation of ERα-bound
 super-enhancers. In the process of the transcriptome profiling of NR2F2-depleted breast cancer
 cells such differentially expressed genes have been identified that are involved in endocrine therapy
 resistance and are also ERα target genes. Overall, these findings demonstrate that the NR2F2 nuclear
 receptor has a key role in ERα-mediated transcription and it can offer a potential therapeutic target in
 patients with luminal A breast cancer.

 Keywords: estrogen receptor alpha; NR2F2; cistrome; active histone modifications; chromatin
 interactions; breast cancer; luminal A subtype

1. Introduction
     Breast cancer is the most frequently diagnosed form of cancer among women in the world
(GLOBOCAN 2018) [1]; its mortality, however, has decreased in recent years due to advances in
available therapies. The presence of estrogen receptor alpha (ERα) in cancerous cells has a crucial role
in the treatments, which associates with better survival and is the key target of endocrine therapy.
ERα, as a nuclear receptor, binds with DNA-regulating elements due to the effect of ligand, which
changes the activity of particular genes [2]. A large number of co-regulators have been identified in
ERα regulatory complex [3]. These co-regulators can modulate the functional activity of ERα and offer
potential therapeutic targets.
     The chicken ovalbumin upstream promoter transcription factor II (COUP-TFII, otherwise known
as NR2F2) belongs to the family of steroid/thyroid nuclear receptors [4]. Nuclear receptors regulate the

Int. J. Mol. Sci. 2020, 21, 1910; doi:10.3390/ijms21061910                         www.mdpi.com/journal/ijms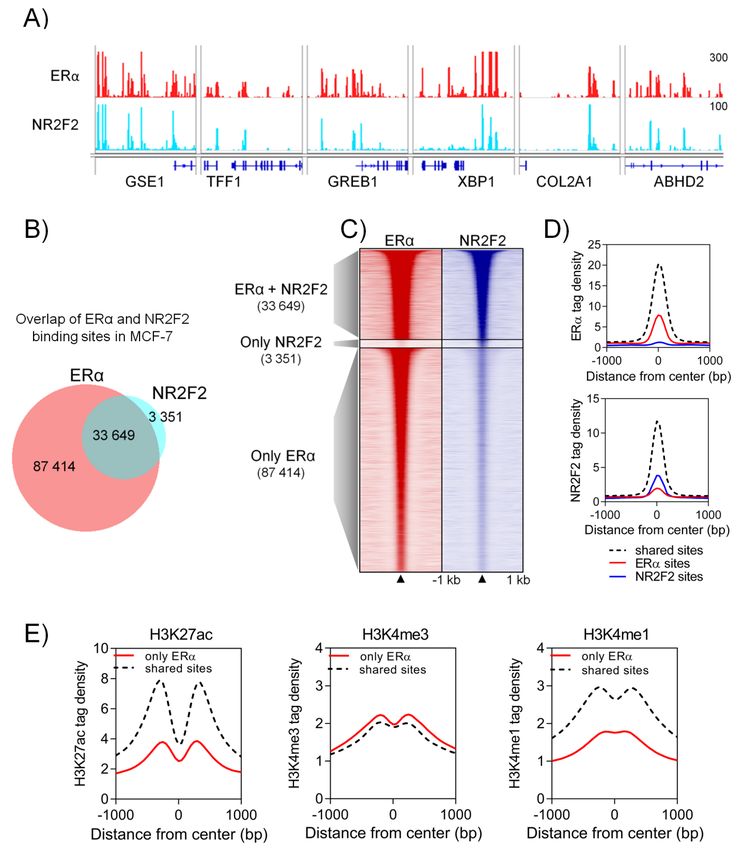
Int. J. Mol. Sci. 2020, 21, 1910                                                                      2 of 15

expression of their target genes either negatively or positively due to the effect of the ligand. The natural
ligand of NR2F2, however, has not yet been identified, thus, it is considered an orphan nuclear receptor.
As a nuclear receptor, it can bind to the direct repeat of the AGGTCA motif both in homo- and
heterodimer form with another nuclear receptor such as retinoid X receptor (RXR). NR2F2 binding is
very flexible to nuclear receptor motifs, and it can recognize the motif of other nuclear receptors (ERα,
hepatocyte nuclear factor 4 alpha (HNF4A), thyroid receptor (TR), vitamin D receptor (VDR)); thus, it
results in a competition for DNA binding sites between nuclear receptors [5]. NR2F2 plays a role in
such developmental processes as organogenesis, angiogenesis and lymphogenesis, and at the same
time it has also been found to have a critical role in tumorigenesis [6]. It has been shown in breast cancer
that the expression of the NR2F2 is lower in ER-negative cancer and it participates in chemoresistance
in cell-type and agent-specific form [7]. Riggs et al. reported that a decreased NR2F2 expression
correlates with antiestrogen resistance, i.e., if NR2F2 was knocked out of tamoxifen-sensitive MCF-7
cells, the effect of tamoxifen ended, but if NR2F2 was made to overexpress in tamoxifen-resistant cells,
sensitivity to tamoxifen was reestablished [8]. All this supports that NR2F2 plays an important role in
the response given to the treatment of breast cancer patients; however, the genome-wide regulation of
NR2F2 is not known in breast cancer.
      Several studies have reported that NR2F2 is a critical nuclear receptor in cardiovascular
development [9–12], but we demonstrate that this nuclear receptor has a different molecular function
in breast cancer. In this paper, we investigated the gene expression level of NR2F2 in patients with
different breast cancer subtypes. NR2F2 is associated with good survival and prognosis in patients
with ER-positive breast cancer. To understand the molecular mechanism of NR2F2 in breast cancer,
we determined the cistrome and transcriptome of NR2F2 in the ER-positive breast cancer cell lines
(MCF-7 and T47D) using the chromatin immunoprecipitation followed by high-throughput sequencing
(ChIP-seq) and RNA-seq methods. This work provides evidence that NR2F2 is associated with
ERα-mediated transcriptional programs. Our findings suggest the importance of NR2F2 in breast
cancer treatment and prognosis.

2. Results

2.1. A High NR2F2 Expression Level Is Associated with Better Outcome in Patients with Luminal a Breast
Cancer
     To examine the expression of the NR2F2 gene in different breast cancer subgroups, we used the
RNA-Seq data of 817 patients derived from a TCGA database. Patients were divided into histologically
invasive ductal carcinoma (IDC), invasive lobular carcinoma (ILC) and mixed IDC/ILC groups. The IDC
patients were further divided into the PAM50 subtype, while ILC and mixed patients mostly exhibit
luminal A subtype (90%); thus, there was no subcategorization in their case. In the six groups created this
way, we investigated the expression of ESR1 and NR2F2 genes (Figure 1A). Patients with ER-negative
breast cancer (IDC HER2+ and basal) show a low ESR1 and NR2F2 mRNA level. ER-positive breast
cancer patients with luminal A and luminal B subtypes show a higher expression of ESR1 and NR2F2.
The expression of NR2F2 is significantly the highest in ILC luminal A subtype compared to other
groups (p < 0.01, Mann Whitney test).
     To investigate the effects of NR2F2 gene expression on survival, we first compared the survival
of patients in ERα positive and negative sub-groups with the low and high expression of NR2F2
(Figure 1B). We have found that patients with ER-positive breast cancer show significant (logrank
p < 0.0001, Mantel-Cox test) differences in disease-free survival (DFS) based on NR2F2 expression.
Next, we investigated the DFS in two sub-groups (Luminal A and B) of patients with ER-positive breast
cancer, disregarding the origin of cancerous cells (ductal or lobular) (Figure 1C). We have found that
patients with luminal A breast cancer and a high expression of NR2F2 have better disease-free survival
(logrank p < 0.0001, Mantel-Cox test) than those with a low NR2F2 level. Patients with luminal B breast
cancer show no difference in DFS. All these findings suggested that NR2F2 has an important role in
ER-positive luminal A type breast cancer.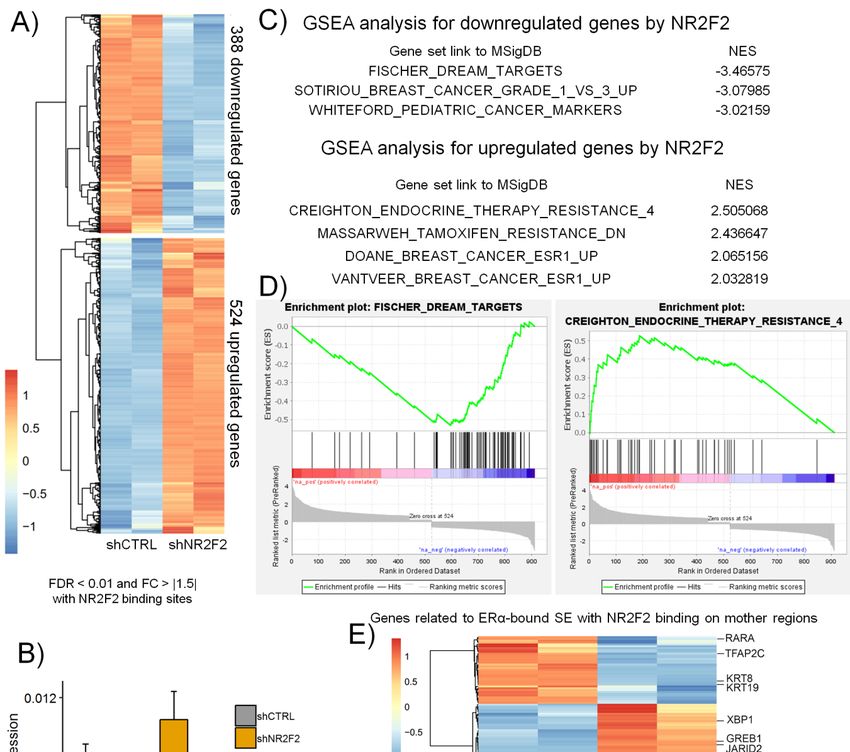
Int. J. Mol. Sci. 2020, 21, 1910                                                                                          3 of 15
 Int. J. Mol. Sci. 2020, 21, x FOR PEER REVIEW                                                                             3 of 15

     Figure 1. NR2F2 shows a high expression level in patients with ERα positive breast cancer. (A) Box
      Figure
     plots  show1. NR2F2    shows
                    differences     a high
                                 in ESR1    expression
                                          (encoding      level
                                                      ERα)     in patients
                                                            (upper         withNR2F2
                                                                    panel) and   ERα positive     breastgene
                                                                                         (lower panel)    cancer.  (A) Box
                                                                                                              expression
      plots show
     between     each differences    in ESR1
                       subtype of breast        (encoding
                                           cancer   patients.ERα)  (upper panel)
                                                              Mann-Whitney    test, *and             p < 0.05,
                                                                                           NR2F2at(lower
                                                                                      significant               ** p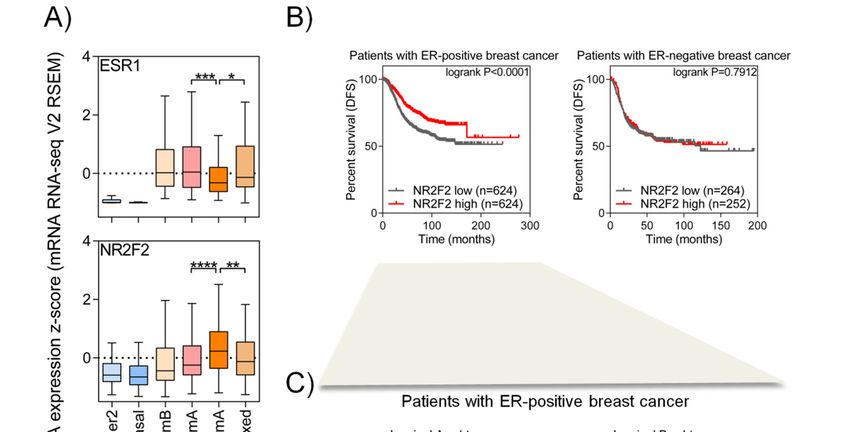
Int. J. Mol. Sci. 2020, 21, 1910 4 of 15
Int. J. Mol. Sci. 2020, 21, x FOR PEER REVIEW 4 of 15
enhancer specific histone modifications (H3K27ac and H3K4me1) than the individual ERα binding
show higher ChIP-seq intensities for active enhancer specific histone modifications (H3K27ac and
sites (Figure 2E). Altogether, the vast majority of NR2F2 overlap with highly enriched ERα binding at
H3K4me1) than the individual ERα binding sites (Figure 2E). Altogether, the vast majority of NR2F2
active enhancer regions.
overlap with highly enriched ERα binding at active enhancer regions.
Figure 2. NR2F2 at ERα binding events in MCF-7 cells. (A) The Integrative Genomics Viewer IGV
Figure 2. NR2F2
screenshot shows at ERα
ERα andbinding events in
NR2F2 binding MCF-7
sites at ERαcells. (A)genes.
target The Integrative Genomics
(B) Proportional Venn Viewer
diagramIGV and
screenshot shows ERα and NR2F2 binding sites at ERα target genes. (B) Proportional Venn
(C) heatmap represent the overlapping regions between ERα and NR2F2 binding sites. (D) Histograms diagram
and
show(C)
theheatmap
ERα and represent
NR2F2 tagthe overlapping
density at sharedregions betweenbinding
and individual ERα and NR2F2
sites. binding sites.
(E) Histograms show(D) the
Histograms show the
H3K27ac, H3K4me3 andERα and NR2F2
H3K4me1 tag density
tag density at sharedat and
shared and individual
individual ERα bindingbinding
sites. sites. (E)
Histograms show the H3K27ac, H3K4me3 and H3K4me1 tag density at shared and individual ERα
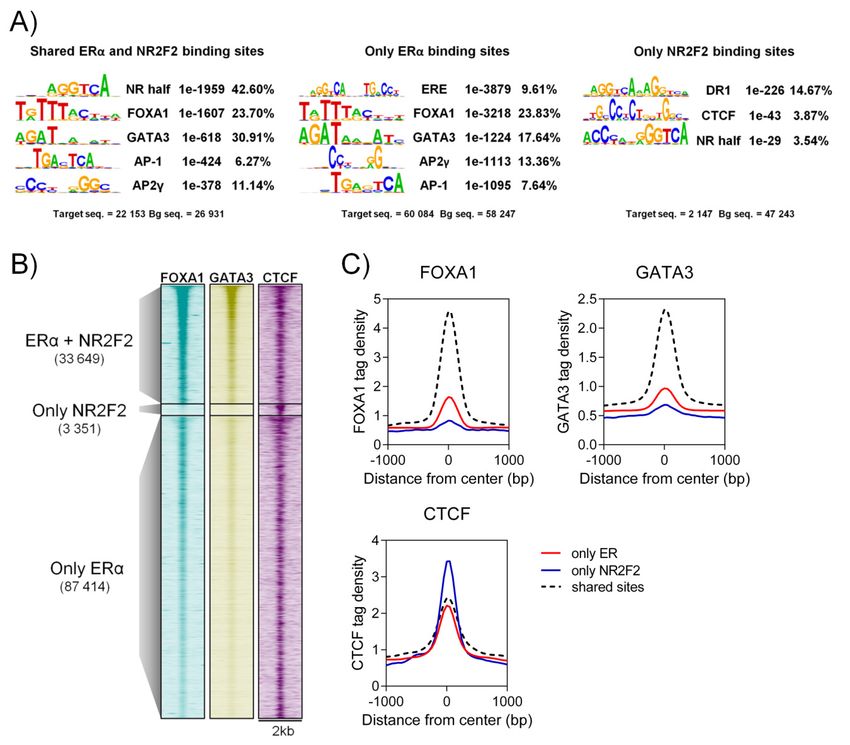
2.3. NR2F2
bindingBinds
sites. to ERα Binding Sites Co-Occupied by FOXA1 and GATA3 Co-Regulators
Based on earlier studies, many well-known co-regulators such as forkhead box A1 (FOXA1),
2.3. NR2F2 binds to ERα binding sites co-occupied by FOXA1 and GATA3 co-regulators
GATA binding protein 3 (GATA3) and activator protein 2 gamma (AP2γ) have been identified at
Based on earlier studies, many well-known co-regulators such as forkhead box A1 (FOXA1),
GATA binding protein 3 (GATA3) and activator protein 2 gamma (AP2γ) have been identified at the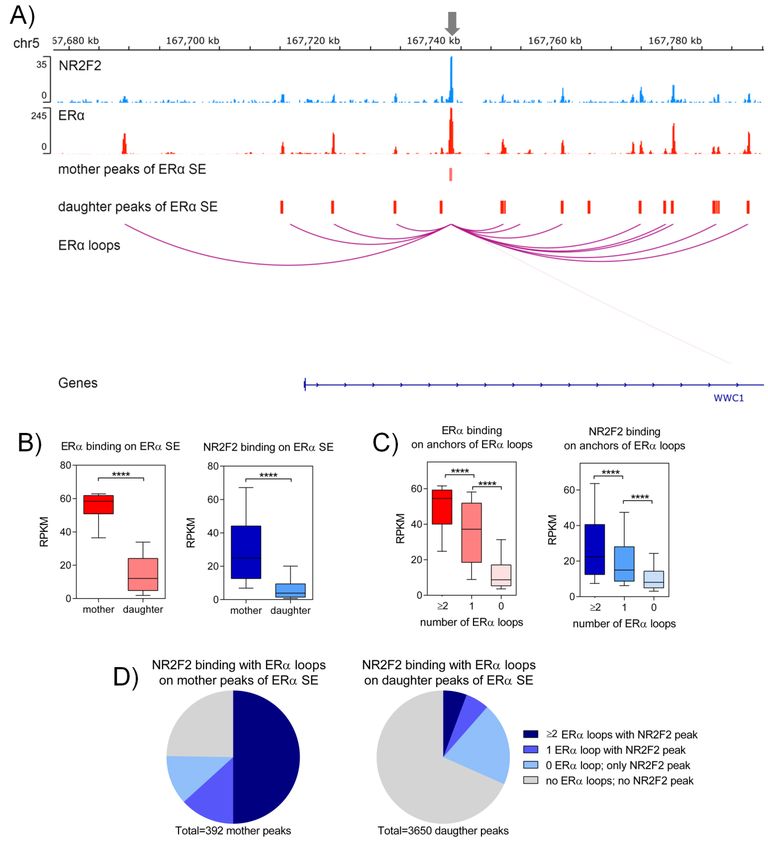
Int. J. Mol. Sci. 2020, 21, 1910                                                                               5 of 15

 Int. J. Mol. Sci. 2020, 21, x FOR PEER REVIEW                                                                  5 of 15

the ERα regulatory complex [14–18]. To investigate the co-binding of other transcription factors at
 ERα regulatory complex [14–18]. To investigate the co-binding of other transcription factors at
individual and shared NR2F2 and ERα binding sites, we performed motif-enrichment analysis using
 individual and shared NR2F2 and ERα binding sites, we performed motif-enrichment analysis using
Hypergeometric Optimization of Motif EnRichment (HOMER). Shared ERα and NR2F2 binding sites
 Hypergeometric Optimization of Motif EnRichment (HOMER). Shared ERα and NR2F2 binding
and individual ERα binding sites show the enrichment of nuclear receptor specific half-sites, FOXA1,
 sites and individual ERα binding sites show the enrichment of nuclear receptor specific half-sites,
GATA3, activator protein 1 (AP-1) and AP2γ motifs (Figure 3A). The estrogen response element (ERE)
 FOXA1, GATA3, activator protein 1 (AP-1) and AP2γ motifs (Figure 3A). The estrogen response
motif was enriched at individual ERα binding sites. Only the percentage of the GATA3 motif shows
 element (ERE) motif was enriched at individual ERα binding sites. Only the percentage of the
differences between individual and shared ERα binding sites (17.64% at only ERα vs. 30.91% at
 GATA3 motif shows differences between individual and shared ERα binding sites (17.64% at only
shared ERα). Direct repeat 1 (NR2F2 consensus sequences) and CTCF motif were enriched at individual
 ERα vs. 30.91% at shared ERα). Direct repeat 1 (NR2F2 consensus sequences) and CTCF motif were
NR2F2 binding sites. Based on this result, a well-known ERα co-factor FOXA1, GATA3 and CTCF
 enriched at individual NR2F2 binding sites. Based on this result, a well-known ERα co-factor
binding intensities were investigated at individual and shared ERα and NR2F2 binding sites. We found
 FOXA1, GATA3 and CTCF binding intensities were investigated at individual and shared ERα and
higher FOXA1 and GATA3 ChIP-seq signal intensities at shared ERαα and NR2F2 binding sites than
 NR2F2 binding sites. We found higher FOXA1 and GATA3 ChIP-seq signal intensities at shared
individual binding sites, while CTCF shows higher binding intensities at individual NR2F2 binding
 ERαα and NR2F2 binding sites than individual binding sites, while CTCF shows higher binding
sites. Overall, our results suggest that NR2F2 binds to the ERα regulatory complex in the presence of
 intensities at individual NR2F2 binding sites. Overall, our results suggest that NR2F2 binds to the
FOXA1 and GATA3 co-factors.
 ERα regulatory complex in the presence of FOXA1 and GATA3 co-factors.

       Figure3.3. Co-factors
      Figure      Co-factors atat shared
                                   sharedERα
                                          ERαand
                                               andNR2F2
                                                    NR2F2andandindividual
                                                                 individualbinding
                                                                            bindingsites
                                                                                     sitesininMCF-7.
                                                                                               MCF-7. (A)
                                                                                                        (A)Motif
                                                                                                            Motif
      enrichment   analysis  at shared  and individual  ERα and  NR2F2  binding  sites. Motif  logo, motif
       enrichment analysis at shared and individual ERα and NR2F2 binding sites. Motif logo, motif name,   name,
      p-value
       p-valueand
                andpercent  of target
                      percent         are represented.
                                of target              (B) Heatmap
                                           are represented.         and (C)and
                                                             (B) Heatmap    histograms   represent represent
                                                                                 (C) histograms     the ChIP-seq
                                                                                                              the
      signal intensities of FOXA1, GATA3 and CTCF at shared and individual binding sites in MCF-7 cells.
       ChIP-seq signal intensities of FOXA1, GATA3 and CTCF at shared and individual binding sites in
       MCF-7 cells.

 2.4. NR2F2 Contributes to the Formation of ERα Super-Enhancers
      Super-enhancers (SEs) are a large group of enhancers that are close to each other physically and
 correlate with high density binding of transcription factors and active chromatin regions (H3K27ac).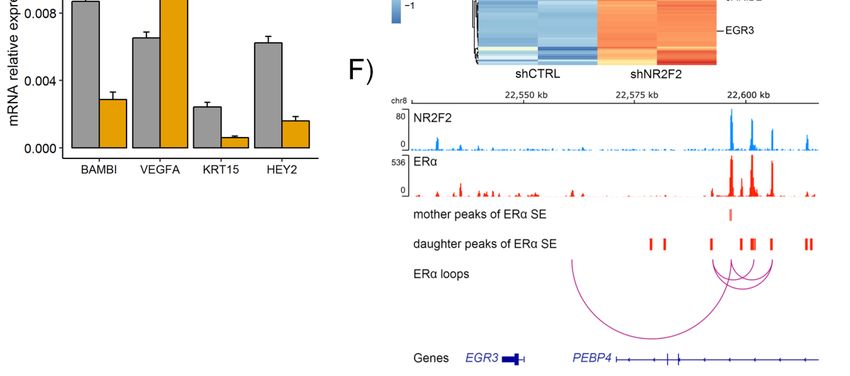
Int. J. Mol. Sci. 2020, 21, 1910                                                                      6 of 15

2.4. NR2F2 Contributes to the Formation of ERα Super-Enhancers
     Super-enhancers (SEs) are a large group of enhancers that are close to each other physically
and correlate with high density binding of transcription factors and active chromatin regions
(H3K27ac). [19]. Super-enhancers regulate genes that exhibit cell-type-specific regulation, contributing
to the maintenance of cell identity, be it normal or cancerous [20]. The regulatory elements (enhancers,
super-enhancers) are often located far away from the promoter of target genes. The three-dimensional
(3D) structure and the organization of the genome make it possible for them to get closer to each other [21].
In our research group, we identified ERα-bound super-enhancers where mother and daughter regions of
super-enhancers form a regulatory unit [22]. Here, we investigated the presence of NR2F2 within these
ERα-bound super-enhancers. We have identified NR2F2 binding within ERα-bound super-enhancers
in regions that are close to WWC1, JARID2 and SIAH2 genes (Figure 4A and Figure S2). Comparing the
tag densities of ERα and NR2F2 ChIP-seq at mother and daughter regions of ERα-bound SEs revealed
significantly higher ERα and NR2F2 binding (p < 0.0001 with Mann-Whitney test) on mother regions
of ERα-bound SEs than on daughter regions of ERα-bound SEs (Figure 4B). Super-enhancers associate
with high-frequency chromatin interactions [23–25]. To investigate the NR2F2 binding intensities at
ERα-mediated long-range chromatin interactions, we used ERα ChIA-PET data from MCF-7 cells
processed by ENCODE. We subdivided the NR2F2 and ERα binding sites into three groups (≥2, 1 or 0
loops) based on overlaps with numbers of ERα chromatin interactions (loops). Both ERα and NR2F2
with high-frequency ERα-bound loops showed significantly higher binding intensities (p < 0.0001 with
Mann-Whitney test) than binding sites with one interaction or without interaction (Figure 4C). To gain
insights into the role of NR2F2 at ERα-bound super-enhancers, we compared the ratio of mother
and daughter regions of ERα-bound SEs with NR2F2 binding sites and ERα mediated interactions.
Our results showed that the mother regions overlap to a greater extent with the NR2F2 binding sites
correlated with ERα-mediated chromatin interactions than the daughter regions (63.2% of mother
regions vs. 11.44% of daughter regions) (Figure 4D). Overall, our results demonstrate that NR2F2
with high-frequency ERα-mediated chromatin interactions is enriched mostly at mother regions of
ERα-bound SEs to become a major contributor to the formation of ERα-bound super-enhancers.

2.5. NR2F2 Is Involved in ERα-Mediated Gene Expression in Breast Cancer Cells
      To examine the regulation of gene expression by NR2F2 in luminal A breast cancer cells, we depleted
NR2F2 using the lentiviral shRNA approach and then performed mRNA sequencing. After shRNA
treatment, the level of NR2F2 mRNA was decreased in MCF-7 and T47D cells measured by RT-qPCR
(Figure S3). We identified the differentially expressed genes in NR2F2 depleted MCF-7 cells compared
to the control (shCTRL) treated MCF-7 cells using edgeR. We used those genes that are associated
with NR2F2 binding sites based on ChIP-seq data. Thus, we identified 388 downregulated and 524
upregulated genes using statistical significance at the fold change (FC) >|1.5| and the false discovery
rate (FDR)
Int. J. Mol. Sci. 2020, 21, 1910 7 of 15
Int. J. Mol. Sci. 2020, 21, x FOR PEER REVIEW 7 of 15
Figure 4. NR2F2 binds to mother regions of ERα super-enhancers (SE) in MCF-7 breast cancer cells.
Figure 4. NR2F2 binds to mother regions of ERα super-enhancers (SE) in MCF-7 breast cancer cells.
(A) IGV screenshot shows that NR2F2 and ERα binding sites marked the mother and daughter regions of
(A) IGV screenshot shows that NR2F2 and ERα binding sites marked the mother and daughter
ERα SE with ERα bound chromatin interactions at WWC1 gene. (B) Box plots show the ERα and NR2F2
regions of ERα SE with ERα bound chromatin interactions at WWC1 gene. (B) Box plots show the
binding intensities on mother and daughter regions of ERα SE. Mann-Whitney test, **** significant
ERα and NR2F2 binding intensities on mother and daughter regions of ERα SE. Mann-Whitney test,
at p < 0.0001. (C) Box plots show the ERα and NR2F2 binding intensities on anchor regions of ERα
**** significant at p < 0.0001. (C) Box plots show the ERα and NR2F2 binding intensities on anchor
bound chromatin
regions of ERαinteractions basedinteractions
bound chromatin on numberbased
of interactions.
on number Mann-Whitney test, at p
test, **** significant
of interactions. Mann-Whitney
< 0.0001. (D) Pie charts
**** significant at pInt. J. Mol. Sci. 2020, 21, 1910 8 of 15
Int. J. Mol. Sci. 2020, 21, x FOR PEER REVIEW 8 of 15
Figure 5. NR2F2 regulated transcriptional programs in breast cancer cells with luminal A subtype.
Figure 5. NR2F2 regulated transcriptional programs in breast cancer cells with luminal A subtype.
(A) RNA-seq heatmap shows the clusters of differentially expressed genes in NR2F2 silenced MCF-7 cells
(A) RNA-seq heatmap shows the clusters of differentially expressed genes in NR2F2 silenced MCF-7
using specific shRNA
cells using (shNR2F2).
specific shRNA (B) RT-qPCR
(shNR2F2). (B)validation
RT-qPCR shows specific
validation showsdifferentially expressed genes
specific differentially
in MCF-7 cells. (C)
expressed Gene
genes set enrichment
in MCF-7 analysis
cells. (C) Gene (GSEA) analysis
set enrichment shows the gene
(GSEA) sets the
shows thatgene
weresetssignificantly
that
enriched were
in significantly
NR2F2 silenced enriched in NR2F2
MCF-7 silenced
cells. NES,MCF-7 cells. NES,
normalized normalized score.
enrichment enrichment
(D) score.
GSEA(D)plots for
specific GSEA
gene plots
sets. for
(E)specific
RNA-seq geneheatmap
sets. (E) RNA-seq
shows heatmap shows the
the expression expression
levels levels
of genes of genes
related torelated
ERα SE with
to ERα SE with NR2F2 binding on mother regions in control (shCTRL) and shNR2F2 treated MCF-7
NR2F2 binding on mother regions in control (shCTRL) and shNR2F2 treated MCF-7 cells. (F) IGV
screenshot shows that NR2F2 and ERα binding sites marked the mother and daughter regions of ERα
SE with ERα bound loops at the EGR3 gene.
3. Discussion
Numerous studies have examined the role of NR2F2 in breast cancer cells and patients; however,
its function has still not been clarified. In our paper, we demonstrated that breast cancer patients withInt. J. Mol. Sci. 2020, 21, 1910 9 of 15
the luminal A subtype who have a high NR2F2 expression show better survival. Here, we examined the
regulatory mechanisms by NR2F2 in luminal A breast cancer cells on the genome level to investigate
its role in the ERα regulatory complex.
Our results suggest that the high level of NR2F2 expression shows better survival in luminal
A patients, and within that, ILC patients show a higher NR2F2 expression level than IDC patients.
In the two carcinomas with a different histological origin, the survival of patients is very similar;
however, the response of ILC patients to the therapy differs, despite the fact that both are ER-positive
breast cancers [31]. This suggests that NR2F2 forms such an interaction with ERα that affects the
therapeutic response.
There is increasing evidence that NR2F2 plays some kind of a role in the progression of breast
cancer. Nagasaki et al. have shown that of the 119 breast cancer patients, 59% were NR2F2 positive
for immunohistochemical staining, and the positive cases correlate with a bad clinical outcome and
ER-positive status [32]. However, Zhang has found the opposite, claiming that the high expression of
NR2F2 shows better overall and disease-free survival in breast cancer patients [7]. To clarify this issue,
we performed a Kaplan-Meier analysis using a database collecting the gene expression and survival
data of thousands of breast cancer patients [33]. Our results correlate with those of Zhang, in that
the high expression of NR2F2 shows better survival; however, we have found that this is true only
in ER-positive breast cancer patients, and in the case of ER-negative patients there is no difference in
survival between the high and low expressions of NR2F2.
NR2F2, as a nuclear receptor, affects the transcription activity of numerous genes; however, its
genome-wide distribution is not known in cancerous cells. Here, we mapped the NR2F2 binding sites
genome-wide, using ChIP-seq data derived from luminal A breast cancer cells. The vast majority
of NR2F2 binding sites show overlaps with ERα binding sites correlated with histone modifications
(H3K27ac and H3K4me1), which are specific markers for the active enhancer regions. In our previous
study, a greater extent of overlap has been demonstrated between NR2F2 and ERα binding sites [34].
Mohammed et al. have identified various ERα-associated proteins, including NR2F2, with the rapid
immunoprecipitation mass spectrometry of endogenous proteins RIME method [35]. Previous studies
have shown that some ERα co-factors such as FOXA1 and GATA3 act as pioneer factors in facilitating
the ERα binding to chromatin [16,18]. Thus, these co-factors play an essential role in the ERα-mediated
regulatory complex. Here, we showed that NR2F2 is co-occupied with ERα and its co-factors (FOXA1
and GATA3). These findings were confirmed by a recent study [36]. Rosenfeld et al. have identified
that other nuclear receptors also bind to ERα MegaTrans complexes in a ligand-dependent manner
via protein-protein interaction. For example, estrogen treatment causes interactions with RARα or
RARγ [37], while adding estrogen to dexamethasone, a glucocorticoid receptor (GR) agonist, replaces
RAR with sumoylated GR [38]. Sumoylated GR binds a co-repressor complex, thereby inhibiting
ERα-dependent gene expression and enhancer activity [38]. Other studies have described interactions
between other nuclear receptors such as PR, AR and LRH-1, capable of interacting with ERα in breast
cancer [39–42]. We suppose a similar interaction between ERα and NR2F2 stimulated by a different
signaling pathway. However, in the ChIP-Seq method, due to the high cell number, it is difficult
to specify exactly which are the protein-protein interactions or competitions for nuclear receptor
binding sites.
Super-enhancers represent a highly-organized transcriptional unit in gene expression [19].
The super-enhancers are correlated with a high density of transcription factors [20]. Here, we
show that NR2F2 co-binds to high enriched ERα, FOXA1 and GATA3 binding sites. This result assumes
the formation of a regulatory complex similar to super-enhancers. Based on previous results of our
group, it means that mother and daughter enhancer regions play an important role in ERα–bound
super-enhancer formation [22]. ERα at mother regions was pre-recruited before estradiol treatment.
After estradiol treatment around the mother regions, ERα binds to daughter regions of super-enhancers.
Therefore, we investigated the presence of NR2F2 at these super-enhancer regions. Our results
demonstrate that NR2F2 with high-frequency ERα-mediated chromatin interactions binds to motherInt. J. Mol. Sci. 2020, 21, 1910 10 of 15
regions of ERα-bound super-enhancers without any treatment. Altogether, NR2F2 can contribute to
the formation of ERα-bound super-enhancers.
Finally, the transcriptome profiling of NR2F2 depleted ER-positive breast cancer cells showed that
NR2F2 plays a role in the expression of genes regulating cell cycle and that of estrogen responsive genes.
Jiang et al. also found that NR2F2 silencing alters the expression of genes involved in the cell cycle [36].
Furthermore, Nakshatri et al. reported that NR2F2 plays an important role in cell cycle regulation
in certain breast cancer cells by delaying the transition between late S and G2/M via regulation of
cdk2 and cyclin D1 [43]. We investigated the changes in the expression of genes related to ERα-bound
super-enhancers. This result confirmed that NR2F2 regulates the expression of the ERα target genes.
In summary, these findings suggest a functional role of NR2F2 in ERα-mediated gene expression.
In our study, we performed NR2F2 and ERα ChIP-Seq from luminal A breast cancer cell lines.
To investigate the effect of NR2F2 on gene expression, we performed RNA-Seq from NR2F2-depleted
breast cancer cells. Based on these methods, our results showed that NR2F2 is present in ERα-mediated
transcriptional regulation. Our findings suppose two mechanisms of interaction between these
nuclear receptors: 1) protein-protein interactions within the same regulatory complex or 2) NR2F2 can
compete for ERα binding sites. Further investigations are needed to study the contribution of direct
NR2F2:DNA binding to the modulation of ERα-dependent transcription in breast cancer cells, such as
generating breast cancer cells with mutant DNA-binding domain of NR2F2 and the assessment of the
transcriptional effect of such NR2F2 mutants.
4. Materials and Methods
4.1. Cell Culture, Treatment
MCF-7 cells obtained from ECACC were cultured in DMEM media supplemented with 10% FBS,
1% penicillin-streptomycin in a 5% CO2 incubator. T47D cells were cultured in RPMI-1640 media
supplemented with 10% FBS, 1% penicillin-streptomycin in a 5% CO2 incubator. The cells were hormone
stripped for 3 days in phenol-free media with 10% charcoal-stripped FBS and 1% penicillin-streptomycin
before treatment. After hormone deprivation, the cells were treated with 100 nM 17β-estradiol or 1 µM
tamoxifen for 1 h. Absolute ethanol was used as control vehicle.
4.2. Gene Silencing
NR2F2 silenced MCF-7 and T47D cells were produced using Sigma MISSION® Lentiviral
Transduction Particles (NM_000125, TRCN0000003300) and Sigma MISSION® pLKO.1-puro Non-Target
shRNA Control Lentiviral Transduction Particles (SHC016V-1EA) according to the manufacturer’s
instructions. Briefly, 2.5 × 10⁵ cells were transduced with the lentiviral particles at a MOI = 5,
with 5 µg/mL polybrene, and then, were selected with 2 µg/mL puromycin for 14–17 days.
4.3. RT-qPCR and RNA-Sequencing
RNA was isolated using TRIzolate (UD-Genomed URN0102) and total RNA was reverse
transcribed using SuperScript III Reverse Transcriptase (ThermoFisher, Budapest, Hungary, 18064071).
qPCRs were performed with SYBR Green Master Mix (Roche 4887352001) and gene-specific primers
on a QuantStudio 12K Flex Real-Time PCR System (Applied Biosystems by ThermoFisher, Budapest,
Hungary). Transcript levels were normalized to ACTB. Sequences of primers can be found in Table S1.
Library preparation and sequencing were performed using Illumina’s TruSeq RNA Sample
Preparation version 2 by the Genomic Medicine and Bioinformatics Core Facility at the University of
Debrecen, Debrecen, Hungary.
4.4. ChIP-Seq
20 million breast cancer cells (MCF-7 and T47D) were crosslinked with 1% methanol-free
formaldehyde (Thermo Fisher Scientific, 28908) for 10 min at room temperature (RT). FormaldehydeInt. J. Mol. Sci. 2020, 21, 1910 11 of 15
was quenched using 0.125 M glycine for 5 min at RT and then cells were rinsed twice with ice-cold PBS.
The cells were scraped up in 1 mL ChIP Lysis Buffer (1% Triton-X, 0.1% SDS, 150 mM NaCl, 1 mM
EDTA, 20 mM Tris-HCl) and were centrifuged at high-speed. Nuclei were resuspended three times in
ChIP Lysis Buffer. Sonication was performed in ChIP Lysis Buffer using a Bioruptor Plus Sonicator
(Diagenode) 15 cycles (30 s on and 30 s off) at high intensity. After high-speed centrifugation the
top 90% of sheared chromatin was diluted ten-fold with ChIP Lysis Buffer for immunoprecipitations.
The following antibodies were used for immunoprecipitation overnight at 4 ◦ C: ERα (sc-543X, 8 µg),
NR2F2 (sc-271265X, 8 µg) and isotype control antibody (sc-2027 X, 8 µg). After centrifugation, the top
90% of supernatant were used for bead coupling. Antibody-chromatin-bead complex was incubated
using pre-blocked Protein A-Protein G paramagnetic bead mix (1:1 ratio) (Thermo Fisher Scientific, cat.
10002D and 10004D) for 6 h at 4 ◦ C. After the incubation, the captured beads were washed once with
ChIP Wash Buffer 1 (1% Triton-X, 0.1% SDS, 150 mM NaCl, 1mM EDTA, 20 mM Tris-HCl, 0.1% NaDOC,
Protease Inhibitor), twice with ChIP Wash Buffer 2 (1% Triton-X, 0.1% SDS, 500 mM NaCl, 1mM EDTA,
20 mM Tris-HCl, 0.1% NaDOC, Protease Inhibitor), once with ChIP Wash Buffer 3 (0.5% NP-40, 250
mM LiCl, 1mM EDTA, 20 mM Tris-HCl, 0.5% NaDOC, Protease Inhibitor) and twice with ChIP Wash
Buffer 4 (200 mM Tris-HCl, 10 mM EDTA) using a magnetic rack. Antibody-chromatin-complex was
eluted with 200 µL Bead Elution Buffer (1% SDS and 100 mM NaHCO3 ), and reverse crosslinking was
carried out by adding 400 mM NaCl and incubating overnight at 65 ◦ C. The samples were treated with
10 µg RNase and 20 µg Proteinase K. Immunoprecipitated DNA was purified using Qiagen’s MinElute
PCR purification kit (cat. 28006).
Library preparation and sequencing were performed using Illumina’s TruSeq ChIP Sample
Preparation by the Genomic Medicine and Bioinformatics Core Facility at the University of Debrecen,
Debrecen, Hungary. Data is available in NCBI BioProject PRJNA602619.
Co-regulators and histones raw ChIP-seq data and processed ERα ChIA-PET data were
downloaded from the Encyclopedia of DNA Elements (ENCODE) datasets [44,45] or Sequence Read
Archive (SRA) datasets. Data is available with the following numbers: ENCSR752UOD (H3K27ac),
ENCSR985MIB (H3K4me3), ENCSR493NBY (H3K4me1), ENCSR000EWS (GATA3), ENCSR000AHD
(CTCF), GSM2137769 (FOXA1) and ENCSR000BZZ (processed ERα ChIA-PET).
4.5. Data Processing of ChIP-Seq and RNA-Seq
ChIP-Seq data were analyzed by a published computational pipeline [46]. Two biological replicates
were merged and aligned to an hg19 reference dataset. Bam files were filtered out from duplicate reads
and under quality number 20 using samtools [47]. Peaks were called using HMCan [13]. Artifact peak
list was downloaded from the Encyclopedia of DNA Elements (ENCODE) and was removed from our
peak sets.
Overlap regions were determined using diffBind, a Bioconductor package in R. Proportional Venn
diagrams were visualized by BioVenn [48].
Motif enrichment analyses were performed using Homer software with findMotifsGenome.pl
command. The size parameter was 100 bp. Tag density values were calculated based on summits of
peaks flanking with ±500 base pair region for histograms and with ±1000 base pair region for heatmaps
using Homer software with annotatePeaks.pl command options. Annotation was performed using
Homer software with annotatePeaks.pl command.
Reads per kilobase per million mapped reads (RPKM) values were calculated on the summit
±50 bp region of the peaks. Regions of mother and daughter of ERα super-enhancers were determined
by Bojcsuk et al. [22]. Loop numbers were evaluated using intersectBed between ERα or NR2F2
binding sites and anchor regions of ERα loops [49].
RNA-Seq data were aligned to an hg19 reference dataset using TopHat v2.1.1 [50]. Transcript
abundances were calculated using featureCounts, and differentially expressed genes (FDR < 0.01,
FC > |0.5|) were determined using edgeR [51,52]. Heatmaps were generated using the R pheatmapInt. J. Mol. Sci. 2020, 21, 1910 12 of 15
package. Gene Set Enrichment Analysis (GSEA) was performed to evaluate which gene sets were
correlated with our differentially expressed genes with FDR < 0.25 using GSEA v3 software [53].
4.6. Data for Breast Cancer Patients
In case of breast cancer patients, mRNA z-scores data were derived from The Cancer Genome
Atlas (TCGA) [54]. TCGA data were downloaded using the cBioPortal. Survival data were derived
from KMPlotter [33].
4.7. Visualization
Heatmaps for ChIP-seq data were created using the Java TreeView software [55]. Plots were
created using GraphPad prism software or R ggplot2.
4.8. Statistical Methods
Statistical analyses were performed with GraphPad prism software version 6. The Shapiro-Wilk
test was used to test the normality distribution of data. Data were nonparametric distributed; we used
the Mann-Whitney test. p-value significance was indicated with: * p < 0.05, ** p < 0.01, *** p < 0.001,
**** p < 0.0001. For the Kaplan-Meier analysis, a Mantel-Cox test was used with significance at logrank
p < 0.05.
5. Conclusions
In our paper, we demonstrated the presence of NR2F2 in regulation by ERα in breast cancer cells.
Our results showed that high NR2F2 expression is correlated with better survival in luminal A breast
cancer patients only. This result suggested the importance of NR2F2 in the ERα regulatory complex.
We found high NR2F2 binding intensities with ERα co-bound by FOXA1 and GATA3 co-factors at
active enhancer regions. NR2F2 overlaps with high-frequency ERα chromatin interactions within
ERα-bound super-enhancers and plays a role in the expression of ERα target genes. Our results suggest
that NR2F2 may play an important role in the survival and treatment of breast cancer patients with an
ER-positive subtype.
Supplementary Materials: Supplementary materials can be found at http://www.mdpi.com/1422-0067/21/6/
1910/s1. Figure S1: COUP-TFII and ER binding sites in T47D cells. (A) Proportional Venn diagram shows the
overlapping regions between ER and COUP-TFII. (B) IGV screenshot shows the ER and COUP-TFII binding sites
at ER target genes in MCF-7 and T47D cells. (C) Histograms represent the ER and COUP-TFII tag density around
shared and individual binding sites in T47D cells. Figure S2: IGV screenshot shows NR2F2 and ERα binding sites
marked the mother and daughter regions of ERα SE, with ERα bound chromatin interactions at (A) JARID2 and
(B) SIAH2 gene. Figure S3: mRNA level of COUP-TFII in MCF-7 and T47D followed by silencing using specific
shRNA against COUP-TFII. Table S1: Sequences of primers.
Author Contributions: Conceptualization, E.E. and B.L.B.; methodology, E.E.; software, E.E.; validation, E.E.;
formal analysis, E.E.; writing—original draft preparation, E.E.; writing—review and editing, B.L.B.; visualization,
E.E.; supervision, B.L.B. All authors have read and agreed to the published version of the manuscript.
Funding: This work was supported by the University of Debrecen within the program ‘Internal Research Grant of
the Research University’ under the title ‘Dissecting the genetic and epigenetic components of gene expression
regulation in the context of the 1000 genomes project’, as well as the Bridging Fund of the Medical Faculty of the
University of Debrecen and through the internal research funding provided by the Department of Biochemistry
and Molecular Biology. This work was also supported by MOLMEDEX FUN-OMICS (GINOP-2.3.3-15-2016-00007)
and Debrecen Venture Catapult Program (EFOP-3.6.1-16-2016-00022) grants implemented through the New
Hungary Development Plan co-financed by the European Social Fund and the European Regional Development
Fund. This work was also supported by the Hungarian Scientific Research Fund (OTKA) K 129166. B.L.B. was
a Szodoray Fellow of the University of Debrecen, Faculty of Medicine and an alumnus of the Magyary Zoltan
fellowship supported by the TAMOP 4.2.4.A/2-11-1-2012-0001 grant implemented through the New Hungary
Development Plan co-financed by the European Social Fund and the European Regional Development Fund.
Acknowledgments: We thank Dóra Bojcsuk, Lilla Ozgyin and Noura Faraj for their participation in helpful
discussions. We thank Balázs Venkovits at the Institute of English and American Studies, University of Debrecen,
Hungary for language editing and proofreading the manuscript. The authors acknowledge the support of ELIXIR
Hungary (www.elixir-hungary.org).Int. J. Mol. Sci. 2020, 21, 1910 13 of 15
Conflicts of Interest: The authors declare no conflict of interest.
Abbreviations
NR2F2 Nuclear Receptor Subfamily 2 Group F Member 2
ERα Estrogen receptor alpha
SE Super-enhancer
References
1. Bray, F.; Ferlay, J.; Soerjomataram, I.; Siegel, R.L.; Torre, L.A.; Jemal, A. Global cancer statistics 2018:
GLOBOCAN estimates of incidence and mortality worldwide for 36 cancers in 185 countries. CA Cancer J.
Clin. 2018, 68, 394–424. [CrossRef] [PubMed]
2. Klinge, C.M. Estrogen receptor interaction with co-activators and co-repressors. Steroids 2000, 65, 227–251.
[CrossRef]
3. Manavathi, B.; Samanthapudi, V.S.K.; Gajulapalli, V.N.R. Estrogen receptor coregulators and pioneer factors:
The orchestrators of mammary gland cell fate and development. Front. Cell Dev. Biol. 2014, 2. [CrossRef]
[PubMed]
4. Wang, L.H.; Tsai, S.Y.; Cook, R.G.; Beattie, W.G.; Tsai, M.J.; O’Malley, B.W. COUP transcription factor is a
member of the steroid receptor superfamily. Nature 1989, 340, 163–166. [CrossRef]
5. Boudot, A.; Le Dily, F.; Pakdel, F. Involvement of COUP-TFs in Cancer Progression. Cancers 2011, 3, 700–715.
[CrossRef]
6. Xu, M.; Qin, J.; Tsai, S.Y.; Tsai, M.J. The role of the orphan nuclear receptor COUP-TFII in tumorigenesis.
Acta Pharmacol. Sin. 2015, 36, 32–36. [CrossRef]
7. Zhang, C.; Han, Y.; Huang, H.; Qu, L.; Shou, C. High NR2F2 transcript level is associated with increased
survival and its expression inhibits TGF-β-dependent epithelial-mesenchymal transition in breast cancer.
Breast Cancer Res. Treat. 2014, 147, 265–281. [CrossRef]
8. Riggs, K.A.; Wickramasinghe, N.S.; Cochrum, R.K.; Watts, M.B.; Klinge, C.M. Decreased chicken ovalbumin
upstream promoter transcription factor II expression in tamoxifen-resistant breast cancer cells. Cancer Res.
2006, 66, 10188–10198. [CrossRef]
9. Wu, S.P.; Kao, C.Y.; Wang, L.; Creighton, C.J.; Yang, J.; Donti, T.R.; Harmancey, R.; Vasquez, H.G.; Graham, B.H.;
Bellen, H.J.; et al. Increased COUP-TFII expression in adult hearts induces mitochondrial dysfunction
resulting in heart failure. Nat. Commun. 2015, 6. [CrossRef]
10. Churko, J.M.; Garg, P.; Treutlein, B.; Venkatasubramanian, M.; Wu, H.; Lee, J.; Wessells, Q.N.; Chen, S.Y.;
Chen, W.Y.; Chetal, K.; et al. Defining human cardiac transcription factor hierarchies using integrated
single-cell heterogeneity analysis. Nat. Commun. 2018, 9. [CrossRef]
11. Wu, S.P.; Yu, C.T.; Tsai, S.Y.; Tsai, M.J. Choose your destiny: Make a cell fate decision with COUP-TFII.
J. Steroid Biochem. Mol. Biol. 2016, 157, 7–12. [CrossRef] [PubMed]
12. Schwach, V.; Verkerk, A.O.; Mol, M.; Monshouwer-Kloots, J.J.; Devalla, H.D.; Orlova, V.V.; Anastassiadis, K.;
Mummery, C.L.; Davis, R.P.; Passier, R. A COUP-TFII Human Embryonic Stem Cell Reporter Line to Identify
and Select Atrial Cardiomyocytes. Stem Cell Rep. 2017, 9, 1765–1779. [CrossRef] [PubMed]
13. Ashoor, H.; Hérault, A.; Kamoun, A.; Radvanyi, F.; Bajic, V.B.; Barillot, E.; Boeva, V. HMCan: A method for
detecting chromatin modifications in cancer samples using ChIP-seq data. Bioinformatics 2013, 29, 2979–2986.
[CrossRef] [PubMed]
14. Carroll, J.S.; Liu, X.S.; Brodsky, A.S.; Li, W.; Meyer, C.A.; Szary, A.J.; Eeckhoute, J.; Shao, W.; Hestermann, E.V.;
Geistlinger, T.R.; et al. Chromosome-wide mapping of estrogen receptor binding reveals long-range
regulation requiring the forkhead protein FoxA1. Cell 2005, 122, 33–43. [CrossRef] [PubMed]
15. Hurtado, A.; Holmes, K.A.; Ross-Innes, C.S.; Schmidt, D.; Carroll, J.S. FOXA1 is a key determinant of estrogen
receptor function and endocrine response. Nat. Genet. 2011, 43, 27–33. [CrossRef] [PubMed]
16. Theodorou, V.; Stark, R.; Menon, S.; Carroll, J.S. GATA3 acts upstream of FOXA1 in mediating ESR1 binding
by shaping enhancer accessibility. Genome Res. 2013, 23, 12–22. [CrossRef]
17. Kong, S.L.; Li, G.; Loh, S.L.; Sung, W.K.; Liu, E.T. Cellular reprogramming by the conjoint action of ERα,
FOXA1, and GATA3 to a ligand-inducible growth state. Mol. Syst. Biol. 2011, 7. [CrossRef]Int. J. Mol. Sci. 2020, 21, 1910 14 of 15
18. Magnani, L.; Lupien, M. Chromatin and epigenetic determinants of estrogen receptor alpha (ESR1) signaling.
Mol. Cell. Endocrinol. 2014, 382, 633–641. [CrossRef]
19. Whyte, W.A.; Orlando, D.A.; Hnisz, D.; Abraham, B.J.; Lin, C.Y.; Kagey, M.H.; Rahl, P.B.; Lee, T.I.; Young, R.A.
Master transcription factors and mediator establish super-enhancers at key cell identity genes. Cell 2013, 153,
307–319. [CrossRef]
20. Hnisz, D.; Abraham, B.J.; Lee, T.I.; Lau, A.; Saint-André, V.; Sigova, A.A.; Hoke, H.A.; Young, R.A.
Super-enhancers in the control of cell identity and disease. Cell 2013, 155, 934–947. [CrossRef]
21. Fullwood, M.J.; Liu, M.H.; Pan, Y.F.; Liu, J.; Xu, H.; Mohamed, Y.B.; Orlov, Y.L.; Velkov, S.; Ho, A.; Mei, P.H.;
et al. An oestrogen-receptor-α-bound human chromatin interactome. Nature 2009, 462, 58–64. [CrossRef]
[PubMed]
22. Bojcsuk, D.; Nagy, G.; Balint, B.L. Inducible super-enhancers are organized based on canonical signal-specific
transcription factor binding elements. Nucleic Acids Res. 2017, 45, 3693–3706. [CrossRef] [PubMed]
23. Huang, J.; Li, K.; Cai, W.; Liu, X.; Zhang, Y.; Orkin, S.H.; Xu, J.; Yuan, G.C. Dissecting super-enhancer
hierarchy based on chromatin interactions. Nat. Commun. 2018, 9. [CrossRef] [PubMed]
24. Cao, F.; Fang, Y.; Tan, H.K.; Goh, Y.; Choy, J.Y.H.; Koh, B.T.H.; Hao Tan, J.; Bertin, N.; Ramadass, A.;
Hunter, E.; et al. Super-enhancers and broad h3k4me3 domains form complex gene regulatory circuits
involving chromatin interactions. Sci. Rep. 2017, 7. [CrossRef] [PubMed]
25. Thibodeau, A.; Márquez, E.J.; Shin, D.G.; Vera-Licona, P.; Ucar, D. Chromatin interaction networks revealed
unique connectivity patterns of broad H3K4me3 domains and super enhancers in 3D chromatin. Sci. Rep.
2017, 7. [CrossRef] [PubMed]
26. Fischer, M.; Grossmann, P.; Padi, M.; DeCaprio, J.A. Integration of TP53, DREAM, MMB-FOXM1 and RB-E2F
target gene analyses identifies cell cycle gene regulatory networks. Nucleic Acids Res. 2016, 44, 6070–6086.
[CrossRef]
27. Creighton, C.J.; Massarweh, S.; Huang, S.; Tsimelzon, A.; Hilsenbeck, S.G.; Osborne, C.K.; Shou, J.; Malorni, L.;
Schiff, R. Development of resistance to targeted therapies transforms the clinically associated molecular
profile subtype of breast tumor xenografts. Cancer Res. 2008, 68, 7493–7501. [CrossRef]
28. Massarweh, S.; Osborne, C.K.; Creighton, C.J.; Qin, L.; Tsimelzon, A.; Huang, S.; Weiss, H.; Rimawi, M.;
Schiff, R. Tamoxifen resistance in breast tumors is driven by growth factor receptor signaling with repression
of classic estrogen receptor genomic function. Cancer Res. 2008, 68, 826–833. [CrossRef]
29. Doane, A.S.; Danso, M.; Lal, P.; Donaton, M.; Zhang, L.; Hudis, C.; Gerald, W.L. An estrogen receptor-negative
breast cancer subset characterized by a hormonally regulated transcriptional program and response to
androgen. Oncogene 2006, 25, 3994–4008. [CrossRef]
30. Van’t Veer, L.J.; Dai, H.; Van de Vijver, M.J.; He, Y.D.; Hart, A.A.M.; Mao, M.; Peterse, H.L.; Van Der Kooy, K.;
Marton, M.J.; Witteveen, A.T.; et al. Gene expression profiling predicts clinical outcome of breast cancer.
Nature 2002, 415, 530–536. [CrossRef]
31. Du, T.; Zhu, L.; Levine, K.M.; Tasdemir, N.; Lee, A.V.; Vignali, D.A.A.; Van Houten, B.; Tseng, G.C.;
Oesterreich, S. Invasive lobular and ductal breast carcinoma differ in immune response, protein translation
efficiency and metabolism. Sci. Rep. 2018, 8. [CrossRef] [PubMed]
32. Nagasaki, S.; Suzuki, T.; Miki, Y.; Akahira, J.; Shibata, H.; Ishida, T.; Ohuchi, N.; Sasano, H. Chicken
ovalbumin upstream promoter transcription factor II in human breast carcinoma: Possible regulator of
lymphangiogenesis via vascular endothelial growth factor-C expression. Cancer Sci. 2009, 100, 639–645.
[CrossRef] [PubMed]
33. Györffy, B.; Lanczky, A.; Eklund, A.C.; Denkert, C.; Budczies, J.; Li, Q.; Szallasi, Z. An online survival analysis
tool to rapidly assess the effect of 22,277 genes on breast cancer prognosis using microarray data of 1809
patients. Breast Cancer Res. Treat. 2010, 123, 725–731. [CrossRef] [PubMed]
34. Erdős, E.; Bálint, B.L. COUP-TFII is a modulator of cell-type-specific genetic programs based on genomic
localization maps. J. Biotechnol. 2019, 301, 11–17. [CrossRef] [PubMed]
35. Mohammed, H.; D’Santos, C.; Serandour, A.A.; Ali, H.R.; Brown, G.D.; Atkins, A.; Rueda, O.M.; Holmes, K.A.;
Theodorou, V.; Robinson, J.L.L.; et al. Endogenous Purification Reveals GREB1 as a Key Estrogen Receptor
Regulatory Factor. Cell Rep. 2013, 3, 342–349. [CrossRef]
36. Jiang, G.; Wang, X.; Sheng, D.; Zhou, L.; Liu, Y.; Xu, C.; Liu, S.; Zhang, J. Cooperativity of co-factor NR2F2
with pioneer factors GATA3, FOXA1 in promoting ERα function. Theranostics 2019, 9, 6501–6516. [CrossRef]Int. J. Mol. Sci. 2020, 21, 1910 15 of 15
37. Liu, Z.; Merkurjev, D.; Yang, F.; Li, W.; Oh, S.; Friedman, M.J.; Song, X.; Zhang, F.; Ma, Q.; Ohgi, K.A.; et al.
Enhancer activation requires trans-recruitment of a mega transcription factor complex. Cell 2014, 159, 358–373.
[CrossRef]
38. Yang, F.; Ma, Q.; Liu, Z.; Li, W.; Tan, Y.; Jin, C.; Ma, W.; Hu, Y.; Shen, J.; Ohgi, K.A.; et al. Glucocorticoid
Receptor: MegaTrans Switching Mediates the Repression of an ERα-Regulated Transcriptional Program.
Mol. Cell 2017, 66, 321–331.e6. [CrossRef]
39. Severson, T.M.; Kim, Y.; Joosten, S.E.P.; Schuurman, K.; Van Der Groep, P.; Moelans, C.B.; Ter Hoeve, N.D.;
Manson, Q.F.; Martens, J.W.; Van Deurzen, C.H.M.; et al. Characterizing steroid hormone receptor chromatin
binding landscapes in male and female breast cancer. Nat. Commun. 2018, 9, 482. [CrossRef]
40. Bianco, S.; Brunelle, M.; Jangal, M.; Magnani, L.; Gévry, N. LRH-1 governs vital transcriptional programs in
endocrine-sensitive and -resistant breast cancer cells. Cancer Res. 2014, 74, 2015–2025. [CrossRef]
41. Truong, T.H.; Lange, C.A. Deciphering Steroid Receptor Crosstalk in Hormone-Driven Cancers. Endocrinology
2018, 159, 3897–3907. [CrossRef] [PubMed]
42. Siersbæk, R.; Kumar, S.; Carroll, J.S. Signaling pathways and steroid receptors modulating estrogen receptor
α function in breast cancer. Genes Dev. 2018, 32, 1141–1154. [CrossRef] [PubMed]
43. Nakshatri, H.; Mendonca, M.S.; Bhat-Nakshatri, P.; Patel, N.M.; Goulet, R.J.; Cornetta, K. The orphan receptor
COUP-TFII regulates G2/M progression of breast cancer cells by modulating the expression/activity of
p21(WAF1/CIP1), cyclin D1, and cdk2. Biochem. Biophys. Res. Commun. 2000, 270, 1144–1153. [CrossRef]
[PubMed]
44. Dunham, I.; Kundaje, A.; Aldred, S.F.; Collins, P.J.; Davis, C.A.; Doyle, F.; Epstein, C.B.; Frietze, S.; Harrow, J.;
Kaul, R.; et al. An integrated encyclopedia of DNA elements in the human genome. Nature 2012, 489, 57–74.
45. Sloan, C.A.; Chan, E.T.; Davidson, J.M.; Malladi, V.S.; Strattan, J.S.; Hitz, B.C.; Gabdank, I.; Narayanan, A.K.;
Ho, M.; Lee, B.T.; et al. ENCODE data at the ENCODE portal. Nucleic Acids Res. 2016, 44, D726–D732.
[CrossRef] [PubMed]
46. Barta, E. Command line analysis of ChIP-seq results. EMB Net. J. 2011, 17, 13–17. [CrossRef]
47. Li, H.; Handsaker, B.; Wysoker, A.; Fennell, T.; Ruan, J.; Homer, N.; Marth, G.; Abecasis, G.; Durbin, R. The
Sequence Alignment/Map format and SAMtools. Bioinformatics 2009, 25, 2078–2079. [CrossRef]
48. Hulsen, T.; de Vlieg, J.; Alkema, W. BioVenn—A web application for the comparison and visualization of
biological lists using area-proportional Venn diagrams. BMC Genomics 2008, 9, 488. [CrossRef]
49. Quinlan, A.R.; Hall, I.M. BEDTools: A flexible suite of utilities for comparing genomic features. Bioinformatics
2010, 26, 841–842. [CrossRef]
50. Trapnell, C.; Pachter, L.; Salzberg, S.L. TopHat: Discovering splice junctions with RNA-Seq. Bioinformatics
2009, 25, 1105–1111. [CrossRef]
51. Liao, Y.; Smyth, G.K.; Shi, W. FeatureCounts: An efficient general purpose program for assigning sequence
reads to genomic features. Bioinformatics 2014, 30, 923–930. [CrossRef] [PubMed]
52. Robinson, M.D.; McCarthy, D.J.; Smyth, G.K. edgeR: A Bioconductor package for differential expression
analysis of digital gene expression data. Bioinformatics 2009, 26, 139–140. [CrossRef] [PubMed]
53. Subramanian, A.; Tamayo, P.; Mootha, V.K.; Mukherjee, S.; Ebert, B.L.; Gillette, M.A.; Paulovich, A.;
Pomeroy, S.L.; Golub, T.R.; Lander, E.S.; et al. Gene set enrichment analysis: A knowledge-based approach
for interpreting genome-wide expression profiles. Proc. Natl. Acad. Sci. USA 2005, 102, 15545–15550.
[CrossRef] [PubMed]
54. Ciriello, G.; Gatza, M.L.; Beck, A.H.; Wilkerson, M.D.; Rhie, S.K.; Pastore, A.; Zhang, H.; McLellan, M.;
Yau, C.; Kandoth, C.; et al. Comprehensive Molecular Portraits of Invasive Lobular Breast Cancer. Cell 2015,
163, 506–519. [CrossRef]
55. Saldanha, A.J. Java Treeview—Extensible visualization of microarray data. Bioinformatics 2004, 20, 3246–3248.
[CrossRef]
© 2020 by the authors. Licensee MDPI, Basel, Switzerland. This article is an open access
article distributed under the terms and conditions of the Creative Commons Attribution
(CC BY) license (http://creativecommons.org/licenses/by/4.0/).You can also read