Genome-wide DNA methylome and whole-transcriptome landscapes of spontaneous intraductal papilloma in tree shrews
←
→
Page content transcription
If your browser does not render page correctly, please read the page content below
Original Article
                                                                                                                                         Page 1 of 19

Genome-wide DNA methylome and whole-transcriptome
landscapes of spontaneous intraductal papilloma in tree shrews
Chengxiu Liu, Yuanyuan Han, Pinfen Tong, Dexuan Kuang, Na Li, Caixia Lu, Xiaomei Sun,
Wenguang Wang, Jiejie Dai

The Center of Tree Shrew Germplasm Resources, Institute of Medical Biology, Chinese Academy of Medical Sciences and Peking Union Medical
College, Kunming, China
Contributions: (I) Conception and design: J Dai, C Liu; (II) Administrative support: None; (III) Provision of study materials or patients: C Liu, Y Han;
(IV) Collection and assembly of data: D Kuang, C Liu, N Li, W Wang, P Tong; (V) Data analysis and interpretation: X Sun, J Dai; (VI) Manuscript
writing: All authors; (VII) Final approval of manuscript: All authors.
Correspondence to: Jiejie Dai. Center of Tree Shrew Germplasm Resources, Institute of Medical Biology, Chinese Academy of Medical Sciences/Peking
Union Medical College, Kunming 650118, China. Email: djj@imbcams.com.cn.

                 Background: Breast intraductal papilloma (IP) is mainly caused by the abnormal proliferation of ductal
                 epithelial cells. Tree shrews have potential as an animal model for the study of breast tumours; however,
                 little is known regarding the transcriptome and DNA methylome landscapes of breast IP in tree shrews. In
                 this research, we conducted whole-genome DNA methylation and transcriptome analyses of breast IP and
                 normal mammary glands in tree shrews.
                 Methods: DNA methylation profiles were generated from the whole-genome bisulfite sequencing and
                 whole-transcriptome landscapes of IP and control groups of tree shrews through strand-specific library
                 construction and RNA sequencing. Gene Ontology and Kyoto Encyclopedia of Genes and Genomes
                 functional enrichment analyses and gene set enrichment analysis were performed. Spearman’s correlation
                 analysis was used to identify statistical relationships between gene expression and DNA methylation.
                 Results: A genome-wide perspective of the epigenetic regulation of protein-coding genes in breast IP in
                 tree shrews was obtained. The methylation levels at CG sites were considerably higher than those at CHG
                 or CHH sites, and were highest in gene body regions. In total, 3,486, 82 and 361 differentially methylated
                 regions (DMRs) were identified in the context of CG, CHG, and CHH, respectively, and 701 differentially
                 methylated genes (DMGs) were found. Further, through transcriptomic analysis, 62 differentially expressed
                 genes, 50 long noncoding RNAs, and 32 circular RNAs were identified in breast IP compared to normal
                 mammary glands. Correlation analysis between the DNA methylation and transcriptome data revealed
                 that 25 DMGs were also differentially expressed genes, among which the expression levels of 9 genes were
                 negatively correlated with methylation levels in gene body regions. Importantly, integrated analysis identified
                 3 genes (PDZ domain-containing 1, ATPase plasma membrane Ca2+ transporting 4 and Lymphocyte
                 cytosolic protein 1) that could serve as candidates for further study of breast IP in tree shrews.
                 Conclusions: This research has unearthed the comprehensive landscape of the transcriptome and DNA
                 methylome of spontaneous IP in tree shrews, as well as candidate tumorigenesis related genes in IP. These
                 results will contribute to the use of tree shrews in animal models of breast tumours.

                 Keywords: Tree shrew; spontaneous breast intraductal papilloma (spontaneous breast IP); DNA methylation;
                 transcriptome

                 Submitted Feb 04, 2021. Accepted for publication Apr 17, 2021.
                 doi: 10.21037/atm-21-1293
                 View this article at: http://dx.doi.org/10.21037/atm-21-1293

© Annals of Translational Medicine. All rights reserved.                     Ann Transl Med 2021;9(8):688 | http://dx.doi.org/10.21037/atm-21-1293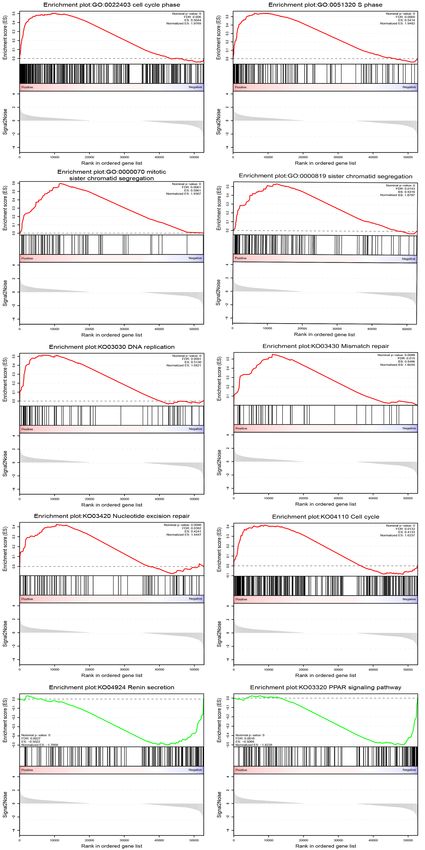
Page 2 of 19                                               Liu et al. DNA methylome and transcriptome of breast IP in tree shrews

Introduction                                                      would be helpful to understanding the tumorigenesis of
                                                                  papilloma from the perspective of epigenetic regulation.
Intraductal papilloma (IP), a benign tumour that forms
                                                                     It is generally believed that the abnormal reprogramming
in the breast ducts, accounts for approximately 10% of
                                                                  of the whole transcriptome, including genes, long noncoding
cases of benign breast lesions (1). IP, which is caused by
                                                                  RNAs (lncRNAs), and circular RNAs (circRNAs), is
the abnormal proliferation of ductal epithelial cells, most
                                                                  a crucial process in the occurrence and progression of
commonly affects women between the ages of 35 and
                                                                  tumours. Recently, RNA sequencing (RNA-seq) studies
55 years old (2). Hormones, fertility, and diet are all risk
                                                                  of breast cancer (18) have been conducted to inform a
factors that predispose women to the development of IP (3).
                                                                  deeper understanding of the mechanisms involved, and
Because IP is related to atypia, ductal carcinoma in situ
                                                                  research on the potential underlying molecular mechanisms
(DCIS), and carcinoma, it is classified as a high-risk
                                                                  influencing breast cancer occurrence and development has
precursor lesion and carries a 6.3% risk of malignancy (3);
                                                                  been performed in murine mammary tumour models (19).
upon surgical excision, IP may be upgraded to atypical
                                                                  By analysing methylome and transcriptome variations
ductal hyperplasia or DCIS (4). However, at present, the
                                                                  related to the survival status of patients with breast cancer,
mechanism of breast neoplasms is not fully understood, and
                                                                  we can obtain a deeper understanding of the basic biological
multidimensional molecular data from IP patients have not
                                                                  process of breast cancer based on its genetic aetiology (20).
been fully integrated in studies on this topic.
                                                                  Moreover, the results of analysis of DNA methylation and
   The results of DNA sequencing research have confirmed
                                                                  gene expression have demonstrated that the methylation
that tree shrews are closely related to primates (5).
                                                                  level of CpGs in breast cancer tissues is significantly higher
Consequently, tree shrews have become an increasingly
                                                                  than that in adjacent normal tissues. Additionally, large
popular experimental animal model for various human
                                                                  numbers of CpGs exhibit a significantly higher methylation
tumours, including lung cancer (6), hepatocellular
                                                                  level than that found in nearby normal tissues, which is
carcinoma (7), and glioblastoma (8). Genome sequencing of
                                                                  negatively correlated with gene expression (21). Thus, by
Chinese tree shrews was first accomplished in 2013 and has
                                                                  combining methylation data and gene expression profile
provided a useful resource for functional genomic studies
                                                                  data, we can better analyse the regulatory function of
since (9). A database of the genome sequencing data of tree
                                                                  methylation to solve existing conundrums.
shrews has also been established (10). Most importantly, in
                                                                     At present, studies on DNA methylation and the
terms of morphology and structure, the mammary glands
                                                                  transcriptome in IP are lagging behind those on malignant
of tree shrews are similar to those of humans (11). Based on
                                                                  breast cancer. Therefore, in the present work, we
these qualities, tree shrews are ideal experimental animals
                                                                  carried out an integrated analysis of genome-wide DNA
for studying the pathogenesis of mammary tumours.
                                                                  methylation levels and the whole transcriptome in breast
However, few studies have used tree shrews as a novel breast
                                                                  IP in tree shrews. Our study provides new insights into IP
tumour animal model to examine gene expression patterns
                                                                  in tree shrews, highlights candidate tumorigenesis-eliciting
and the underlying function of DNA methylation in the
                                                                  genes, and will contribute to the use of tree shrews in breast
tumorigenesis of spontaneous IP.
                                                                  tumour animal models. We present the following article
   DNA methylation is one of the epigenetic changes that
                                                                  in accordance with the MDAR and ARRIVE reporting
has been shown to play a key role in the pretranscriptional
                                                                  checklist (available at http://dx.doi.org/10.21037/atm-21-
regulation and inhibition of gene expression in multiple
                                                                  1293).
mammalian genomes. The mapping of genome-wide
DNA methylation is of great importance to understanding
tumorigenesis (12). DNA methylation is implicated in              Methods
many cancers, including thyroid cancer (13), non-small cell
                                                                  Tissue specimens from tree shrews and their histology
lung cancer (14), and gastric cancer (15), as well as in the
development and progression of breast cancer (16). Limited        Six female tree shrews were obtained from the Institute of
evidence has also indicated that the aberrant methylation of      Medical Biology, Chinese Academy of Medical Sciences
cytosine residues is involved in the development of IP (17).      (IMB-CAMS; Kunming, China). Experiments were
Therefore, delineating the DNA methylation profile and            performed under a project license (No.: DWSP201809003)
identifying differentially methylated genes (DMGs) in IP          granted by the animal ethics committee of IMB-CAMS, in

© Annals of Translational Medicine. All rights reserved.         Ann Transl Med 2021;9(8):688 | http://dx.doi.org/10.21037/atm-21-1293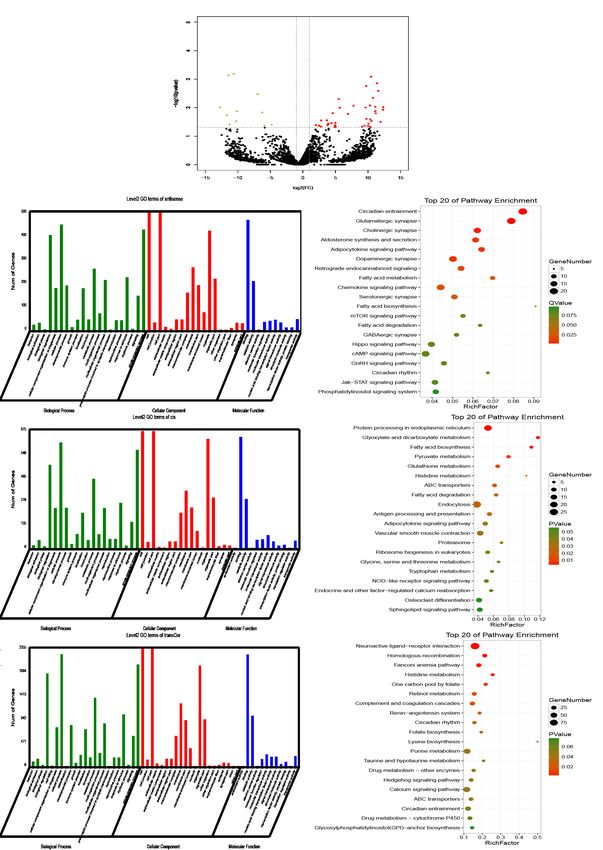
Annals of Translational Medicine, Vol 9, No 8 April 2021                                                                Page 3 of 19

compliance with IMB-CAMS guidelines for the care and             CHG, and CHH). Variant methylation patterns in variant
use of animals.                                                  genomic regions were estimated by plotting the methylation
   Breast tumour tissues and normal breast tissues were          profiles of the flanking 2 kb regions and the gene body
collected after euthanasia of the animals by intraperitoneal     based on the average methylation level for each window.
injection of pentobarbital sodium (100 mg/kg).
The mammary tumours were surgically removed. A
                                                                 Differentially methylated region (DMR) analysis
portion of each tissue sample was dissected, fixed in a
4% paraformaldehyde solution, embedded in paraffin,              Methylkit software (v1.4.1) (24) was used for the analysis
and stained with haematoxylin and eosin (HE) before              of differential DNA methylation. To investigate DMRs
histological examination by pathologists. Another portion        between the IP and control groups, the minimum read
of each tissue sample was immediately frozen in liquid           coverage to call the methylation status of a base was set to
nitrogen and stored at –80 ℃ for subsequent experiments.         4. A 200-bp window was used to scan the whole genome,
                                                                 and the average DNA methylation rate was calculated in
                                                                 each window (a certain type of C). Then, the differences in
Library construction and whole-genome bisulfite
                                                                 the methylation level of each sample in each window were
sequencing (WGBS)
                                                                 compared. The coding genes were divided into 3 regions:
Genomic DNA was extracted from the samples using the             2 kb upstream, gene body, and 2 kb downstream. Then, we
cetyltrimethylammonium bromide (CTAB) method, and                analysed the location of the DMR to determine the DMGs.
the DNA concentration and integrity were determined with         Gene Ontology (GO) and Kyoto Encyclopedia of Genes
a NanoPhotometer® spectrophotometer (IMPLEN, CA,                 and Genomes (KEGG) pathway enrichment analyses were
USA) and agarose gel electrophoresis, respectively. Then,        performed to explore the functional enrichment of genes
DNA libraries were prepared for bisulfite sequencing.            influenced by DMRs.
Briefly, genomic DNA was fragmented into 100–300 bp
fragments by sonication (Covaris, Massachusetts, USA)
                                                                 Strand-specific library construction and whole-
and purified with a MiniElute PCR Purification Kit
                                                                 transcriptome sequencing
(QIAGEN, MD, USA). The DNA fragments were end-
repaired, and a single “A” nucleotide was added to the 3'        First, total RNA was extracted using TRIzol, and ribosomal
end of the blunt fragments. Then, the genomic fragments          RNA (rRNA) was removed to retain messenger RNAs
were ligated to methylated sequencing adapters. Fragments        (mRNAs) and non-coding RNAs (ncRNAs). The enriched
with adapters were subjected to bisulfite conversion             mRNAs and ncRNAs were fragmented into short fragments
using the Methylation-Gold kit (ZYMO, CA, USA), and              using fragmentation buffer and then reverse-transcribed
unmethylated cytosines were converted to uracils through         into complementary DNA (cDNA) with random primers.
sodium bisulfite treatment. Finally, the converted DNA           Second-strand cDNA was synthesized with DNA
fragments were amplified by polymerase chain reaction            polymerase I, RNase H, dNTP (dUTP instead of dTTP)
(PCR) and sequenced on an Illumina HiSeq TM 2500                 and buffer. Next, the cDNA fragments were purified with
instrument.                                                      a QiaQuick PCR extraction kit, end-repaired, subjected
                                                                 to poly (A) addition, and ligated to Illumina sequencing
                                                                 adapters. The second-strand cDNA was then digested
Methylation level analysis
                                                                 with UNG (uracil-N-glycosylase). Finally, the digested
After data filtering, the acquired clean reads were mapped to    products were size-selected by agarose gel electrophoresis,
the Tupaia chinensis (Chinese tree shrew) reference genome       and subjected to PCR amplification and sequencing on the
(TupChi_1.0) (GCF_000334495.1) using BSMAP software              Illumina HiSeqTM 4000 platform.
(v2.90) (22). A custom Perl script (23) was then applied to
call methylated cytosines, and a correction algorithm was
                                                                 Alignment with rRNA and the reference genome
applied to the methylated cytosine results. Methylation
levels were calculated according to the methylated cytosine      After the filtering of clean reads, Bowtie2 (v2.2.8) (25) was
percentage in the global genome as well as that in variant       applied to map reads to the rRNA database (ftp://ftp.ncbi.
regions of the genome for each sequence context (CG,             nlm.nih.gov/genbank/), and the rRNA mapped reads were

© Annals of Translational Medicine. All rights reserved.        Ann Transl Med 2021;9(8):688 | http://dx.doi.org/10.21037/atm-21-1293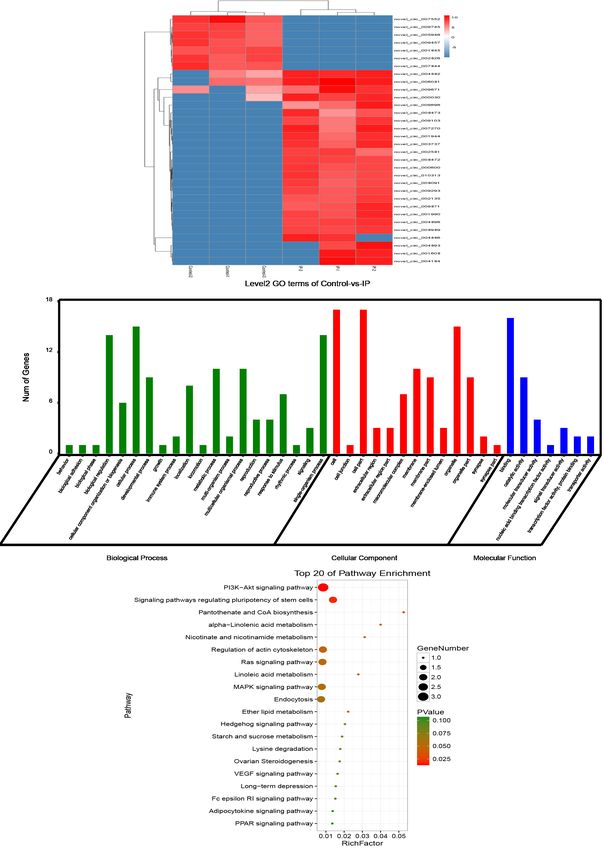
Page 4 of 19                                                 Liu et al. DNA methylome and transcriptome of breast IP in tree shrews

removed. The remaining reads were used for subsequent               LncRNA prediction and analysis
assembly and analysis. The removed rRNA reads were
                                                                    Coding-non-coding index (CNCI) (v2) (30) and coding
also mapped to TupChi_1.0 using TopHat2 (v2.1.1) (26).
                                                                    potential calculator (CPC) (31) were applied for evaluation
After alignment with TupChi_1.0, the reads mapped to
                                                                    of the protein-coding potential of novel transcripts
the genomes were removed, and the unmapped reads
                                                                    according to default parameters. To obtain protein
were collected for circRNA identification. Unmapped
                                                                    annotations, novel transcripts were also mapped to the
reads were aligned to the reference genome with Bowtie2
                                                                    SwissProt database. Those showing the intersection of
again, and the enriched unmapped reads were split into
                                                                    neither protein-coding potential nor protein annotation
smaller segments, which were subsequently used to identify
                                                                    results were selected as lncRNAs. To investigate the
potential splice sites.
                                                                    interaction between antisense lncRNAs and mRNAs,
                                                                    complementary correlation analysis was performed using
Transcript reconstruction                                           RNAplex (32). The program contains the ViennaRNA
                                                                    package (33) and predicts the best base pairing according to
The reconstruction of transcripts was performed with                thermodynamic structure on the basis of the calculation of
Cufflinks software (27), together with TopHat2, to identify         minimum free energy.
new genes and new splice variants of known genes. The
reference annotation-based transcripts (RABT) program
was preferred. To make up for the effect of low-coverage            Quantification of the abundance of transcripts and
sequencing, Cufflinks generated faux reads based on                 circRNAs
reference. Finally, all reassembled fragments were aligned          Transcript abundance was quantified by RSEM (RNA-Seq
with reference genes, and similar fragments were discarded.         by Expectation-Maximization) (34). The fragments per
                                                                    kilobase of transcript per million mapped reads (FPKM)
Identification and annotation of novel transcripts                  method was applied for the normalization of transcript
                                                                    expression levels. Additionally, the reads per million
To identify new transcripts, all reconstructed transcripts were     mapped reads (RPM) method was used to scale back-spliced
aligned to TupChi_1.0. For the identification of predictable        junction reads for circRNA quantification.
novel genes, the following parameters were applied: length of
transcript >200 bp and exon number >2. To acquire protein
functional annotations, the novel transcripts were aligned to       Correlation of DNA methylation and gene expression
the Nr, KEGG, and GO databases.                                     To identify whether the DNA methylation level in
                                                                    DMRs affects gene expression between groups, genes
CircRNA identification and database annotation                      were classified according to their genomic location,
                                                                    including the ±2 kb flanking regions and gene body region.
To identify unique anchor positions within splice sites, 20-        Spearman’s correlation analysis was used to identify the
mers were extracted from both ends of the unmapped reads            statistical relationships between gene expression and DNA
and aligned to TupChi_1.0. Anchor reads that aligned in             methylation within the gene body and ±2 kb flanking
the reverse orientation (head to tail) and showed circRNA           regions. Rho 0 indicated a positive correlation. To investigate
circRNA identification. Anchor alignments were extended             the underlying functions of DNA methylation which are
until the complete read was aligned and the breakpoints             responsible for differential gene expression, common genes
were flanked by GU/AG splice sites. A candidate circRNA             between the DMR-related genes and DEGs were analysed,
was called if it was supported by at least 2 unique back-           and GO and KEGG pathway enrichment analyses were
spliced reads. The identified circRNAs were also subjected          conducted for DEGs with DMRs.
to statistical analysis of their type and length distribution.
Finally, the circRNAs were subjected to BLAST searches
                                                                    Functional enrichment analysis
against circBase (29) for annotation, and those that were
unable to be annotated were defined as novel circRNAs.              GO enrichment analysis recognizes the key biological

© Annals of Translational Medicine. All rights reserved.           Ann Transl Med 2021;9(8):688 | http://dx.doi.org/10.21037/atm-21-1293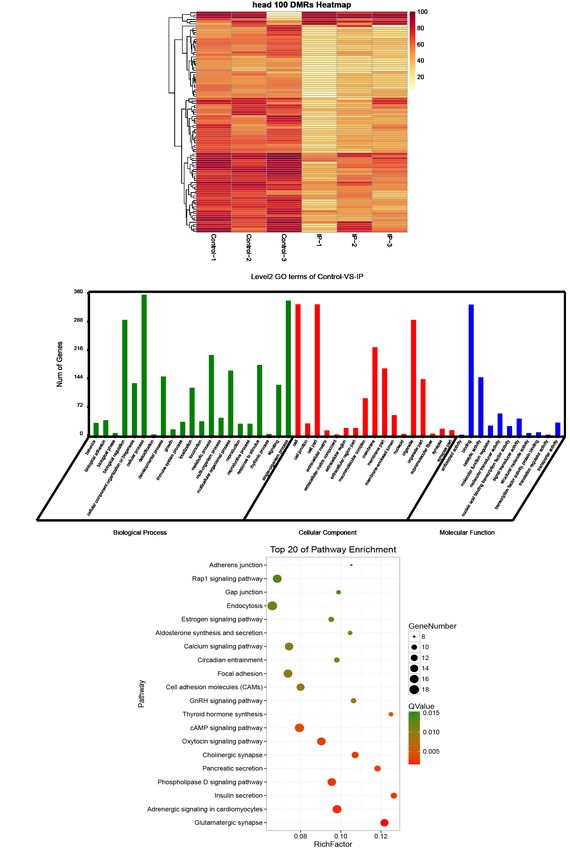
Annals of Translational Medicine, Vol 9, No 8 April 2021 Page 5 of 19
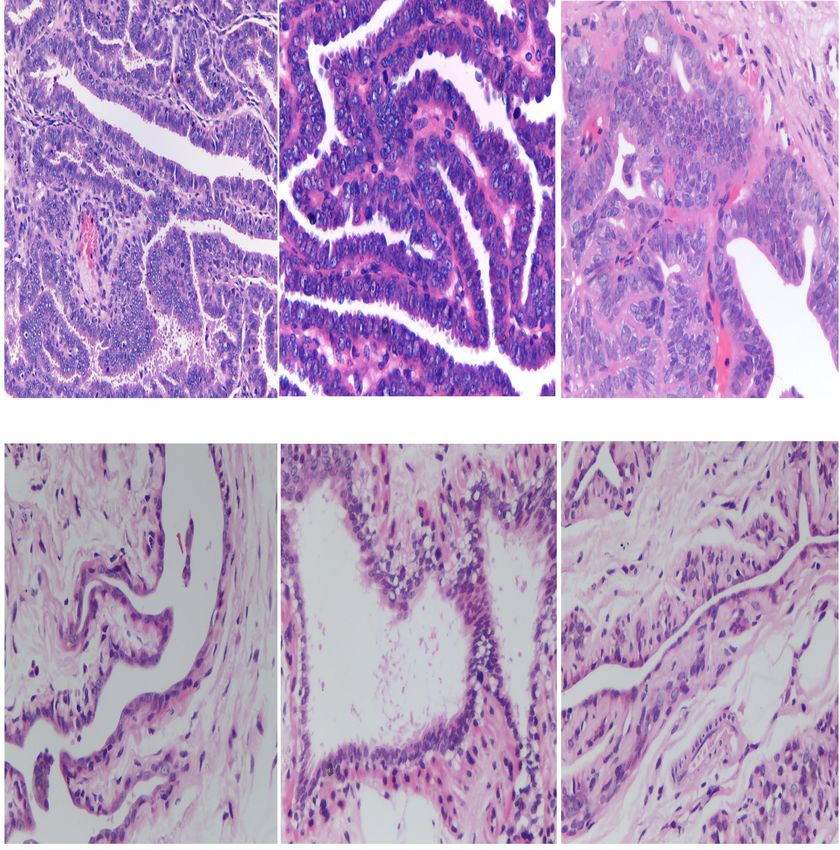
functions of genes by providing all GO terms that are IPs, the ductal epithelium of the breast showed papillary
significantly enriched in genes compared to the genomic hyperplasia, the nipple varied in size, and the cells
background, and also enables genes to be filtered according showed no atypia, which is similar to human pathology.
to their biological functions. Genes generally interact The tumours were expected to be benign (Figure 1A). In
with each other to carry out specific biological functions. contrast, examination of normal tree shrew mammary
Pathway-based analysis contributes to further identification glands showed the breast acini and ducts to have a normal
of genes’ biological functions, with KEGG being the structure, and no degeneration, necrosis, or inflammatory
primary public pathway-related database (35). All genes cell infiltration was observed (Figure 1B). We confirmed
were mapped to GO terms in the GO database, gene numbers that 3 of the spontaneous mammary tumours collected from
were calculated for each term, and the significantly enriched females in the closed colony of tree shrews were breast IPs.
GO terms were identified. Pathway enrichment analysis The selected tree shrews were divided into 2 groups: the
revealed signal transduction or metabolic pathways that were IP group (n=3), comprising tree shrews with IPs (IP-1, IP-
significantly enriched in genes compared to the genomic 2, and IP-3); and the control group (n=3), comprising tree
background. To discern whether a set of genes enriched in shrews with healthy mammary gland tissues (control-1,
distinct GO terms/pathways showed significant differences control-2, and control-3). The results indicated that the
between the 2 groups, a gene set enrichment analysis (GSEA) selected IP tree shrews and normal tree shrews were
was carried out using GSEA software (36). Briefly, we appropriate for subsequent analyses.
input a gene expression matrix and ranked genes by using a
SinaltoNoise normalization program. Enrichment scores and
P values were calculated using default parameters. Genome-wide DNA methylation profiling of breast IPs
and normal mammary gland tissues of tree shrews
Statistical analysis To investigate methylation patterns during IP development
in tree shrews, we analysed genome-wide DNA methylation
Mean ± SEM and multiple t tests for methylation levels were (DNAm) levels in tissues from the IP group and control
calculated using GraphPad Prism 8 (GraphPad, San Diego, group by WGBS with >99% conversion efficiency (Table S1).
USA). The DMRs in each sequence context (CG, CHG, The genome of the normal mammary gland tissue sample
and CHH) were identified based on the following criteria: (control group) presented ~4.39% methylated cytosines
for CG, CHG, CHH, and all C, the number of CG, CHG, (mCs), and the IP sample presented ~4.41% mCs among
CHH, and all C sites in each window needed to be ≥5, 5, the total sequenced C sites, reflecting the degree of genome
15, and 20, respectively; the absolute value of the difference methylation. The methylation levels of CG, CHH, and
in the methylation ratio needed to be ≥0.25, 0.25, 0.15, and CHG (in which H is A, C, or T) sites were distinct. The
0.2, respectively; and Q≤0.05 was required in all cases. The genome-wide mC levels were detected as 88.08%±1.76%
edgeR package was used to determine the transcripts and for CG, 2.52%±0.32% for CHG, and 9.40%±1.45% for
circRNAs that were differentially expressed between the 2 CHH in the control group, and 90.19%±0.54% for CG,
groups. For each comparison, we identified mRNAs with a 2.07%±0.04% for CHG, and 8.41%±0.19% for CHH in
fold change (FC) ≥2 and a false discovery rate (FDR)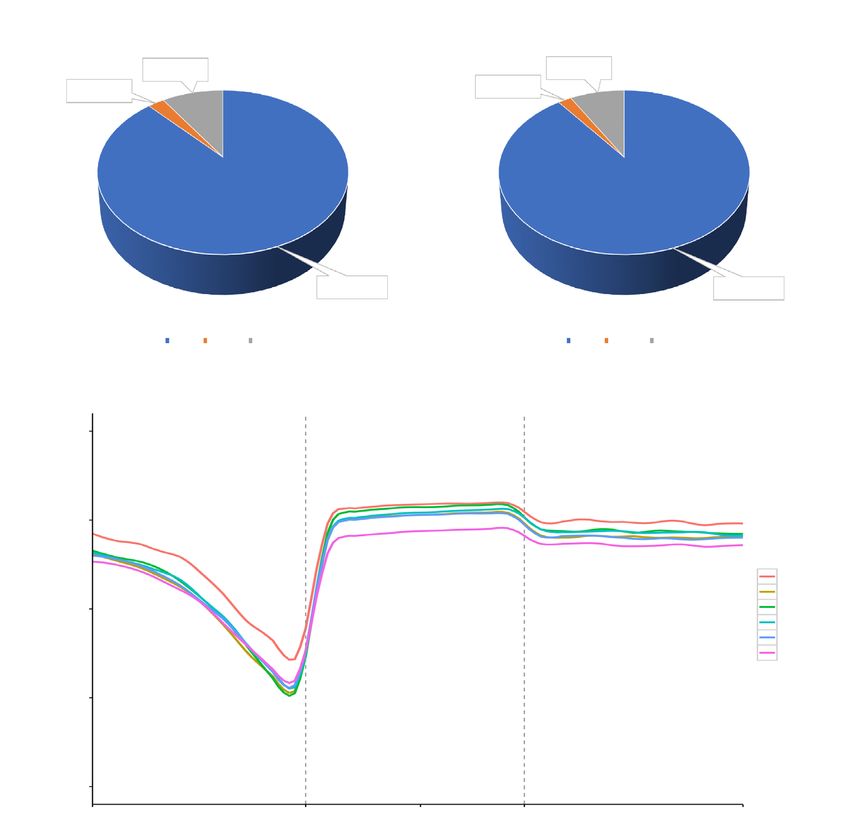
Page 6 of 19                                                 Liu et al. DNA methylome and transcriptome of breast IP in tree shrews

                 A

                                    IP-1                         IP-2                               IP-3

                 B

                                  Control-1                     Control-2                           Control-3

Figure 1 Histological diagnosis of experimental samples. (A) Haematoxylin and eosin (H&E) staining results for breast intraductal
papillomas in 3 tree shrews (magnification 400×). (B) H&E staining results for normal mammary tissue in 3 tree shrews (magnification
400×).

the DNA methylation pattern in 3 distinct regions of                    level in the CG context was highest in the gene body region.
transcriptional elements: the upstream 2k region [2,000 bp              DNA methylation was moderately high in the upstream
before the transcription start site (TSS) of the gene],                 2K start site, decreased dramatically from the upstream 2k
the gene body region, and the downstream 2k region                      region to the TSS, increased sharply from the TSS to the
(2,000 bp after the transcription termination site). The                gene body region, maintained the highest level in the gene
distribution characteristics of DNA methylation levels in               body region, and then decreased slightly in the downstream
distinct functional regions can aid in the understanding of             2K region (Figure 2B).
the characteristics of DNA methylation modifications in                    A total of 3,486 differentially methylated CG regions,
different regions at the whole-genome level.                            82 CHG regions, and 361 CHH regions were identified. In
   The obtained DNA methylation profiles showed that the                the CG context, 3,486 DMRs, located in 701 genes, were
methylation level in the CG context was higher than those               identified between the IP and control groups (Q
Annals of Translational Medicine, Vol 9, No 8 April 2021 Page 7 of 19
A
Control IP
9.40%±1.45% 8.41%±0.19%
2.52%±0.32% 2.07%±0.04%
88.08%±1.76% 90.19%±0.54%
mCG mCHG mCHH mCG mCHG mCHH
All Sample CG Methylation Profiling
B 1.00
0.75
Methylation level
Control-1
Control-2
0.50 Control-3
IP-1
IP-2
IP-3
0.25
0.00
Up2k TSS Genebody TES Down2k
Figure 2 Genome-wide DNA methylation levels and trends. (A) The average ratio of DNA methylation types in the control and IP groups.
Blue, orange, and grey represent methylated (m) CG, mCHG, and mCHH, respectively. (B) CG methylation levels in the gene body and 2
kb upstream and downstream regions. The different coloured lines represent different experimental samples. Up2k, 2 kb upstream region;
Down2k, 2 kb downstream region; TSS, transcription start site; TES, transcription termination site.
showed decreased methylation in IP tissues compared with associated with the oxytocin signalling pathway (Q=0.0027),
control tissues. The union of the DMRs of all samples and 10 DMGs were associated with the oestrogen signalling
was taken, and a heat map of the CG methylation rates of pathway (Q=0.0113) (Figure 3C). Taken together, these
regions was drawn (Figure 3A). The results revealed that the gene annotation results revealed that the majority of DMGs
CG methylation rates showed discrepant levels in the IP showing increased methylation or decreased methylation
and control group samples. were mapped to the gene body region, suggesting that
To further elucidate the biological functions of the DMGs play critical roles in IP.
DMGs, we performed GO and KEGG pathway analyses.
The GO term analysis revealed that the putative target genes
DEGs between the IP group and the control group
of KLF5 were associated with terms such as developmental
process (P adjust =0.0056) and single-organism To systematically describe the transcriptome landscape of
developmental process (P adjust =0.0103) in the biological the IP group and the control group, whole-transcriptome
process (BP) category, binding (P=0.0063) in the molecular sequencing was performed. After the removal of low-quality
function (MF) category, and membrane (P=0.0045) reads from each library, the clean reads were combined and
in the cellular component (CC) category (Figure 3B). aligned to TupChi_1.0, resulting in the identification of
KEGG pathway analysis showed that 15 DMGs were 10,051 known mRNAs, 25,481 novel mRNAs, 1,022 known
© Annals of Translational Medicine. All rights reserved. Ann Transl Med 2021;9(8):688 | http://dx.doi.org/10.21037/atm-21-1293Page 8 of 19 Liu et al. DNA methylome and transcriptome of breast IP in tree shrews
head 100 DMRs Heatmap
A
Control-1
Control-2
Control-3
IP-1
IP-2
IP-3
B Level2 GO terms of Control-vs.-IP
Top 20 of Pathway Enrichment
C
Figure 3 Differentially methylated regions (DMRs) associated with the development of IP. (A) Heat map of CG methylation rates of DMRs
in six samples. (B) Annotation of differential methylated genes (DMGs) with GO enrichment, classified into cellular components, molecular
function, and biological processes according to GO term. Gene numbers are listed for each category. (C) KEGG pathway enrichment of
DMGs. The ordinate represents the enriched pathways, and the abscissa represents the Rich factor of the corresponding pathways; the size
of the spots represents the number of genes related to DMRs enriched in each pathway, while the color of the spot represents the corrected
Q-value for each pathway. The Rich factors indicate the ratio of the number of DMGs mapped to a certain pathway to the total number of
genes mapped to this pathway. Greater Rich factor means greater enrichment.
© Annals of Translational Medicine. All rights reserved. Ann Transl Med 2021;9(8):688 | http://dx.doi.org/10.21037/atm-21-1293Annals of Translational Medicine, Vol 9, No 8 April 2021 Page 9 of 19
A B
10
8
−log10 (pvalue)
6
4
2
0
−2 −1 0 1 2
NES
log2 (FC)
Figure 4 Differentially expressed genes (DEGs) and gene set enrichment analysis (GSEA) in the IP group compared to the control group.
(A) Volcano plot of DEGs (|log2FC| ≥1 & FDRPage 10 of 19 Liu et al. DNA methylome and transcriptome of breast IP in tree shrews
The lncRNA expression profile is distinct between IP and signalling pathway (P=0.0070), recombinational repair
normal mammary gland tissues of tree shrews (P=0.0086), and execution phase of apoptosis (P=0.0125)
(Figure 5F). The DElncRNA trans-regulated co-expressed
Compared with the control group, 50 differentially
genes were significantly enriched in KEGG pathways
expressed lncRNAs (DElncRNAs), of which 39 were
including homologous recombination (P=0.0004), histidine
upregulated and 11 were downregulated, were identified in
metabolism (P=0.0022), and renin-angiotensin system
the IP tissue samples (|log2FC| ≥1 & PAnnals of Translational Medicine, Vol 9, No 8 April 2021 Page 11 of 19
A
5
4
−log10 (pvalue)
3
2
1
0
−log2 (FC)
Level2 GO terms of antisense Top 20 of Pathway Enrichment
B C
Num of Genes
GeneNumber
QValue
0.04 0.05 0.06 0.07 0.08 0.09
Biological Process Cellular Component Molecular Function RichFactor
Level2 GO terms of cis Top 20 of Pathway Enrichment
D E
Num of Genes
GeneNumber
PValue
0.04 0.06 0.08 0.10 0.12
Biological Process Cellular Component Molecular Function RichFactor
Level2 GO terms of transCor Top 20 of Pathway Enrichment
F G
Num of Genes
GeneNumber
PValue
0.1 0.2 0.3 0.4 0.5
Biological Process Cellular Component Molecular Function RichFactor
Figure 5 Differentially expressed lncRNAs (DElncRNAs) associated with the development of IP. (A) Volcano plot of DElncRNAs (|log2FC|
≥1 & PPage 12 of 19 Liu et al. DNA methylome and transcriptome of breast IP in tree shrews
A
10
5
0
−5
Control-2
Control-1
Control-3
IP-3
IP-1
IP-2
Level2 GO terms of Control-vs.-IP
B
Num of Genes
Biological Process Cellular Component Molecular Function
Top 20 of Pathway Enrichment
C
GeneNumber
Pathway
PValue
RichFactor
Figure 6 Differentially expressed circRNAs (DEcircRNAs) associated with development of IP. (A) Heat map of DEcircRNAs (|log2FC|
≥1 & PAnnals of Translational Medicine, Vol 9, No 8 April 2021 Page 13 of 19
between tree shrews in the IP and control groups, we Furthermore, ADCY5 and CREB5 were involved in insulin
analysed the correlation between gene expression and DNA secretion (P=0.0001) and oestrogen signalling pathway
methylation data in the 2 groups. The results indicated (P=0.0002) in endocrine system. Thus, we integrated the
a considerable regulatory effect of DNA methylation in gene expression and DNA methylation maps and identified
the modulation of gene expression. In both the IP and protein-coding genes with underlying changes related to
control groups, the methylation levels in the upstream 2K DNA methylation in IP; the resulting alterations probably
(Pearson’s R =−0.0383 and −0.0192, respectively) and gene induce the development of breast tumours.
body (Pearson’s R =−0.0922 and −0.0737, respectively)
were negatively correlated with expression levels. In the
Discussion
control group, the methylation levels in the downstream 2K
regions were also negatively correlated with expression levels In this work, we have provided an expanded overview of the
(Pearson’s R =−0.0013); however, in the IP group, a positive DNA methylation levels and transcriptomic characteristics
correlation was observed (Pearson’s R =0.0030) (Figure 7A,B). of 3 tumour tissue samples of spontaneous breast IP and 3
In addition, DMGs and DEGs were compared through normal mammary gland tissues from tree shrews, in which
integrated methylomic and transcriptomic analysis, which gene expression was analysed. Tree shrews are considered
revealed 25 genes with differential methylation and to have potential as an animal model for the study of
expression according to both RNA-seq (PPage 14 of 19 Liu et al. DNA methylome and transcriptome of breast IP in tree shrews
A B
Downstream2kDNA Methylation Level Downstream2kDNA Methylation Level
0.78 Gene Expression Level Gene Expression Level
Downstream2k 10
Relative Gene Expression Level
IP
0.77
DNA Methylation Level
8
Control
0.76
Genebody 6
0.75
4
0.74 2
upstream2k
0.73 0
−0.1 −0.08 −0.06 −0.04 −0.02 0 0.02
rho value Control (R=−0.0013) IP (R=0.0030)
C XM_006144437.2 SMAD2
0.76
1.5 GenebodyDNA Methylation Level GenebodyDNA Methylation Level
Gene Expression Level Gene Expression Level
XM_006146258.2 ADGRL3
10
0.75
Relative Gene Expression Level
XM_006148415.2 FAM192A 1
DNA Methylation Level
XM_006153139.1 FAT4 8
0.5 0.74
XM_006154597.1 ADCY5
0 6
0.73
XM_006154770.2 ASPH
XM_006157105.1 TSHR −0.5
0.72 4
XM_006157144.2 PDZK1
−1
0.71 2
XM_006159177.2 ATP2B4
−1.5
XM_006159188.2 ZC3H11A
0.70
0
XM_006164776.2 ADAMTSL1
Control (R=−0.0737) IP (R=−0.0922)
XM_006166024.2 OGDH
XM_006167341.2 CREB5
XM_006169173.2 DNASE1L3 upstream2kDNA Methylation Level upstream2kDNA Methylation Level
0.60 Gene Expression Level Gene Expression Level
XM_006169174.2 FLNB
10
XM_006169176.2 FLNB
0.58
Relative Gene Expression Level
DNA Methylation Level
XM_006170445.2 UBE2V2 8
XM_006172104.1 ATRNL1 0.56
6
XM_014582091.1 LCP1
0.54
XM_014583774.1 CREB5
4
XM_014586171.1 ANKS1A
0.52
XM_014587963.1 ARHGEF28
2
XM_014589776.1 STAU2
0.50
XM_014593217.1 ZNF609 0
XM_014593219.1 ZNF609
Control (R=−0.0192) IP (R=−0.0383)
Methylation Level Expression Level
Figure 7 Integrative analysis between DNA methylation and transcriptome data. (A) The correlation analysis of all gene expression levels and
DNA methylation levels in the groups. The x-axis represents the correlation between DNA methylation and gene expression levels in the IP and
control groups; rho value >0 indicates a positive correlation, and rho valueTable 1 Significant DEGs showing a negative correlation with DNA methylation involved in the development of intraductal papilloma
DNA methylation mRNA
Gene ID Start End Methylation Symbol Description
P value Q value Control fpkm IP fpkm log2 (FC) P value
difference
XM_006146258.2 69740001 69740200 1.09E−20 4.56E−18 −35.605 0.001 1.37 10.42 0.008 ADGRL3 Latrophilin-3 isoform X6
XM_006146258.2 69467601 69467800 2.00E−16 4.18E−14 −33.942 0.001 1.37 10.42 0.008 ADGRL3 Latrophilin-3 isoform X6
XM_006146258.2 69467501 69467700 1.16E−17 3.02E−15 −33.442 0.001 1.37 10.42 0.008 ADGRL3 Latrophilin-3 isoform X6
XM_014582091.1 139578801 139579000 1.21E−09 5.35E−08 −27.965 20.14 95.463 2.245 0.021 LCP1 Plastin-2
XM_014582091.1 139578901 139579100 1.21E−09 5.35E−08 −27.965 20.14 95.463 2.245 0.021 LCP1 Plastin-2
XM_006170445.2 23207301 23207500 4.60E−13 4.82E−11 −26.329 0.001 8.303 13.019 0.044 UBE2V2 Ubiquitin-conjugating enzyme E2
variant 2
XM_006169173.2 65590701 65590900 1.74E−14 2.49E−12 27.634 179.237 50.2 −1.836 0.035 DNASE1L3 Deoxyribonuclease gamma
© Annals of Translational Medicine. All rights reserved.
XM_014583774.1 35152901 35153100 5.78E−06 7.69E−05 28.147 8.087 0.223 −5.178 0.037 CREB5 Cyclic AMP-responsive element-
binding protein 5 isoform X3
Annals of Translational Medicine, Vol 9, No 8 April 2021
XM_006157144.2 118399201 118399400 2.95E−09 1.16E−07 29.807 11.083 0.883 −3.649 0.045 PDZK1 Na(+)/H(+) exchange regulatory
cofactor NHE-RF3
XM_006154597.1 40832101 40832300 2.93E−18 8.43E−16 33.982 4.49 0.17 −4.723 0.007 ADCY5 Adenylate cyclase type 5
XM_006164776.2 106988901 106989100 4.92E−14 6.38E−12 39.173 7.483 0.993 −2.913 0.029 ADAMTSL1 ADAMTS-like protein 1
XM_006159177.2 28289501 28289700 1.30E−24 8.60E−22 45.829 4.847 0.03 −7.336 0.002 ATP2B4 Plasma membrane calcium-
transporting ATPase 4
A positive value indicates upregulation, and a negative value indicates downregulation. Start/end, the gene position from start to end; Q value, adjusted p value; Control
fpkm/IP fpkm, gene expression levels in the Control/IP group; log2 (FC), log of the fold change in gene expression.
Ann Transl Med 2021;9(8):688 | http://dx.doi.org/10.21037/atm-21-1293
Page 15 of 19Page 16 of 19 Liu et al. DNA methylome and transcriptome of breast IP in tree shrews
To obtain more in-depth insights into the molecular of the actin-binding protein family. It is conserved during
mechanisms underlying tumorigenesis, we carried eukaryote evolution, and its expression is found in most
out a correlation analysis of the RNA-seq and WGBS tissues of higher eukaryotes. LCP1 plays a critical role in
data. The results suggested an inverse correlation of T-cell activation, and is associated with Nuclear factor
PDZK1, ATP2B4, and LCP1 gene expression with DNA kappa-B (NF-κB) signalling, calcium ion binding, and
methylation between the IP and control groups. PDZK1 actin binding. The induction of L-plastin expression is
encodes a PDZ domain-containing scaffolding protein (40). concomitant with tumorigenesis in solid tissues. A negative
Genome-wide association study of a large cohort identified effect of LCP1 on breast cancer progression has been
rs12405132 of PDZK1 as a new susceptibility locus in evidenced, and LCP1 inhibition results in the migration,
breast cancer; hence, PDZK1 is a potential interacting invasion, and proliferation of breast cancer (50). Mutations
gene in breast cancer (41). In primary breast cancers, in LCP1 have been reported as putative cancer drivers
PDZK1 is an oestrogen-regulated gene, the overexpression on the basis of whole-exome sequencing in independent
of which is found in oestrogen receptor (ER)-positive benzo[a]pyrene (BaP)-derived post-stasis human mammary
breast cancers (42). PDZK1 was identified as a marker of epithelial cell strains (51). L-plastin is a protein that exerts
oestrogen-regulated gene expression in a study examining a cell-protective effect against TNF cytotoxicity in breast
the relationship between the menstrual cycle and ER- cancer cell lines (52). The actin-binding protein LCP1/
positive breast cancer (43). Dunbier et al. further verified L-PLASTIN has been verified to participate in CXCL12/
that in postmenopausal patients with primary ER-positive CXCR4 signalling in breast cancer cells (53).
breast cancer, the expression of PDZK1 was strongly Therefore, we concluded that PDZK1, ATP2B4,
related to plasma oestradiol level (44). PDZK1 exhibits and LCP1 might be key regulatory genes during the
epithelial expression with a primarily cytosolic subcellular development of spontaneous IP in tree shrews. In addition,
localization, and its expression is indirectly modulated by the DNA methylation of these genes may be a crucial
ER-α stimulation (45). functional regulator of tumorigenesis. Nevertheless, the
ATP2B4 encodes plasma membrane calcium ATPase epigenetic mechanisms participating in the modulation of
isoform 4 (PMCA4b), which belongs to the P-type primary these genes as well as genetic regions associated with the
ion transport ATPase family. The ATP2B4 protein, which development of IP require further exploration.
is located primarily in the plasma membrane, is expressed
in normal breast tissue and plays a key role in the plasma
Conclusions
membrane Ca 2+ pump in the maintenance of mammary
epithelial Ca2+ homeostasis (46). The PMCA4 protein is Overall, our findings systematically demonstrate the
found in normal breast ductal epithelia; however, as reported changes in mRNA, lncRNA, and circRNA, and facilitate
by Varga et al., a variety of factors, including hormonal the characterization of the genome-wide DNA methylation
imbalances, epigenetic modifications, and impairment of profiles of IP tissue and normal mammary gland tissue in tree
protein trafficking may lead to a loss of PMCA4b in breast shrews, thus providing valuable evidence for an improved
cancer (47). The same study showed that the regulation understanding of the development of mammary tumours.
of Ca2+ signalling through increased PMCA4b expression Our results also show that DNA methylation influences
may be conducive to the normal development of the breast the expression of genes associated with the development
epithelium. Consistent with the results of this previous of spontaneous IP in tree shrews. Such analyses greatly
study, we found that the expression of ATP2B4 mRNA was improve the progress in exploring the characteristics of
downregulated 7.3-fold in our IP group, while methylation DNA methylation in the development of breast IP and
was increased. In breast cancer treatment, the targeting of provide new directions for the study of epigenetic markers
PMCA4 may enhance the effectiveness of breast cancer and target genes in spontaneous mammary tumours.
therapies which act by promoting cell death pathways (48).
The targeted regulation of PMCA4 functionality may give
Acknowledgments
rise to novel therapeutic methods to attenuate or facilitate
new vessel formation in breast cancer, which is associated We thank Prof. Yunzhang Hu and Dr. Jiandong Shi
with angiogenesis (49). (Institute of Medical Biology, Chinese Academy of Medical
LCP1 is an L-plastin protein-coding gene and a member Sciences) for critical reading and constructive suggestions
© Annals of Translational Medicine. All rights reserved. Ann Transl Med 2021;9(8):688 | http://dx.doi.org/10.21037/atm-21-1293Annals of Translational Medicine, Vol 9, No 8 April 2021 Page 17 of 19
on this manuscript as well as Guangzhou Genedenovo of Breast. Chirurgia (Bucur) 2016;111:225-9.
Biotechnology Co., Ltd. for assisting in the sequencing and 2. Soran A, Balkan M, Harlak A, et al. Complicated solitary
bioinformatics analyses. intraductal papilloma of the breast. Int J Clin Pract
Funding: This work was supported by Yunnan Science 2008;62:160-1.
and Technology Talent and Platform Program (No. 3. Jung SY, Kang HS, Kwon Y, et al. Risk factors for
2017HC019; 2018HB071), Yunnan Key Laboratory of malignancy in benign papillomas of the breast on core
Vaccine Research and Development on Severe Infectious needle biopsy. World J Surg 2010;34:261-5.
Diseases (No. KF2015-01), the Yunnan Health Training 4. Eiada R, Chong J, Kulkarni S, et al. Papillary lesions of the
Project of High Level Talents (No. D-2018026), and The breast: MRI, ultrasound, and mammographic appearances.
Kunming Science and Technology Innovation Team (2019- AJR Am J Roentgenol 2012;198:264-71.
1-R-24483). 5. Janecka JE, Miller W, Pringle TH, et al. Molecular
and genomic data identify the closest living relative of
primates. Science 2007;318:792-4.
Footnote
6. Ye L, He M, Huang Y, et al. Tree shrew as a new
Reporting Checklist: The authors have completed the MDAR animal model for the study of lung cancer. Oncol Lett
and ARRIVE reporting checklist. Available at http://dx.doi. 2016;11:2091-5.
org/10.21037/atm-21-1293 7. Yang C, Ruan P, Ou C, et al. Chronic hepatitis B virus
infection and occurrence of hepatocellular carcinoma
Data Sharing Statement: Available at http://dx.doi. in tree shrews (Tupaia belangeri chinensis). Virol J
org/10.21037/atm-21-1293 2015;12:26.
8. Tong Y, Hao J, Tu Q, et al. A tree shrew glioblastoma
Conflicts of Interest: All authors have completed the ICMJE model recapitulates features of human glioblastoma.
uniform disclosure form (available at http://dx.doi. Oncotarget 2017;8:17897-907.
org/10.21037/atm-21-1293). The authors have no conflicts 9. Fan Y, Huang ZY, Cao CC, et al. Genome of the Chinese
of interest to declare. tree shrew. Nat Commun 2013;4:1426.
10. Fan Y, Yu D, Yao YG. Tree shrew database (TreeshrewDB):
Ethical Statement: The authors are accountable for all a genomic knowledge base for the Chinese tree shrew. Sci
aspects of the work in ensuring that questions related Rep 2014;4:7145.
to the accuracy or integrity of any part of the work are 11. Xia HJ, He BL, Wang CY, et al. PTEN/PIK3CA
appropriately investigated and resolved. Experiments were genes are frequently mutated in spontaneous
performed under a project license (No.: DWSP201809003) and medroxyprogesterone acetate-accelerated
granted by the animal ethics committee of IMB-CAMS, in 7,12-dimethylbenz(a)anthracene-induced mammary
compliance with IMB-CAMS guidelines for the care and tumours of tree shrews. Eur J Cancer 2014;50:3230-42.
use of animals. 12. Yang Y, Wu L, Shu XO, et al. Genetically Predicted Levels
of DNA Methylation Biomarkers and Breast Cancer Risk:
Open Access Statement: This is an Open Access article Data From 228 951 Women of European Descent. J Natl
distributed in accordance with the Creative Commons Cancer Inst 2020;112:295-304.
Attribution-NonCommercial-NoDerivs 4.0 International 13. Park JL, Jeon S, Seo EH, et al. Comprehensive DNA
License (CC BY-NC-ND 4.0), which permits the non- Methylation Profiling Identifies Novel Diagnostic
commercial replication and distribution of the article with Biomarkers for Thyroid Cancer. Thyroid 2020;30:192-203.
the strict proviso that no changes or edits are made and the 14. Vrba L, Oshiro MM, Kim SS, et al. DNA methylation
original work is properly cited (including links to both the biomarkers discovered in silico detect cancer in liquid
formal publication through the relevant DOI and the license). biopsies from non-small cell lung cancer patients.
See: https://creativecommons.org/licenses/by-nc-nd/4.0/. Epigenetics 2020;15:419-30.
15. Peng Y, Wu Q, Wang L, et al. A DNA methylation
signature to improve survival prediction of gastric cancer.
References
Clin Epigenetics 2020;12:15.
1. Karadeniz E, Arslan S, Akcay MN, et al. Papillary Lesions 16. Xu Z, Sandler DP, Taylor JA. Blood DNA Methylation
© Annals of Translational Medicine. All rights reserved. Ann Transl Med 2021;9(8):688 | http://dx.doi.org/10.21037/atm-21-1293Page 18 of 19 Liu et al. DNA methylome and transcriptome of breast IP in tree shrews
and Breast Cancer: A Prospective Case-Cohort Analysis in 32. Tafer H, Hofacker IL. RNAplex: a fast tool for RNA-RNA
the Sister Study. J Natl Cancer Inst 2020;112:87-94. interaction search. Bioinformatics 2008;24:2657-63.
17. Lehmann U, Langer F, Feist H, et al. Quantitative 33. Lorenz R, Bernhart SH, Honer Zu Siederdissen C, et al.
assessment of promoter hypermethylation during breast ViennaRNA Package 2.0. Algorithms Mol Biol 2011;6:26.
cancer development. Am J Pathol 2002;160:605-12. 34. Li B, Dewey CN. RSEM: accurate transcript quantification
18. Bao Y, Wang L, Shi L, et al. Transcriptome profiling from RNA-Seq data with or without a reference genome.
revealed multiple genes and ECM-receptor interaction BMC Bioinformatics 2011;12:323.
pathways that may be associated with breast cancer. Cell 35. Kanehisa M, Araki M, Goto S, et al. KEGG for linking
Mol Biol Lett 2019;24:38. genomes to life and the environment. Nucleic Acids Res
19. Mei Y, Yang JP, Lang YH, et al. Global expression 2008;36:D480-4.
profiling and pathway analysis of mouse mammary tumor 36. Subramanian A, Tamayo P, Mootha VK, et al. Gene set
reveals strain and stage specific dysregulated pathways in enrichment analysis: a knowledge-based approach for
breast cancer progression. Cell Cycle 2018;17:963-73. interpreting genome-wide expression profiles. Proc Natl
20. Kuang Y, Wang Y, Zhai W, et al. Genome-Wide Analysis Acad Sci U S A 2005;102:15545-50.
of Methylation-Driven Genes and Identification of an 37. Daino K, Nishimura M, Imaoka T, et al. Epigenetic
Eight-Gene Panel for Prognosis Prediction in Breast dysregulation of key developmental genes in radiation-
Cancer. Front Genet 2020;11:301. induced rat mammary carcinomas. Int J Cancer
21. Liu X, Peng Y, Wang J. Integrative analysis of DNA 2018;143:343-54.
methylation and gene expression profiles identified 38. Shao M, Ge GZ, Liu WJ, et al. Characterization and
potential breast cancer-specific diagnostic markers. Biosci phylogenetic analysis of Kruppel-like transcription factor
Rep 2020;40:BSR20201053. (KLF) gene family in tree shrews (Tupaia belangeri
22. Xi Y, Li W. BSMAP: whole genome bisulfite sequence chinensis). Oncotarget 2017;8:16325-39.
MAPping program. BMC Bioinformatics 2009;10:232. 39. Liu R, Shi P, Zhou Z, et al. Krupple-like factor 5
23. Lister R, Pelizzola M, Dowen RH, et al. Human is essential for mammary gland development and
DNA methylomes at base resolution show widespread tumorigenesis. J Pathol 2018;246:497-507.
epigenomic differences. Nature 2009;462:315-22. 40. Kocher O, Krieger M. Role of the adaptor protein PDZK1
24. Akalin A, Kormaksson M, Li S, et al. methylKit: a in controlling the HDL receptor SR-BI. Curr Opin
comprehensive R package for the analysis of genome-wide Lipidol 2009;20:236-41.
DNA methylation profiles. Genome Biol 2012;13:R87. 41. Michailidou K, Beesley J, Lindstrom S, et al. Genome-
25. Langmead B, Salzberg SL. Fast gapped-read alignment wide association analysis of more than 120,000 individuals
with Bowtie 2. Nat Methods 2012;9:357-9. identifies 15 new susceptibility loci for breast cancer. Nat
26. Kim D, Pertea G, Trapnell C, et al. TopHat2: accurate Genet 2015;47:373-80.
alignment of transcriptomes in the presence of insertions, 42. Ghosh MG, Thompson DA, Weigel RJ. PDZK1
deletions and gene fusions. Genome Biol 2013;14:R36. and GREB1 are estrogen-regulated genes expressed
27. Trapnell C, Roberts A, Goff L, et al. Differential gene and in hormone-responsive breast cancer. Cancer Res
transcript expression analysis of RNA-seq experiments 2000;60:6367-75.
with TopHat and Cufflinks. Nat Protoc 2012;7:562-78. 43. Haynes BP, Ginsburg O, Gao Q, et al. Menstrual cycle
28. Memczak S, Jens M, Elefsinioti A, et al. Circular RNAs associated changes in hormone-related gene expression
are a large class of animal RNAs with regulatory potency. in oestrogen receptor positive breast cancer. NPJ Breast
Nature 2013;495:333-8. Cancer 2019;5:42.
29. Glazar P, Papavasileiou P, Rajewsky N. circBase: a database 44. Dunbier AK, Anderson H, Ghazoui Z, et al. Relationship
for circular RNAs. RNA 2014;20:1666-70. between plasma estradiol levels and estrogen-responsive
30. Sun L, Luo H, Bu D, et al. Utilizing sequence intrinsic gene expression in estrogen receptor-positive breast cancer
composition to classify protein-coding and long non- in postmenopausal women. J Clin Oncol 2010;28:1161-7.
coding transcripts. Nucleic Acids Res 2013;41:e166. 45. Kim H, Abd Elmageed ZY, Ju J, et al. PDZK1 is a
31. Kong L, Zhang Y, Ye ZQ, et al. CPC: assess the protein- novel factor in breast cancer that is indirectly regulated
coding potential of transcripts using sequence features and by estrogen through IGF-1R and promotes estrogen-
support vector machine. Nucleic Acids Res 2007;35:W345-9. mediated growth. Mol Med 2013;19:253-62.
© Annals of Translational Medicine. All rights reserved. Ann Transl Med 2021;9(8):688 | http://dx.doi.org/10.21037/atm-21-1293Annals of Translational Medicine, Vol 9, No 8 April 2021 Page 19 of 19
46. Varga K, Paszty K, Padanyi R, et al. Histone deacetylase 50. Pillar N, Polsky AL, Shomron N. Dual inhibition
inhibitor- and PMA-induced upregulation of PMCA4b of ABCE1 and LCP1 by microRNA-96 results in an
enhances Ca2+ clearance from MCF-7 breast cancer cells. additive effect in breast cancer mouse model. Oncotarget
Cell Calcium 2014;55:78-92. 2019;10:2086-94.
47. Varga K, Hollosi A, Paszty K, et al. Expression of calcium 51. Severson PL, Vrba L, Stampfer MR, et al. Exome-wide
pumps is differentially regulated by histone deacetylase mutation profile in benzo[a]pyrene-derived post-stasis
inhibitors and estrogen receptor alpha in breast cancer and immortal human mammary epithelial cells. Mutat Res
cells. BMC Cancer 2018;18:1029. Genet Toxicol Environ Mutagen 2014;775-776:48-54.
48. Curry MC, Luk NA, Kenny PA, et al. Distinct regulation 52. Janji B, Vallar L, Al Tanoury Z, et al. The actin filament
of cytoplasmic calcium signals and cell death pathways cross-linker L-plastin confers resistance to TNF-alpha in
by different plasma membrane calcium ATPase isoforms MCF-7 breast cancer cells in a phosphorylation-dependent
in MDA-MB-231 breast cancer cells. J Biol Chem manner. J Cell Mol Med 2010;14:1264-75.
2012;287:28598-608. 53. Inaguma S, Riku M, Ito H, et al. GLI1 orchestrates CXCR4/
49. Baggott RR, Alfranca A, Lopez-Maderuelo D, et al. CXCR7 signaling to enhance migration and metastasis of
Plasma membrane calcium ATPase isoform 4 inhibits breast cancer cells. Oncotarget 2015;6:33648-57.
vascular endothelial growth factor-mediated angiogenesis
through interaction with calcineurin. Arterioscler Thromb (English Language Editor: J. Reynolds)
Vasc Biol 2014;34:2310-20.
Cite this article as: Liu C, Han Y, Tong P, Kuang D, Li N,
Lu C, Sun X, Wang W, Dai J. Genome-wide DNA methylome
and whole-transcriptome landscapes of spontaneous intraductal
papilloma in tree shrews. Ann Transl Med 2021;9(8):688. doi:
10.21037/atm-21-1293
© Annals of Translational Medicine. All rights reserved. Ann Transl Med 2021;9(8):688 | http://dx.doi.org/10.21037/atm-21-1293Supplementary Table S1 Individual conversion rates of each sample Sample Ratio Control-1 0.99224 Control-2 0.991674 Control-3 0.99035 IP-1 0.992051 IP-2 0.992087 IP-3 0.992223 © Annals of Translational Medicine. All rights reserved. http://dx.doi.org/10.21037/atm-21-1293
Figure S1 GSEA plots showing the most enriched gene sets in the IP group and the control group.

© Annals of Translational Medicine. All rights reserved.                                          http://dx.doi.org/10.21037/atm-21-1293
You can also read