EXPRESSION OF A GRAPE VQSTS36-INCREASED RESISTANCE TO POWDERY MILDEW AND OSMOTIC STRESS IN ARABIDOPSIS BUT ENHANCED SUSCEPTIBILITY TO BOTRYTIS ...
←
→
Page content transcription
If your browser does not render page correctly, please read the page content below
International Journal of
           Molecular Sciences

Article
Expression of a Grape VqSTS36-Increased Resistance
to Powdery Mildew and Osmotic Stress in
Arabidopsis but Enhanced Susceptibility to Botrytis
cinerea in Arabidopsis and Tomato
Li Huang 1,2,† , Xiangjing Yin 1,2,† , Xiaomeng Sun 1,2, Jinhua Yang 1,2, Mohammad Zillur Rahman 1,2,
Zhiping Chen 3 and Xiping Wang 1,2,*
 1    State Key Laboratory of Crop Stress Biology in Arid Areas, College of Horticulture, Northwest A&F
      University, Yangling 712100, China; huanglimakeit@163.com (L.H.); yinxiangjingsmile@163.com (X.Y.);
      sxm1593843858@163.com (X.S.); 13759927085@163.com (J.Y.); zillurhrc_1976@yahoo.com (M.Z.R.)
 2    Key Laboratory of Horticultural Plant Biology and Germplasm Innovation in Northwest China, Ministry of
      Agriculture, Northwest A&F University, Yangling 712100, China
 3    Shanghai Vocational College of Agriculture and Forestry, Shanghai 201699, China; chenzp@shafc.edu.cn
 *    Correspondence: wangxiping@nwsuaf.edu.cn; Tel.: +86-29-8708-2129; Fax: +86-29-8708-2613
 †    These authors contributed equally to this work.

 Received: 1 September 2018; Accepted: 25 September 2018; Published: 30 September 2018

 Abstract: Stilbene synthase genes make a contribution to improving the tolerances of biotic and
 abiotic stress in plants. However, the mechanisms mediated by these STS genes remain unclear.
 To provide insight into the role of STS genes defense against biotic and abiotic stress, we overexpressed
 VqSTS36 in Arabidopsis thaliana and tomato (Micro-Tom) via Agrobacterium-mediated transformation.
 VqSTS36-transformed Arabidopsis lines displayed an increased resistance to powdery mildew,
 but both VqSTS36-transformed Arabidopsis and tomato lines showed the increased susceptibility
 to Botrytis cinerea. Besides, transgenic Arabidopsis lines were found to confer tolerance to salt
 and drought stress in seed and seedlings. When transgenic plants were treated with a different
 stress, qPCR assays of defense-related genes in transgenic Arabidopsis and tomato suggested that
 VqSTS36 played a specific role in different phytohormone-related pathways, including salicylic
 acid, jasmonic acid, and abscisic acid signaling pathways. All of these results provided a better
 understanding of the mechanism behind the role of VqSTS36 in biotic and abiotic stress.

 Keywords: stilbene synthase; grape; powdery mildew; Botrytis cinerea; salt stress; drought stress;
 tomato; arabidopsis

1. Introduction
     Stilbene synthase (STS) is a key enzyme for the synthesis of phytoalexin stilbenoids through
the polyphenol biosynthetic pathway [1]. These stilbenoids can be produced by a limited number of
plants species, including red pine, peanut, sorghum, and grape [2–5]; they are secondary metabolites
of plants with capacities of resistance against different environmental attacks [6,7], such as infection
by pathogens, salinity stress, or drought stress. However, the potential mechanism of STS genes in
pathogens resistance and its possible differential responses are still unclear. Further exploration is
required to investigate precise relationship between STS genes and biotic or abiotic stress.
     Grapevine is an economically important crop, but it is easily subjected to various pathogen
diseases [8]. Major fungal diseases, including powdery mildew, Botrytis cinerea, and downy mildew,
can cause severe yield losses and decline in fruit quality. It has been demonstrated that Vitis species,

Int. J. Mol. Sci. 2018, 19, 2985; doi:10.3390/ijms19102985                        www.mdpi.com/journal/ijms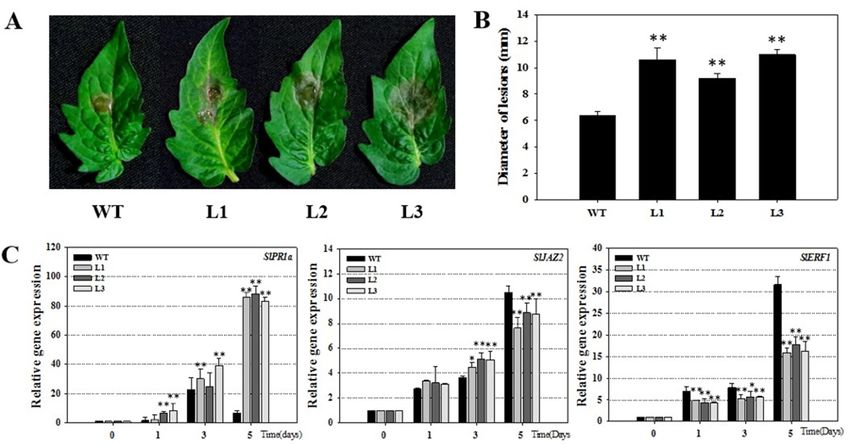
Int. J. Mol. Sci. 2018, 19, 2985                                                                      2 of 15

such as Vitis vinifera, V. labrusca, and V. rupestris, showed various levels of resistance to powdery mildew
disease caused by the fungus Uncinula necator [9]. Therefore, to reduce the threat of powdery mildew
disease on grape, it is feasible to use genetic materials from wild grape species to develop resistant
cultivars. Powdery mildew is a biotrophic pathogen, while the fungus B. cinerea is a necrotrophic
pathogen which colonizes dead plant tissues and leads to gray mold in fruits. These fungi release
a set of effector proteins into host cells to intervene the host immunity [10], including activating a
hypersensitive response and changing the expression profile of defense-related genes [10,11]. Invasion
by pathogens can induce relative plant hormones to respond. Generally, salicylic acid (SA) is effective
against biotrophic pathogens, whereas Jasmonic acid (JA) is active against necrotrophic fungi [12].
Expression of STS genes can also be increased in response to plant hormones, such as SA and jasmonate
acid (JA) [13–15]. Exogenous SA can reduce the cytosine DNA methylation of certain STS genes,
which results in significant increase in the expression of STS genes and the accumulation of resveratrol
in the cell cultures of V. amurensis [16].
     Water deficit is also a major limiting factor for economic agricultural products [17,18],
crop yield [19,20]. Furthermore, due to global warming, there will be an increase in aridity [17,21],
which will aggravate the salinization of land in some areas; Therefore, a water deficit becomes
another important limiting factor for grape yield and quality [17,22]. Osmotic stresses, including
drought and salinity stresses, not only have negative impacts on root development [23] but also
cause an accumulation of osmotic compounds and ions, which activate detoxifying processes [24,25],
thus threatening grapevine growth and development. In previous investigations, most research
focused on the influence of pathogen challenges or UV radiation stress on the changes of STS gene
expression and the accumulation of stilbene compounds; however, the role of STS genes in osmotic
stress is still unknown. Besides, some of STS genes also contributed to an increase tolerance of salt and
drought stresses [6,26], as well as disease resistance in grape. Therefore, functional STS genes with
biotic and abiotic stresses can be exploited for new grape breeding resources in the future.
     In the current study, we selected VqSTS36 gene based on our previous research. We inoculated
Chinese wild Vitis quinquangularis with powdery mildew and assessed the expression profiles of 31
STS genes. VqSTS36 displayed a response to this pathogen. Specifically, the expression levels of
VqSTS36 increased until reaching a peak at 12 h post-inoculation, which was earlier than other genes,
and then declined at subsequent time points [26]. As such, we selected the VqSTS36 gene for all further
functional analyses in this study. We transformed VqSTS36 in Arabidopsis and tomato to investigate
what role VqSTS36 plays in defense against different pathogen diseases and to allow understanding of
how VqSTS36 works in the resistance to osmotic stress.

2. Results

2.1. Transgenic VqSTS36 Arabidopsis Increase Resistance against Powdery Mildew
     Transformed Arabidopsis lines (L31, L35 and L36) and wild-type (WT) were inoculated with
powdery mildew. Observation of leaf surfaces of transgenic lines displayed that the lesion coverage
area was smaller than WT at 7 days post-inoculation (dpi), see Figure 1B, thus VqSTS36 enhanced
the disease resistance of transgenic Arabidopsis. To figure out the potential pathways causing the
difference between VqSTS36 transgenic Arabidopsis and WT in response to powdery mildew, we
measured the cell death and superoxide anions (O2 − ) in inoculated leaves. As proven by the increased
staining in inoculated leaves after being stained with trypan blue, see Figure 1C, and nitro blue
tetrazolium (NBT), see Figure 1D, transgenic lines accumulated a greater number of cell death and
more O2 − than WT. Analysis of qPCR assays for relative gene expression of SA- and JA-related genes,
see Figure 1E, in transformed lines and WT at 0, 1, 3, 4 and 7 dpi, respectively. AtPR1 and AtNPR1
are the key components in the SA-mediated signal pathway. Gene expression of AtPR1 reached a
peak at 4 dpi, and was significantly higher than WT. Meanwhile, AtNPR1 expression reached a peak
value of 4 dpi and showed the level of expression was higher than WT. Conversely, AtPDF1.2, a very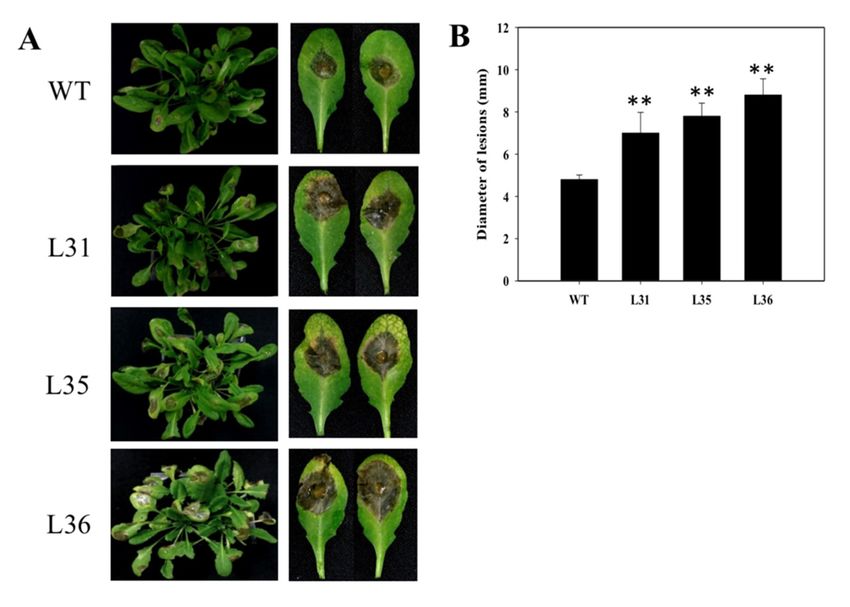
Int. J. Mol.
Int. J.Sci.
Mol.2018, 19, 2985
Sci. 2018, 19, x 3 of 153 of 15
value of 4 dpi and showed the level of expression was higher than WT. Conversely, AtPDF1.2, a very
important genegene
important in the JA JA
in the biosynthetic
biosyntheticpathway,
pathway, was increasedininboth
was increased both transgenic
transgenic Arabidopsis
Arabidopsis lines lines
and WT,
and WT, but AtPDF1.2
but AtPDF1.2 expression
expression inintransgenic
transgenic plants
plants were
weremuch
muchlower
lowerthan in WT
than afterafter
in WT a value of of
a value
1 dpi following the infection of powdery mildew, see
1 dpi following the infection of powdery mildew, see Figure 1E.Figure 1E.
A E 180
160
AtPR1
**
WT
L31
L35
Relative gene expression
140 L36
CaMV35S VqSTS36 120 **
100
**
pCambia 2300 vector 40
20
****
**
**** **
WT L31 L35 L36 0
B 12
0 1 4 7 Time (Days)
AtNPR1 WT
L31
** L35
Relative gene expression
10
L36
8 **
**
6
4
2 ****
**
0
0 1 4 7 Time (Days)
10
AtPDF1.2 WT
L31
Relative gene expression
L35
8
C L36
6
4
**
D 2 ** **
****
**
******
0
0 1 4 7 Time (Days)
Figure 1. Performance of VqSTS36 transgenic Arabidopsis following inoculation with powdery mildew and
Figure 1. Performance of VqSTS36 transgenic Arabidopsis following inoculation with powdery
expression of defense-related genes. (A) Vector map of pCambia 2300:CaMV35S-VqSTS36. (B) Representative
mildew and expression of defense-related genes. (A) Vector map of pCambia 2300:CaMV35S-
images of plants were taken at 7 days post-inoculation (dpi). (C) Trypan blue to detect cell death on leaves
VqSTS36. (B) Representative images of plants were taken at 7 days post-inoculation (dpi). (C) Trypan
was used at 4 dpi. (D) Nitro blue tetrazolium (NBT) staining to detect superoxide anion accumulation,
blue to detect cell death on leaves was used at 4 dpi. (D) Nitro blue tetrazolium (NBT) staining to
as noted by arrows. (E)
detect superoxide Relative
anion expression
accumulation, levelsby
as noted of arrows.
defense-related genes
(E) Relative in leaves
expression collected
levels at 0, 1, 4,
of defense-
and 7related
dpi. Data represent mean values ± SD (with values from time point 0 hours post-inoculated
genes in leaves collected at 0, 1, 4, and 7 dpi. Data represent mean values ± SD (with values (hpi) set
to 1) from
from three independent
time point experiments. Asterisks
0 hours post-inoculated indicate
(hpi) set to 1) fromsignificant differences
three independent between wild-type
experiments. Asterisks (WT)
and transgenic lines as determined
indicate significant differencesby Student’s
between t-test. (**(WT)
wild-type p < 0.01).
and transgenic lines as determined by
Student’s t-test. (** p < 0.01).
2.2. Over-Expression of VqSTS36-Enhanced Arabidopsis and Tomato Susceptibility to Botrytis Cinerea by
Inducing the SA-Mediated
2.2. Over-Expression of Signaling PathwayArabidopsis and Tomato Susceptibility to Botrytis Cinerea by
VqSTS36-Enhanced
Inducing the SA-Mediated Signaling Pathway
Powdery mildew is a biotrophic pathogen, VqSTS36 increases the resistance against it in
Arabidopsis Powdery mildew isana SA
by activating biotrophic pathogen, However,
signal pathway. VqSTS36 increases the resistance
in this case, againstwhat
to investigate it in kind
Arabidopsis by activating an SA signal pathway. However, in this case, to
of signaling metabolic pathway would be involved when VqSTS36 transgenic plants were subjected investigate what kind of
signaling metabolic pathway would be involved when VqSTS36 transgenic plants
with the necrotrophic pathogen, B. cinerea, we assessed the influence of B. cinereal infection on plants. were subjected
with the necrotrophic pathogen, B. cinerea, we assessed the influence of B. cinereal infection on plants.
First, after infected transgenic and WT Arabidopsis with B. cinerea for 5 days, the leaves presented
First, after infected transgenic and WT Arabidopsis with B. cinerea for 5 days, the leaves
chlorosis, oil-like lesions, and visible mycelium. However, transgenic plants showed more the number
presented chlorosis, oil-like lesions, and visible mycelium. However, transgenic plants showed more
of diseased leaves
the number of than WT,leaves
diseased and the lesion
than WT, diameters of the
and the lesion transgenic
diameters lines
of the (0.7 to 0.85
transgenic linescm)
(0.7 were
to 0.85larger
than WT (0.48 cm, Figure 2A,B), which suggested the degree of decaying leaves from
cm) were larger than WT (0.48 cm, Figure 2A,B), which suggested the degree of decaying leaves from transgenic plants
was more serious
transgenic thanwas
plants thatmore
of WT. Three
serious days
than after
that inoculation,
of WT. Three days the accumulations
after inoculation, theof dead cells and O2 −
accumulations
in theofleaves wereand
dead cells detected by leaves
O2− in the trypanwereblue, see Figure
detected 3A, and
by trypan NBT
blue, see staining,
Figure 3A,seeandFigure 3B, respectively.
NBT staining, see
Figure 3B, respectively. It was found that both these two indexes accumulated
It was found that both these two indexes accumulated in transgenic Arabidopsis leaves were more than in transgenic
Arabidopsis
that in leavesPCR
WT. Real-time werewas
more thantothat
used in WT.the
analyze Real-time PCR levels
expression was used to analyze the expression
of resistance-related genes in A.
thaliana after inoculation. The results exhibited that AtPR1 gene, a key gene inexhibited
levels of resistance-related genes in A. thaliana after inoculation. The results that AtPR1
SA signaling pathways,
was up-regulated in both transformed Arabidopsis and WT from 1 dpi onward. But compared to
WT, relative expression of AtPR1 were much higher in transgenic Arabidopsis, especially at 3 dpi,
with values reached a peak (129 to 178) that was two to three times as high as that of WT Arabidopsis;
however the relative expression of AtNPR1 gene in transgenic lines and WT were slightly up-regulated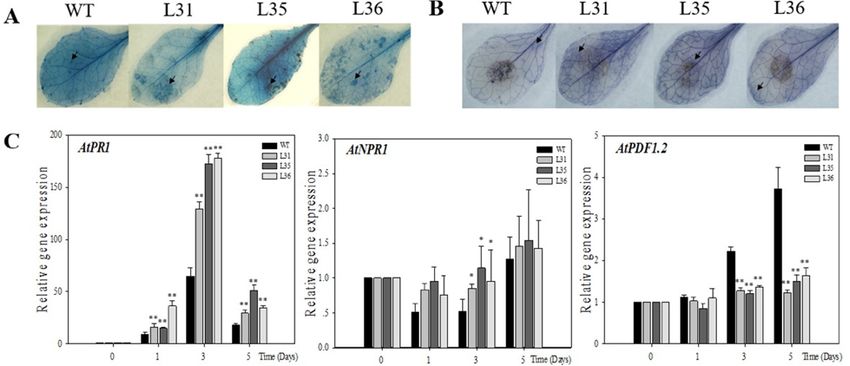
Int. J. Mol. Sci. 2018, 19, x 4 of 15
Int. J. Mol. Sci. 2018, 19, x 4 of 15
gene,
gene,a key gene
a key genein in
SASA signaling
signalingpathways,
pathways, waswas up-regulated
up-regulated in in
bothboth transformed
transformed Arabidopsis
Arabidopsis andand
WT
Int. J. Mol.WT
from
Sci. from
1 dpi
1 dpi
2018, 19,
onward. But compared to WT, relative expression of AtPR1
2985onward. But compared to WT, relative expression of AtPR1 were much higher4in
were much higher in of 15
transgenic
transgenic Arabidopsis,
Arabidopsis, especially
especiallyat at
3 dpi, with
3 dpi, with values
valuesreached
reacheda peak
a peak (129 to to
(129 178) that
178) was
that wastwo
twoto to
three times as high as that of WT Arabidopsis; however the relative expression
three times as high as that of WT Arabidopsis; however the relative expression of AtNPR1 gene of AtNPR1 gene in in
transgenic
at 5 dpi, and there
transgenic lines and
was
lines WT
andalmostwere
WT were slightly
no slightlyup-regulated
significant at 5 dpi,
different,at see
up-regulated and
Figure
5 dpi, there
and there was
3C. The almost
was relativeno
almost no significant
expression
significant of
different,
AtPDF1.2, different, seesee
a JA-relatedFigure 3C.3C.The relative
signal-responsive
Figure The expression
gene,
relative of of
increased
expression AtPDF1.2,
slightlyain
AtPDF1.2, JA-related
a transgenic
JA-related signal-responsive
Arabidopsis lines,
signal-responsive gene,while
gene,
increased
increased slightly
slightlyin transgenic
in transgenic Arabidopsis
Arabidopsis lines, while
lines, whilein WT
in WTit was
it wasenhanced
enhanced andandsignificantly
significantly
in WT it was enhanced and significantly higher than that in transformed plants from 3 dpi onward,
higher
higher than
thanthat in in
that transformed
transformed plants from
plants 3 dpi
from 3 dpionward,
onward, seesee
Figure
Figure 3C.3C.
see Figure 3C.
Figure 2. The
Figure performance
2. The performance of VqSTS36
of VqSTS36 transgenic
transgenic Arabidopsis
Arabidopsis subjected
subjected with
with Botrytis
Botrytis cinerea.
cinerea. (A) The
(A)(A)
The
Figure 2. The performance of VqSTS36 transgenic Arabidopsis subjected with Botrytis cinerea. The
symptom of plants
symptom subjected
of of
plants with B.
subjected cinerea
with B. B. after 5after
cinerea days. (B) Statistics
5 days. (B)(B) of lesions
Statistics of ofdiameter.
lesions Data represent
diameter. Data
symptom plants subjected with cinerea after 5 days. Statistics lesions diameter. Data
meanrepresent
values ±mean
represent
SD from
meanvaluesthree
± SD
values
independent
± SD from three
from three
experiments.
independent
independent
Asterisks Asterisks
experiments.
experiments.
indicate
Asterisks
significant
indicate differences
significant
indicate significant
differences
between WT and between WT
transgenic and
linestransgenic
as lines
determined as determined
by Student’s by Student’s
t-test (** p t-test
< (**
0.01).
differences between WT and transgenic lines as determined by Student’s t-test (** p < 0.01). p < 0.01).
FigureFigure 3. Expression
Expression
3.Figure 3. Expression of defense-related
of defense-related
of defense-related genes
genes genesafter
after VqSTS36
VqSTS36
after VqSTS36 transgenic
transgenic
transgenicArabidopsis
Arabidopsis
Arabidopsis inoculated with
inoculated
inoculated with
with
Botrytis cinerea. (A) Trypan blue staining to detect cell death after 3 days plants subjected with B. B.
Botrytis Botrytis
cinerea.cinerea. (A) Trypan
(A) Trypan blueblue staining
staining to todetect
detectcell
cell death
death after
after3 3days
daysplants subjected
plants with
subjected with
cinerea. (B)(B)
cinerea. Trypan
Trypan blue staining to detect cellcell
death. (C)(C)Relative expression levels of defense-related
B. cinerea. (B) Trypan blueblue staining
staining to detect
to detect death.
cell death. Relative
(C) Relative expression
expression levels
levelsofofdefense-related
defense-related
genes in leaves collected at 0, 1, 3 and 5 days post-inoculation (dpi). Data represent mean values ± SD
genes ingenesleavesin leaves collected
collected at 0,at1,0,31,and
3 and5 5days
days post-inoculation
post-inoculation (dpi). Data
(dpi). represent
Data mean
represent values
mean ± SD
values
(with values from time point 0 hpi set to 1) from three independent experiments.
(with values from time point 0 hpi set to 1) from three independent experiments. Asterisks indicate Asterisks indicate
± SDsignificant
(with values from time point WT 0 hpi set transgenic
to 1) from three as independent experiments. Asterisks
significantdifferences
differencesbetween
between WTand and transgeniclines lines asdetermined
determinedby byStudent’s
Student’st-test
t-test
indicate significant
(* 0.01 < p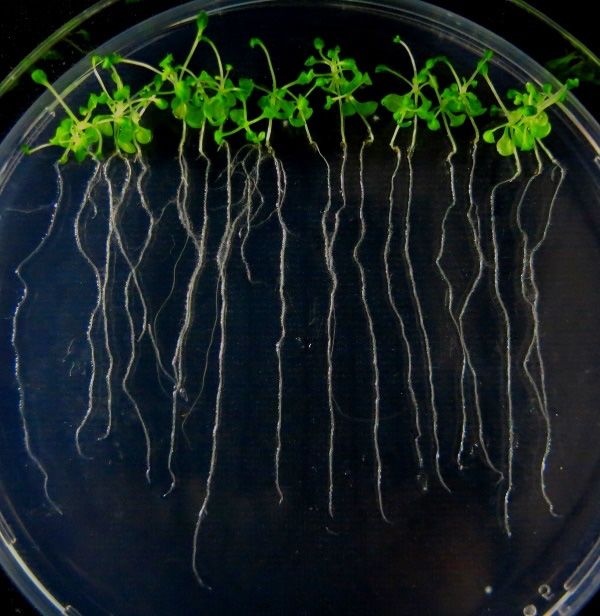
Int. J. Mol. Sci. 2018, 19, 2985 5 of 15
To
Int.verify the2018,
J. Mol. Sci. results
19, x for transgenic Arabidopsis, we detect the disease defense of tomato. We introduced 5 of 15
VqSTS36 gene into tomato (Micro-Tom, Supplementary Figure S1). VqSTS36-transformed tomato lines,
along with Towild-type
verify the plants
results were
for transgenic
infectedArabidopsis,
with B. cinereawe and
detect the disease
assessed for 5defense
days. of tomato.
After We
inoculation,
introduced VqSTS36 gene into tomato (Micro-Tom, Supplementary Figure
leaf surfaces showed oil stains, and visible hypha, see Figure 4A. Furthermore, transgenic tomatoes S1). VqSTS36-transformed
tomato lines, along with wild-type plants were infected with B. cinerea and assessed for 5 days. After
displayed more serious disease symptoms than WT at 4 dpi, see Figure 4A,B. The diameter of
inoculation, leaf surfaces showed oil stains, and visible hypha, see Figure 4A. Furthermore, transgenic
lesion of WT was about 6.4 mm, which was smaller than transformed tomato lines (L1, L2, and L3
tomatoes displayed more serious disease symptoms than WT at 4 dpi, see Figure 4A,B. The diameter
are about 10.6, 9.2, and 11 mm, respectively, see Figure 4B). To gain insight into the pathway
of lesion of WT was about 6.4 mm, which was smaller than transformed tomato lines (L1, L2, and L3
controlling
are about these 10.6,alterations
9.2, and 11 VqSTS36
in mm, transgenic
respectively, tomato4B).
see Figure in To
response to B. into
gain insight cinerea, we detected
the pathway
the relative
controllingexpression of several
these alterations SA- andtransgenic
in VqSTS36 JA/ET-mediated
tomato in genes
response at 0, 1, cinerea,
to B. 3, and we 5 dpi, respectively,
detected the
see Figure
relative4C. Through
expression of qRT-PCR
several SA-analysis, the relativegenes
and JA/ET-mediated expression level
at 0, 1, 3, and of SlPR1a
5 dpi, [27] associated
respectively, see
Figure 4C. Through
with SA-responsive geneqRT-PCR analysis, the
in the transgenic relative
tomato wasexpression level up-regulated
significantly of SlPR1a [27] fromassociated
1 dpiwith
onward,
SA-responsive
and higher than those gene in in the transgenic
wild-type tomato was
tomato. significantly
Although, up-regulated
SlJAZ2 and SlERF1 from [28]
1 dpiareonward,
maker and genes
higherby
regulated than those in wild-type
JA/ET-mediated tomato.signaling
defense Although,pathways,
SlJAZ2 andwereSlERF1 [28] are maker
significantly genes regulated
up-regulated in both
by JA/ET-mediated defense signaling pathways, were significantly up-regulated in both transformed
transformed and WT tomatoes following exposure to B. cinerea, the increase in transgenic lines was
and WT tomatoes following exposure to B. cinerea, the increase in transgenic lines was significantly
significantly smaller than WT at 5 dpi, see Figure 4C. The related gene expression suggested that
smaller than WT at 5 dpi, see Figure 4C. The related gene expression suggested that VqSTS36 may
VqSTS36induce may theinduce
plant’sthe plant’s system
immunity immunity system
through SA through SA and
and JA signals at JA
thesignals at the
early stage of early stage of the
the infection.
infection.
However, with the corresponding enhancement of the SA responses, the JA pathway was was
However, with the corresponding enhancement of the SA responses, the JA pathway
suppressed.
suppressed. Therefore, thethe
Therefore, increases ininSlJAZ2
increases and SlERF1were
SlJAZ2and slower
SlERF1were slower than
than WTWT at 5atdpi,
5 dpi, as shown
as shown
in Figure 4C. 4C.
in Figure
FigureFigure
4. The4.assessment
The assessment of VqSTS36
of VqSTS36 transgenic
transgenic tomato
tomato lines subjected
lines subjected to Botrytis
to Botrytis cinerea.cinerea.
(A) The (A) The
symptoms
of thesymptoms
transformed of the transformed
tomato and antomato and an untransformed
untransformed one subjectedonewith
subjected withafter
B. cinerea B. cinerea after(B)
4 days. 4 days.
Statistics
(B) Statistics
of lesions’ of lesions’
diameter. diameter.
(C) Relative (C) Relative
expression expression
levels levels of defense-related
of defense-related genescollected
genes in leaves in leaves at 0,
collected at 0, 1, 3 and 5 dpi. Data represent mean values ± SD from three independent experiments.
1, 3 and 5 dpi. Data represent mean values ± SD from three independent experiments. Asterisks
Asterisks indicate significant differences between WT and transgenic lines as determined by Student’s
indicate significant differences between WT and transgenic lines as determined by Student’s t-test
t-test (* 0.01 < p < 0.05, ** p < 0.01).
(* 0.01 < p < 0.05, ** p < 0.01).
2.3. Over-Expression of VqSTS36 Enhanced the Tolerance of Arabidopsis Seedlings to Salt and Drought
2.3. Over-Expression of VqSTS36 Enhanced the Tolerance of Arabidopsis Seedlings to Salt and Drought Stresses
Stresses
The seed germination rate under osmotic stress is important for the tolerance of plants. So the
The seed germination rate under osmotic stress is important for the tolerance of plants. So the T3
T3 transgenic
transgenic andWT
and Arabidopsisseeds
WT Arabidopsis seeds were
were sownsown
into into the medium
the medium supplemented
supplemented with 130 with
mM NaCl130 mM
NaClor or250
250mM
mM mannitol
mannitol to simulate
to simulate salts
salts or aridorenvironments,
arid environments, respectively.
respectively. The resultsThe results
showed thatshowed
the
that the
seedseed germination
germination rate ofrate of transgenic
transgenic Arabidopsis
Arabidopsis was significantly
was significantly higher
higher than that than
of WT, seethat of WT,
Figure
5A,B. After 10 days from the time the seeds were subjected with Mannitol and
see Figure 5A,B. After 10 days from the time the seeds were subjected with Mannitol and NaCl stress,NaCl stress, the
accumulationof
the accumulation O22−−inintransgenic
of O transgenic lines waswas
lines lessless
thanthan
that in
thatWT,
insee
WT,Figure 5C,D, indicating
see Figure that the that
5C,D, indicating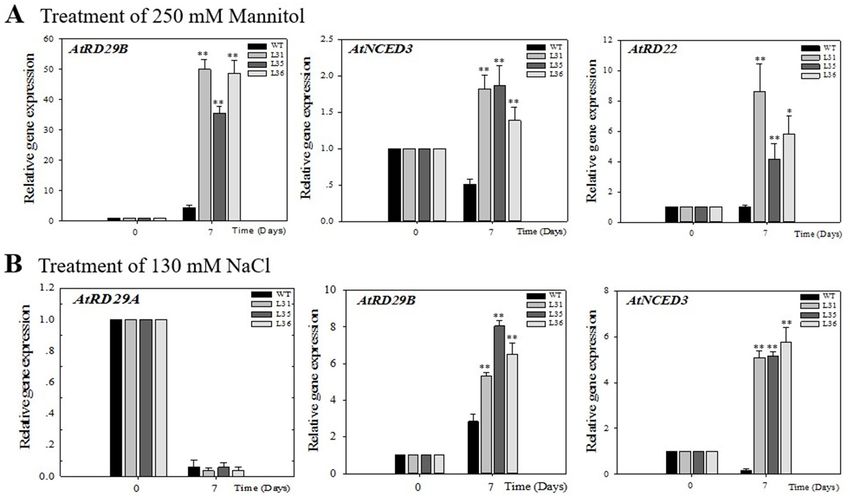
Int.J. J.Mol.
Int.       Mol.Sci.
                Sci.2018,  19,x 2985
                     2018,19,                                                                                                                                                   6 6ofof1515

expression of VqSTS36 in transgenic Arabidopsis was beneficial for increasing seed resistance to
 the expression of VqSTS36 in transgenic Arabidopsis was beneficial for increasing seed resistance to
osmotic stress.
 osmotic stress.

        A                        Treatment of 250 mM Mannitol                                                                                              C     NBT Staining
         WT                           L36                                  120
                                                                                     WT
                                                                                     L31
                                                                           100       L35

                                             Cotyledon greening rate (%)
                                                                                     L36

                                                                            80

                                                                            60
                                                                                                                                                               WT      L36
                                                                            40

                                                                            20

                                                                             0

        L31                            L35                                       0         1       2   3   4       5       6   7   8       9   10 (Days)       L31     L35

        B                          Treatment of 130 mM NaCl                                                                                                D     NBT Staining
         WT                             L36 120                                      WT
                                                                                     L31
                                             Cotyledon greening rate (%)

                                                                           100       L35
                                                                                     L36

                                                                            80

                                                                            60
                                                                                                                                                               WT      L36
                                                                            40

                                                                            20

                                                                             0

         L31                           L35                                           0         1       2       3       4       5       6       7 (Days)        L31     L35

        Figure 5. Cotyledon greening rates of VqSTS36 transgenic Arabidopsis lines following the induction
       Figure 5. Cotyledon greening rates of VqSTS36 transgenic Arabidopsis lines following the induction
        of osmotic stress. Homozygous seeds from VqSTS36 transgenic lines (L31, L35, and L36) and
       of osmotic stress. Homozygous seeds from VqSTS36 transgenic lines (L31, L35, and L36) and
        untransformed controls (WT) were placed on MS medium added with 250 mM mannitol (A) and
       untransformed controls (WT) were placed on MS medium added with 250 mM mannitol (A) and 130
        130 mM NaCl (B), respectively, and assessed for cotyledon greening rates.Cotyledon greening rates
       mM NaCl (B), respectively, and assessed for cotyledon greening rates.Cotyledon greening rates were
        were assessed daily following the initiation of each treatment. Representative images of plants were
       assessed daily following the initiation of each treatment. Representative images of plants were taken
        taken 10 days after seeds were plated on an osmotic stress-inducing medium. Data represent mean
       10 days after seeds were plated on an osmotic stress-inducing medium. Data represent mean values
        values from three independent experiments. (C) and (D) NBT staining for seedlings treated with
       from three independent experiments. (C) and (D) NBT staining for seedlings treated with drought
        drought and salt stresses.
       and salt stresses.
        In this study, we also detected the changes of root length under osmotic stress to measure the
      In this study, we also detected the changes of root length under osmotic stress to measure the
  resistance of transgenic A. thaliana seedlings. Drought and high concentrations of salt can inhibit plant
resistance of transgenic A. thaliana seedlings. Drought and high concentrations of salt can inhibit plant
  root development and its nutrient absorption [13]. After 7 days of treatment with 130 mM NaCl and
root development and its nutrient absorption [13]. After 7 days of treatment with 130 mM NaCl and
  250 mM mannitol, compared with control, the root length of transgenic and WT Arabidopsis seedlings
250 mM mannitol, compared with control, the root length of transgenic and WT Arabidopsis
 were shortened, but the root length of VqSTS36 transgenic seedlings were longer than that of WT,
seedlings were shortened, but the root length of VqSTS36 transgenic seedlings were longer than that
  see Figure 6A,B. While chlorophyll content was determined to be significantly higher in VqSTS36
of WT, see Figure 6A,B. While chlorophyll content was determined to be significantly higher in
  transgenic lines than WT following osmotic stress, it was significantly reduced in transgenic lines,
VqSTS36 transgenic lines than WT following osmotic stress, it was significantly reduced in transgenic
  see Figure 6C. These results suggested that heterologous expression of VqSTS36 yields plants that are
lines, see Figure 6C. These results suggested that heterologous expression of VqSTS36 yields plants
  better able to withstand drought and salinity as evidenced by less chlorosis. The results showed that
that are better able to withstand drought and salinity as evidenced by less chlorosis. The results
  transgenic Arabidopsis increased its ability to resist osmotic stress.
showed that transgenic Arabidopsis increased its ability to resist osmotic stress.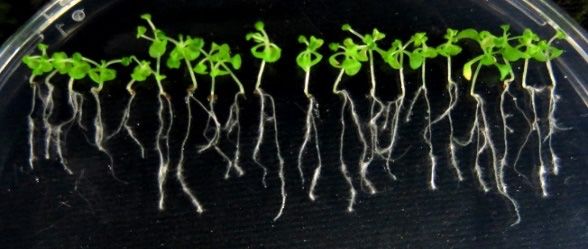
Int. J. Mol. Sci. 2018, 19, 2985 7 of 15
Int. J. Mol. Sci. 2018, 19, x 7 of 15
B 6
A Control Treatment of 250 mM Mannitol 5
WT
L31
L35
L36
Root length (cm)
4
3
** ** **
2 ** **
*
1
WT L31 L35 L36
0
MS Mannitol NaCl
Treatment of 130 mM NaCl
C 20
WT
L31
Chlorophyll content (mg/g)
L35
15 L36
* ****
10
* * **
WT L31 L35 L36 WT L31 L35 L36 5
0
MS Mannitol NaCl
Figure 6.
Figure Theeffect
6. The effectofofosmotic
osmotic stress
stress onon seedlings
seedlings of VqSTS36
of VqSTS36 transgenic
transgenic Arabidopsis
Arabidopsis seedlings.
seedlings. (A)
(A) Five-day old transgenic (L31, L35, and L36) and untransformed seedlings were transferred
Five-day old transgenic (L31, L35, and L36) and untransformed seedlings were transferred from MS from MS
plates to new MS plate, MS supplemented with 130 mM NaCl, 250 mM mannitol.
plates to new MS plate, MS supplemented with 130 mM NaCl, 250 mM mannitol. Representative Representative images
were taken.
images were(B) Root(B)
taken. lengths
Root were
lengthsmeasured 7 days after
were measured the initiation
7 days after the of osmoticofstress
initiation treatment.
osmotic stress
(C) 7 days old VqSTS36 transgenic (L31, L35, and L36) and WT seedlings were transferred
treatment. (C) 7 days old VqSTS36 transgenic (L31, L35, and L36) and WT seedlings were transferred from the
MS medium to an MS medium supplemented with 250 mM mannitol, 130 mM NaCl, and chlorophyll
from the MS medium to an MS medium supplemented with 250 mM mannitol, 130 mM NaCl, and
content was assessed 7 days following the initiation of osmotic stress treatments. Data represent mean
chlorophyll content was assessed 7 days following the initiation of osmotic stress treatments. Data
values ± SD from three independent experiments. Asterisks indicate significant differences between
represent mean values ± SD from three independent experiments. Asterisks indicate significant
WT and transgenic lines as determined by Student’s t-test (* 0.01 < p < 0.05, ** p < 0.01).
differences between WT and transgenic lines as determined by Student’s t-test (* 0.01 < p < 0.05,
** p < 0.01).
2.4. Profile Expression of VqSTS36 Transgenic Arabidopsis Seedlings Respond to Osmotic Stress.
In order
2.4. Profile to explore
Expression the potential
of VqSTS36 signal
Transgenic Arabidopsis of VqSTS36
pathwaySeedlings to enhance
Respond to Osmotic Arabidopsis
Stress. stress
tolerance resistance, this study analyzed the expression profile of stress-related genes, including
In order
AtRD29A, to explore
AtRD29B, the potential
AtRD22, and AtNCED3 signalgenes,
pathway of VqSTS36
in transgenic to enhance
Arabidopsis Arabidopsis
seedlings after 7stress
days
tolerance resistance, this study analyzed the expression profile of stress-related
of salt and drought treatment, see Figure 7A,B. The AtRD29A and AtRD29B genes are important genes, including
AtRD29A, AtRD29B, of
genes downstream AtRD22,
the ABA andbiosynthetic
AtNCED3 genes, in transgenic
pathway Arabidopsis
[29], AtRD22 is not seedlings
only involvedafter 7indays
the
of salt and drought treatment, see Figure 7A,B. The AtRD29A and AtRD29B
response of ABA signaling to abiotic stress but also has a response to dehydration [30]; AtNCED3 genes are important is
genes downstream of the ABA biosynthetic pathway [29], AtRD22 is not only
the indicator of ABA biosynthesis [31]. Real-time quantitative analysis showed that after drought involved in the
response
treatmentof ofABA signaling
Arabidopsis to abioticthe
seedlings, stress but alsoofhas
expression a response
AtRD29B, to dehydration
AtNCED3, and AtRD22[30]; in
AtNCED3
transgenic is
the indicator of ABA biosynthesis [31]. Real-time quantitative analysis showed that after
Arabidopsis were up-regulated by 35- to 50-fold, 1.4- to 1.9-fold and 4- to 8-fold, respectively, which was drought
treatment
significantlyof higher
Arabidopsis seedlings,
than that the expression
of transcription level inof
WTAtRD29B, AtNCED3,
seedlings, see Figureand 7A.AtRD22 in transgenic
Under salt treatment,
Arabidopsis werelevel
the transcription up-regulated
of AtRD29A by 35-
wastodown-regulated
50-fold, 1.4- to 1.9-fold and 4-notoobvious
and showed 8-fold, respectively, which
difference between
was significantly higher than that of transcription level in WT seedlings, see
the transgenic and WT Arabidopsis seedlings. While the expression of AtRD29B was up-regulated
Figure 7A. Under salt
treatment, the transcription level of AtRD29A was down-regulated and showed no obvious
5- to 8-fold in VqSTS36 over-expressing Arabidopsis seedlings, with a value higher than in WT.
difference between the transgenic and WT Arabidopsis seedlings. While the expression of AtRD29B
Besides, AtNCED3 expression was increased 5-fold but was down-regulated in the WT, see Figure 7B.
was up-regulated 5- to 8-fold in VqSTS36 over-expressing Arabidopsis seedlings, with a value higher
than in WT. Besides, AtNCED3 expression was increased 5-fold but was down-regulated in the WT,
see Figure 7B.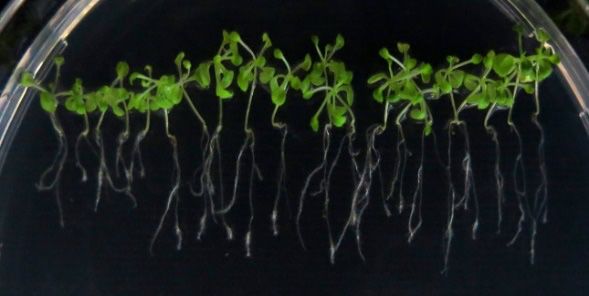
Int. J. Mol. Sci. 2018, 19, 2985 8 of 15
Int. J. Mol. Sci. 2018, 19, x 8 of 15
Figure 7. Assessment
Figure of theof
7. Assessment expression of stress-related
the expression genesgenes
of stress-related in Arabidopsis seedlings
in Arabidopsis after treatment
seedlings after
treatment with osmotic stress is shown in (A) and (B). The relative expression levels
with osmotic stress is shown in (A) and (B). The relative expression levels of osmotic stress-responsive of osmotic
genesstress-responsive
were assayed ingenes were via
seedlings assayed
qPCRin7 seedlings via qPCR
days following 7 daysoffollowing
initiation initiation
salt (A) and drought of (B).
salt Data
(A) and drought (B). Data represent mean values ± SD from three independent experiments.
represent mean values ± SD from three independent experiments. Asterisks indicate significant
Asterisks indicate significant differences between WT and transgenic lines as determined by Student’s
differences between WT and transgenic lines as determined by Student’s t-test (* 0.01 < p < 0.05, ** p <
t-test (* 0.01 < p < 0.05, ** p < 0.01).
0.01).
3. Discussion
3. Discussion
Pathogens disease, drought, and high salinity can cause serious damage to plant growth and
development,
Pathogens disease,fruit yield, and quality.
drought, and highGrapevine
salinityis an
canagriculturally
cause serious economic
damage fruit,
to which
plant is easily and
growth
development, fruit yield, and quality. Grapevine is an agriculturally economic fruit, whichonly
attacked by biotic and abiotic stress from the environment. Fortunately, STS genes can not is easily
enhance plant’s disease resistance [32] but also benefit human health by synthesizing phytoalexins [33].
attacked by biotic and abiotic stress from the environment. Fortunately, STS genes can not only
Therefore, the research of functional STS genes can provide a genetic resource for new grape breeding
enhance plant’s disease resistance [32] but also benefit human health by synthesizing phytoalexins
in the future.
[33]. Therefore, the research of functional STS genes can provide a genetic resource for new grape
However, even if grapevines possess STS genes, different resistance are demonstrated by
breeding in the future.
the varieties of species. For example, European varieties of grapevine are highly susceptible to
However,
powdery even if
mildew, grapevines
while possess
18 Vitis species STS genes,
derived different
from China wereresistance
demonstrated are carry
demonstrated
resistance to by the
varieties of species.
powdery mildewFor example,
[34]. In orderEuropean
to explore varieties
role of STS ofgenes
grapevine are highly
in disease susceptible
resistance, STS genes to have
powdery
mildew,
been while 18 Vitis
successfully species derived
introduced in differentfrom Chinasuch
species, wereas demonstrated
white poplar [35], carry resistance
apple to powdery
[36], lettuce [37],
papaya
mildew [34].[38],
In Arabidopsis
order to explore[39], tomato
role of [40,41], hop [42],
STS genes in grape
disease [4],resistance,
and kiwifruitSTS[43]. Although,
genes have been
in most cases, the resistance of transgenic lines to fungal infections was increased
successfully introduced in different species, such as white poplar [35], apple [36], lettuce [37], papaya to some extent,
[38],pathogen
Arabidopsis invasion
[39], was
tomatooften not eradicated
[40,41], hop [42],completely
grape [4], and and instead
kiwifruit morbidity were justinpartially
[43]. Although, most cases,
alleviated or postponed [41,43]. Vitis stilbene synthase gene introduced into kiwifruit (Actinidia deliciosa)
the resistance of transgenic lines to fungal infections was increased to some extent, pathogen invasion
did not enhance the resistance to B. cinerea [43]. Heterologous expression of STS in transgenic
was often not eradicated completely and instead morbidity were just partially alleviated or
tomatoes increased resistance against Alternaria solani but not B. cinerea [41]. Besides, after the
postponed [41,43]. Vitis stilbene synthase gene introduced into kiwifruit (Actinidia deliciosa) did not
inoculation of powdery mildew, the transcription level of STS genes was significantly enhanced
enhance the
in powdery resistance to B. cinerea
mildew-susceptible [43]. compared
V. vinifera Heterologous to thatexpression
in powderyof STS in transgenic
mildew-resistant tomatoes
V. aestivalis,
increased
which resistance
implied that against Alternaria
resistance to powderysolanimildew
but notinB. V. cinerea
aestivalis[41].
wasBesides, after
not related thechanges
to the inoculationin of
powdery mildew, the
the transcriptome of transcription
the STS genes [44]. levelThey
of STSalso genes was endogenous
found that significantly SAenhanced
levels wereinhigher
powdery
mildew-susceptible
in V. aestivalis thanV.V.vinifera compared
vinifera in the absence to of
that in powdery
powdery mildew,mildew-resistant
while SA levels were V. aestivalis,
enhanced in which
V. vinifera
implied that post-infection
resistance toofpowdery
the fungi [44]. In ourin
mildew study, over-expressing
V. aestivalis was not VqSTS36 in Arabidopsis
related to the changesshowed in the
an enhanced disease resistance to powdery mildew, see Figure 1B, but VqSTS36
transcriptome of the STS genes [44]. They also found that endogenous SA levels were higher in V. transgenic Arabidopsis
and tomato
aestivalis than V. lines instead
vinifera inincreased
the absence the susceptibility
of powderytomildew,Botrytis cinerea,
whilesee SAFigures
levels 2were
and 4A. It meansin V.
enhanced
vinifera post-infection of the fungi [44]. In our study, over-expressing VqSTS36 in Arabidopsis showed
an enhanced disease resistance to powdery mildew, see Figure 1B, but VqSTS36 transgenic
Arabidopsis and tomato lines instead increased the susceptibility to Botrytis cinerea, see Figures 2 and
4A. It means that resistance to different pathogens of VqSTS36 in transgenic plants may be associated
with the different signal pathways in plants.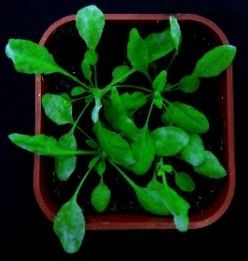
Int. J. Mol. Sci. 2018, 19, 2985                                                                       9 of 15

that resistance to different pathogens of VqSTS36 in transgenic plants may be associated with the
different signal pathways in plants.
     Both resistances to pathogens and susceptibility of VqSTS36 were linked to the variation in
the SA defense signal response in the transgenic plants. SA plays a pivotal role in plant defense
as well as the activation of defense responses to biotrophic pathogens by inducing the expression
of pathogenesis-related (PR) gene [45]. A flexible signaling network between SA and JA was
demonstrated to allow plants to adjust their defense responses to invaders [46]. Biotrophic pathogens
are more generally deterred by SA-mediated defenses, whereas necrotrophic pathogens are commonly
sensitive to JA/ET-mediated responses [47,48]. Previous studies showed that both SA and JA
messengers can be antagonistic. Induction of the SA response, either by pathogens inoculation
or by application of exogenous SA, strongly restrained JA-related genes [49,50]. An exopolysaccharide,
produced by B. cinerea, could induce the SA pathway response, which caused the promotion of
disease morbidity. Plant cell death is believed to be facilitated by producing an oxidative burst
activated by the host cells in reaction to B.cinerea [14]. In this study, both necrotrophic and biotrophic
pathogens significantly induced the SA signaling pathway while inhibiting the JA response in
VqSTS36-transformed Arabidopsis, which lead to an enhanced resistance against powdery mildew,
but an increased susceptibility to B. cinerea, see Figures 1E, 3C and 4C. Identically, VqSTS36 transgenic
tomato also provided evidence.
     UV irradiation can cause serious damage on the growth and development of plants by triggered
reactive oxygen species (ROS), while it has been proven that STS gene and its production can protect
plants by reducing the accumulation of ROS [51]. The antioxidant activity of STS gene in transgenic
tomato was two times greater than that in untransformed ones [52]. Excess ROS activated by osmotic
stress cause drought sensitivity [53,54], whereas low levels of ROS increases tolerance to osmotic
stress [55]. Studies also proved that STS genes are linked with the improvement of resistance when
plants are suffering from stress such as drought or high salinity. Osmotic stress lead to up-regulation
of the expression of STS genes and activated stilbenoid biosynthesis [56–58]. In this current study,
we found that VqSTS36 significantly enhanced Arabidopsis seedling resistance to osmotic stress by
the induction of ABA signaling response, see Figure 7, and reduced the ROS activated by osmotic
stress, see Figures 5 and 6. However, this tolerance did not show in mature transgenic Arabidopsis,
and further research is still required to interpret the precise role of STS gene functioning in the tolerance
to drought or salt stress.

4. Materials and Methods

4.1. Construction of Vector
      Total RNA was extracted from V. quinquangularis cv. “Shang-24” leaf samples using the E.Z.N.A.®
Plant RNA Kit (Omega Biotech, Norcross, GA, USA). The first strand cDNA synthesis was carried
out using PrimerScriptTM RTase (TaKaRa Bio Inc., Dalian, China). Amplification of cDNA was
conducted using 2 × Taq PCR MaterMix (BioSci Biotech, Hangzhou, China) and specific primers,
see Supplementary Table S1.
      The full-length grape VqSTS36 coding sequence was amplified using gene-specific primers F1
(50 -CATGGCTTCAGTTGAGGAAATCAG-30 ) and R1 (50 -GGGGGGATAATGAAACAGTGAGATA-30 )
and 2×Taq PCR MasterMix (BioSci Biotech, Hangzhou, China). The PCR product was cloned into the
pGEM® -T Easy vector (Promega, Madison, WI, USA). Amplified VqSTS36 sequence using gene-specific
primers with restriction sites F2 (50 -CGCGGATCCATGGCTTCAGTT GAGG-30 Sma I site underlined)
and R2 (50 -CTACCCGGGGTACCATTCCCCTTC AC-30 BamH I site underlined). Following cloning,
the VqSTS36 sequence was inserted downstream of the CaMV 35S promoter in a pCambia 2300 vector
(Cambia, Brisbane, Queensland, Australia; Figure 1A), then introduced into Agrobacterium tumefaciens
(strain GV3101) using electroporation.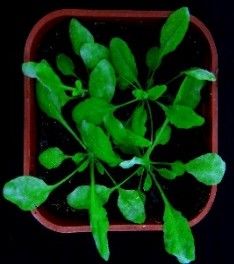
Int. J. Mol. Sci. 2018, 19, 2985                                                                   10 of 15

4.2. Arabidopsis Transformation
     The above plant transformation vector was introduced into A. thaliana (Col-0) using the floral
dip method [59]. We obtained 57 independent positive transgenic lines. To identify transgenic lines,
T1 seeds were harvested and sown on MS medium added with 75 mg/L kanamycin. According
to the PCR detection and phenotype of transgenic plants’ resistance against powdery mildew
(Golovinomyces. cichoracearum), three T3 homozygous lines (L31, L35 and L36) were generated with
universal representation and then utilized for subsequent experiments, wild-type (WT) plants were
used as the untransformed control. All Arabidopsis plants were grown at 21 to 23 ◦ C with a 16 h/8 h
photoperiod (100 µmol m−2 s−1 photon flux density) at ~60% relative humidity (RH) on soil.

4.3. Transformed Arabidopsis Pathogens Inoculation
      Four-week old transgenic A. thaliana and WT were infected with powdery mildew
(G. cichoracearum) through gentle contact with leaves exhibiting disease symptoms. Subjected plants
were incubated at 22 ◦ C with ~80% RH for 3 days following inoculation, and then transferred to the
proper condition with 30~40% RH. The response of VqSTS36 transgenic plants and WT were monitored
for 7 days. Each experiment was conducted in triplicate.
      B. cinerea was cultured on potato dextrose agar medium at 25 ◦ C in the dark. Conidial spore
suspensions (2 × 10⁷ conidia/mL) were prepared with 14-day old cultures using sterile ddH2 O as
described previously [39]. Four-week old plants, including the three transgenic lines (L31, L35, L36)
and WT were rinsed with 10 µL conidial suspension. Inoculated plants were incubated at 22 ◦ C under
a 16 h light and 8 h dark photoperiod and 80 to 90% RH. Disease incidence and lesion diameter were
recorded daily. Each experiment was conducted in triplicate.

4.4. Detection of Cell Death and Superoxide Accumulation in Arabidopsis Leaves Treated with Pathogens
      Following pathogen inoculation, using trypan blue and nitro blue tetrazolium (NBT) stainings to
measure cell death and Superoxide anions (O2 − ) accumulation, respectively, in leaves detached from
transgenic Arabidopsis and WT. Experiments involving powdery mildew and B. cinerea were carried
out at 4 dpi and 3 dpi, respectively. In the case of trypan blue, staining was conducted as described
previously [39]. Briefly, inoculated leaves were immersed in boiled trypan blue solution (a 1:1:1:1:1
ratio of water, trypan blue, phenol, glycerol, and lactic acid) for 2 to 3 min, and then were decolorized
in 2.5 g/mL chloral hydrate for 1 to 2 days. For NBT staining, infected leaves were socked in HEPES
buffer (pH 7.5) containing 6 mM NBT for 2 to 3 h [26]. Each experiment was conducted in triplicate.

4.5. Tomato Transformation
      Tomato transformation was performed as described previously with some modification [60,61]
(Ouyang et al. 2005; Zhang et al. 2006). Disinfecting tomato seeds two to three times with sterile water
in a Petri dish, 30 sec with 70% ethanol, three times with sterilized water, and then 15 min with 10%
sodium hypochlorite, before, finally, washing five times with sterile water. The sterilized seeds were
grown on the 1/2MS medium (2.47 g/L 1/2MS powder, 10 g/L sucrose, 8 g/L agar, pH5.8) at 24 to
26 ◦ C without light. When 50% of the seeds were germinated in a medium, they were grown at 24 to
26 ◦ C with a 16/8 h photoperiod (1800 Lux) until the cotyledons were fully expanded.
      The fully expanded cotyledons were extracted from 10-day old tomato, seedlings were cut with
two incisions paralleled to the vein, and leaves were upturned and cultured on the pre-culture medium
(4.433 g/L MS powder, 10 g/L sucrose, 8 g/L agar, 2 mg/L ZT, 0.2 mg/L IAA, 0.1 mM AS, pH 5.8)
without light for 2 days. Tomato cotyledons were soaked in the transformed A. tumefaciens liquid
(OD600 = 0.4–0.5) for 20 min, blotted dry on sterilized filter paper, subsequently grown on co-culture
medium (4.433 g/L MS powder, 10 g/L sucrose, 8 g/L agar, 2 mg/L ZT, 0.2 mg/L IAA, 0.1 mM AS)
for a further 2 days. Infected cotyledons were placed on screening medium (4.433 g/L MS powder,
Int. J. Mol. Sci. 2018, 19, 2985 11 of 15
10 g/L sucrose, 8 g/L agar, 2 mg/L ZT, 0.2 mg/L IAA, 200 mg/L cef + 50 mg/L Kana, pH5.8) for 10
days and sub-cultured every 3 weeks.
When resistance shoots reached 2 cm, cotyledons were excised from callus and transferred onto
rooting medium (4.433 g/L MS powder, 10 g/L sucrose, 8 g/L agar, 0.2 mg/L IAA, 20 mg/L cef
+ 25 mg/L kanamycin, PH5.8). Plantlets with well-developed roots were finally transplanted to
soil, harvested the seeds (T1 ), then sown on the medium added with 25 mg/L kanamycin to screen
T2 plants.
4.6. Transformed Tomato Infected with Botrytis Cinerea
Using the same method as Arabidopsis plants infected with B. cinerea to prepare the conidial spore
suspensions (2 × 10⁷ conidia/mL). Specifically, leaves separated from transgenic and wild-type tomato
were rinsed with sterilized ddH2 O, and then placed on a 1% agarose overlay in a Petri dish. A total of
10 L spore suspensions were inoculated on detached leaves, followed by culturing at 25 ◦ C under a
16 h light and 8 h dark photoperiod, and RH kept at 90% to 95%. The disease incidence and lesion
diameter were recorded daily and leaves were collected after 5 days for the analysis of transcription
levels of related genes. Each experiment was conducted in triplicate.
4.7. Effect of Osmotic Stress on the Seeds and Seedlings of Transgenic Arabidopsis
To assess cotyledon greening rates of transformed Arabidopsis following salt and drought stress.
T3 seeds of transgenic lines and WT with antiseptic to be soaked in 75% ethanol for 30 s, washed
with sterilized ddH2 O a total three times, then immersed in 10% NaClO for 3 to 5 min, and finally
washed with sterilized ddH2 O a total of five times. To detect the optimistic concentrations of mannitol
and NaCl for cotyledon greening rates, both transgenic and WT seeds were sown on MS medium
supplemented with different concentrations of mannitol and NaCl. Then, 120 sterilized seeds were
sown on MS medium containing 250 mM mannitol and 130 mM NaCl to mimic salt and drought stress,
respectively [26,39], and were incubated at 21 to 23 ◦ C under a 16 h light and 8 h dark photoperiod.
Cotyledon greening rates were recorded daily. Each experiment was conducted in triplicate.
To determine the response of seedlings to osmotic stress, four-day old transgenic and WT seedlings
which had been cultivated on MS medium were transferred to either a new MS medium or an MS
medium containing 250 mM mannitol or 130 mM NaCl, respectively. Root lengths were measured
6 days following both types of osmotic treatment. In each instance, experiments were carried out
in triplicate.
For the measurement of the chlorophyll content of plants. VqSTS36 transgenic lines and WT seeds
were sown on MS medium plates, and 7-day old seedlings were subsequently transferred to flasks
containing MS liquid medium supplemented with 130 mM NaCl or 250 mM mannitol. Seven days
following the commencement of osmotic stress treatment, seedlings were collected for physiological
assessments. To measure chlorophyll content, 0.1 g seedlings with their roots removed were submerged
in 5 mL 96% ethanol and incubated at 4 ◦ C until the seedlings turned white.
4.8. Analysis of Quantitative Real-Time PCR
Total RNA was extracted using the Ultrapure RNA kit (ComWin Biotech, Beijing, China),
and first-strand cDNA synthesis was performed according to the TransScript (Transgene Biotech,
Beijing, China), which contained 200 ng total RNA. Subsequent qPCR assays were carried out using
2 × TransStart Tip Green qPCR Supermix (Transgene Biotech). Gene-specific primers used are listed
in the supplementary, Table S1. The PCR parameter is: 94 ◦ C denaturing 30s; 94 ◦ C, 5s; 60 ◦ C, 30s,
the cycle number is 40. Arabidopsis plants with AtActin2 and tomato plants with SlActin as the internal
reference genes, respectively.Int. J. Mol. Sci. 2018, 19, 2985 12 of 15
4.9. Statistical Analysis
Data analysis and charts were made using the SigmaPlot software. Mean values (±SD) were
determined from the data set for three replications. Differences between stress treatments were
examined with Student’s t-test, and were considered statistically significant at p < 0.05.
Supplementary Materials: The supplementary materials are available online at http://www.mdpi.com/1422-
0067/19/10/2985/s1.
Author Contributions: X.W., L.H., X.Y. designed the experiments. L.H., X.Y. conducted the experiments. X.W.,
X.Y., X.S., J.Y., M.Z.R. supplied reagents/materials/analysis. X.W., Z.C. provided guidance throughout the entire
study. L.H. and X.W. wrote the manuscript. All authors approved the final manuscript.
Funding: This work was supported by the National Natural Science Foundation of China (31572110), as well as
the Program for Innovative Research Team of Grape Germplasm Resources and Breeding (2013KCT-25).
Conflicts of Interest: The authors declare no financial conflict of interests.
References
1. Sales, J.M.; Resurreccion, A.V.A. Resveratrol in Peanuts. Crit. Rev. Food Sci. 2014, 54, 734–770. [CrossRef]
[PubMed]
2. Kodan, A.; Kuroda, H.; Sakai, F. A Stilbene Synthase from Japanese Red Pine (Pinus densiflora): Implications
for Phytoalexin Accumulation and Down-regulation of Flavonoid Biosynthesis. Proc. Natl. Acad. Sci. USA
2002, 99, 3335–3339. [CrossRef] [PubMed]
3. Sobolev, V.S.; Neff, S.A.; Gloer, J.B. New Stilbenoids from Peanut (Arachis hypogaea) Seeds Challenged by An
Aspergillus caelatus Strain. J. Agric. Food Chem. 2009, 57, 62–68. [CrossRef] [PubMed]
4. Xu, W.R.; Yu, Y.H.; Ding, J.H.; Hua, Z.Y.; Wang, Y.J. Characterization of A Novel Stilbene Synthase Promoter
Involved in Pathogen- and Stress-inducible Expression from Chinese Wild Vitis pseudoreticulata. Planta 2010,
231, 475. [CrossRef] [PubMed]
5. Yu, C.K.; Springob, K.; Schmidt, J.; Nicholson, R.L.; Chu, I.K.; Yip, W.K.; Lo, C. A Stilbene Synthase Gene
(SbSTS1) Is Involved in Host and Nonhost Defense Responses in Sorghum. Plant Physiol. 2005, 138, 393–401.
[CrossRef] [PubMed]
6. Corso, M.; Vannozzi, A.; Maza, E.; Vitulo, N.; Meggio, F.; Bouzayen, M.; Valle, G.; Bonghi, C.; Lucchin, M.
Transcriptome Pathways in Leaf and Root of Grapevine Genotypes with Contrasting Drought Tolerance.
Acta Hortic. 2016, 1136, 161–167. [CrossRef]
7. Ismail, A.; Riemann, M.; Nick, P. The Jasmonate Pathway Mediates Salt Tolerance in Grapevines. J. Exp. Bot.
2012, 63, 2127–2139. [CrossRef] [PubMed]
8. Ji, W.; Wang, Y.J. Breeding for Seedless Grapes Using Chinese Wild Vitis spp. II. In Vitro Embryo Rescue and
Plant Development. J. Sci. Food Agric. 2013, 93, 3870–3875. [CrossRef] [PubMed]
9. Mullins, P.R. The Effects of Advertising Restrictions on Tobacco Consumption. Br. J. Addict. 1992,
87, 1599–1601. [CrossRef] [PubMed]
10. Hann, D.R.; Gimenez-Ibanez, S.; Rathjen, J.P. Bacterial Virulence Effectors and Their Activities. Curr. Opin.
Plant Biol. 2010, 13, 388–393. [CrossRef] [PubMed]
11. Bouarab, K.; Melton, R.; Peart, J.; Baulcombe, D.; Osbourn, A. A Saponin-detoxifying Enzyme Mediates
Suppression of Plant Defences. Nature 2002, 418, 889–892. [CrossRef] [PubMed]
12. Grant, M.; Lamb, C. Systemic Immunity. Curr. Opin. Plant Biol. 2006, 9, 414–420. [CrossRef] [PubMed]
13. D’Onofrio, C.; Cox, A.; Davies, C.; Boss, P.K. Induction of Secondary Metabolism in Grape Cell Cultures by
Jasmonates. Funct. Plant Biol. 2009, 36, 323–338. [CrossRef]
14. El Oirdi, M.; El Rahman, T.A.; Rigano, L.; El Hadrami, A.; Rodriguez, M.; Daayf, F.; Bouarab, K. Botrytis
Cinerea Manipulates The Antagonistic Effects between Immune Pathways to Promote Disease Development
in Tomato. Plant Cell 2011, 23, 2405–2421. [CrossRef] [PubMed]
15. Giraud, E.; Ivanova, A.; Gordon, C.S.; Whelan, J.; Considine, M.J. Sulphur Dioxide Evokes A Large Scale
Reprogramming of The Grape Berry Transcriptome Associated with Oxidative Signalling and Biotic Defence
Responses. Plant Cell Environ. 2012, 35, 405–417. [CrossRef] [PubMed]Int. J. Mol. Sci. 2018, 19, 2985 13 of 15
16. Kiselev, K.V.; Tyunin, A.P.; Karetin, Y.A. Salicylic Acid Induces Alterations in The Methylation Pattern of The
VaSTS1, VaSTS2, and VaSTS10 Genes in Vitis amurensis Rupr. Cell Cultures. Plant Cell Rep. 2015, 34, 311–320.
[CrossRef] [PubMed]
17. Chaves, M.M.; Zarrouk, O.; Francisco, R.; Costa, J.M.; Santos, T.; Regalado, A.P.; Rodrigues, M.L.; Lopes, C.M.
Grapevine under Deficit Irrigation: Hints from Physiological and Molecular Data. Ann. Bot. 2010,
105, 661–676. [CrossRef] [PubMed]
18. Walker, R.R.; Blackmore, D.H.; Clingeleffer, P.R.; Correll, R.L. Rootstock Effects on Salt Tolerance of Irrigated
Field-grown Grapevines (Vitis Vinifera L.cv. Sultana).: 1.Yield and Vigour Inter-Relationships. Aust. J. Grape
Wine Res. 2002, 8, 3–14. [CrossRef]
19. Kumar, M.; Choi, J.; An, G.; Kim, SR. Ectopic Expression of OsSta2 Enhances Salt Stress Tolerance in Rice.
Front. Plant Sci. 2017, 8, 316. [CrossRef] [PubMed]
20. Xie, R.; Zhang, J.; Ma, Y.; Pan, X.; Dong, C.; Pang, S.; He, S. Combined Analysis of mRNA and miRNA
Identifies Dehydration and Salinity Responsive Key Molecular Players in Citrus Roots. Sci. Rep. 2017,
7, 42094. [CrossRef] [PubMed]
21. Kumar, M. Crop Plants and Abiotic Stresses. J. Biomol. Res. Ther. 2013, 3, 1. [CrossRef]
22. Corso, M.; Vannozzi, A.; Maza, E.; Vitulo, N.; Meggio, F.; Pitacco, A.; Telatin, A.; D’ Angelo, M.; Feltrin, E.;
Negri, A.S.; et al. Comprehensive Transcript Profiling of Two Grapevine Rootstock Genotypes Contrasting
in Drought Susceptibility Links the Phenylpropanoid Pathway to Enhanced Tolerance. J. Exp. Bot. 2015, 66,
5739–5752. [CrossRef] [PubMed]
23. Blum, A. Drought Tolerance in Higher Plants: Genetical, Physiological and Molecular Biological Analysis.
In Crop Responses to Drought and the Interpretation of Adaptation; Belhassen, E., Ed.; Springer: Dordrecht, The
Netherlands, 1996; pp. 135–148.
24. Cramer, G.R.; Ergül, A.; Grimplet, J.; Tillett, R.L.; Tattersall, E.A.R.; Bohlman, M.C.; Vincent, D.;
Sonderegger, J.; Evans, J.; Osborne, C.; et al. Water and Salinity Stress in Grapevines: Early and Late
Changes in Transcript and Metabolite Profiles. Funct. Integr. Genom. 2007, 7, 111–134. [CrossRef] [PubMed]
25. Tillett, R.; Ergul, A.; Albion, R.; Schlauch, K.; Cramer, G.; Cushman, J. Identification of Tissue-Specific,
Abiotic Stress-Responsive Gene Expression Patterns in Wine Grape. Vitis vinifera L. Based on Curation and
Mining of Large-Scale EST Data Sets. BMC Plant Biol. 2011, 11, 86. [CrossRef]
26. Huang, L.; Zhang, S.L.; Singer, S.D.; Yin, X.J.; Yang, J.H.; Wang, Y.J.; Wang, X.P. Expression of The Grape
VqSTS21 Gene in Arabidopsis Confers Resistance to Osmotic Stress and Biotrophic Pathogenes but Not
Botrytis Cinerea. Front. Plant Sci. 2016, 7, 1379. [CrossRef] [PubMed]
27. Gonorazky, G.; María, C.G.; Abd-El-Haliem, A.M.; Joosten, M.H.A.J.; Laxalt, A.M. Silencing of The Tomato
Phosphatidylinositol-Phospholipase C2 (SlPLC2) Reduces Plant Susceptibility to Botrytis Cinerea. Mol. Plant
Pathol. 2016, 17, 1354–1363. [CrossRef] [PubMed]
28. Zhang, H.; Hong, Y.; Huang, L.; Liu, S.; Li, X.; Ouyang, Z.; Song, F.; Zhang, Y.; Li, D. Tomato Histone H2B
Monoubiquitination Enzymes SlHUB1 and SlHUB2 Contribute to Disease Resistance Against Botrytis Cinerea
through Modulating The Balance between SA- and JA/ET-Mediated Signaling Pathways. BMC Plant Biol.
2015, 15, 1–20. [CrossRef] [PubMed]
29. Stark, L.R.; Brinda, J.C.; McLetchie, D.N.; Oliver, M.J. Extended Periods of Hydration Do not Elicit
Dehardening to Desiccation Tolerance in Regeneration Trials of The Moss Syntrichia Caninervis. Int. J.
Plant Sci. 2012, 173, 333–343. [CrossRef]
30. Harshavardhan, VT.; Son, LV.; Seiler, C.; Junker, A.; Weigelt-Fischer, K.; Klukas, C.; Altmann, T.;
Sreenivasulu, N.; Bäumlein, H.; Kuhlmann, M. AtRD22 and AtUSPL1, Members of The Plant-Specific
BURP Domain Family Involved in Arabidopsis Thaliana Drought Tolerance. PLoS ONE 2014, 9, e110065.
[CrossRef] [PubMed]
31. Endo, A.; Sawada, Y.; Takahashi, H.; Okamoto, M.; Ikegami, K.; Koiwai, H.; Nambara, E. Drought Induction
of Arabidopsis 9-Cis-Epoxycarotenoid Dioxygenase Occurs in Vascular Parenchyma Cells. Plant Physiol.
2008, 147, 1984–1993. [CrossRef] [PubMed]
32. Jeandet, P.; Douillt-Breuil, A.C.; Bessis, R.; Debord, S.; Sbaghi, M.; Adrian, M. Phytoalexins from The Vitaceae:
Biosynthesis, Phytoalexin Gene Expression in Transgenic Plants, Antifungal Activity, and Metabolism.
J. Agric. Food Chem. 2002, 50, 2731–2741. [CrossRef] [PubMed]
33. Shankar, S.; Singh, G.; Srivastava, R.K. Chemoprevention by Resveratrol: Molecular Mechanisms and
Therapeutic Potential. Front. Biosci. 2007, 12, 4839–4854. [CrossRef] [PubMed]You can also read


