Ultrastructural and Photosynthetic Responses of Pod Walls in Alfalfa to Drought Stress - MDPI
←
→
Page content transcription
If your browser does not render page correctly, please read the page content below
International Journal of
            Molecular Sciences

Article
Ultrastructural and Photosynthetic Responses of Pod
Walls in Alfalfa to Drought Stress
Hui Wang 1,2 , Qingping Zhou 2 and Peisheng Mao 1, *
 1    Forage Seed Laboratory, Key Laboratory of Pratacultural Science, Beijing Municipality, China Agricultural
      University, Beijing 100193, China; huiwang@swun.edu.cn
 2    College of Qinghai-Tibetan Plateau, Southwest Minzu University, Chengdu 610041, China;
      qpingzh@aliyun.com
 *    Correspondence: maops@cau.edu.cn; Tel.: +86-010-6273-3311

 Received: 3 June 2020; Accepted: 22 June 2020; Published: 23 June 2020

 Abstract: Increasing photosynthetic ability as a whole is essential for acquiring higher crop
 yields. Nonleaf green organs (NLGOs) make important contributions to photosynthate formation,
 especially under stress conditions. However, there is little information on the pod wall in legume
 forage related to seed development and yield. This experiment is designed for alfalfa (Medicago
 sativa) under drought stress to explore the photosynthetic responses of pod walls after 5, 10,
 15, and 20 days of pollination (DAP5, DAP10, DAP15, and DAP20) based on ultrastructural,
 physiological and proteomic analyses. Stomata were evidently observed on the outer epidermis of
 the pod wall. Chloroplasts had intact structures arranged alongside the cell wall, which on DAP5
 were already capable of producing photosynthate. The pod wall at the late stage (DAP20) still
 had photosynthetic ability under well-watered (WW) treatments, while under water-stress (WS),
 the structure of the chloroplast membrane was damaged and the grana lamella of thylakoids were
 blurry. The chlorophyll a and chlorophyll b concentrations both decreased with the development
 of pod walls, and drought stress impeded the synthesis of photosynthetic pigments. Although the
 activity of ribulose-1,5-bisphosphate carboxylase (RuBisCo) decreased in the pod wall under drought
 stress, the activity of phosphoenolpyruvate carboxylase (PEPC) increased higher than that of RuBisCo.
 The proteomic analysis showed that the absorption of light is limited due to the suppression of the
 synthesis of chlorophyll a/b binding proteins by drought stress. Moreover, proteins involved in
 photosystem I and photosystem II were downregulated under WW compared with WS. Although
 the expression of some proteins participating in the regeneration period of RuBisCo was suppressed
 in the pod wall subjected to drought stress, the synthesis of PEPC was induced. In addition,
 some proteins, which were involved in the reduction period of RuBisCo, carbohydrate metabolism,
 and energy metabolism, and related to resistance, including chitinase, heat shock protein 81-2
 (Hsp81-2), and lipoxygenases (LOXs), were highly expressed for the protective response to drought
 stress. It could be suggested that the pod wall in alfalfa is capable of operating photosynthesis and
 reducing the photosynthetic loss from drought stress through the promotion of the C4 pathway,
 ATP synthesis, and resistance ability.

 Keywords: pod wall; nonleaf green organs; ultrastructure; proteomic; alfalfa

1. Introduction
     Photosynthesis is considered as the most important chemical reaction and provides over 90%
of dry matter for crop yield formation [1,2]. Increasing crop yield by promoting photosynthesis has
been the research hotspot until now [3]. Green leaves are commonly focused as the main source for
producing photosynthate. However, nonleaf green organs (NLGOs) have been proven to be practically

Int. J. Mol. Sci. 2020, 21, 4457; doi:10.3390/ijms21124457                            www.mdpi.com/journal/ijms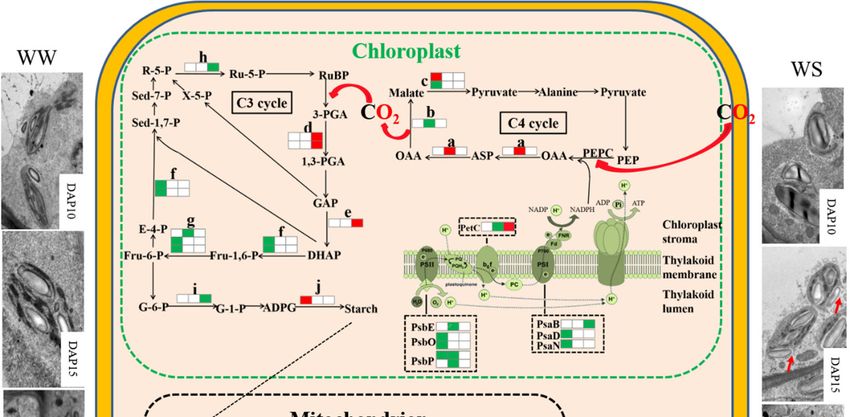
Int. J. Mol. Sci. 2020, 21, 4457                                                                        2 of 19

or potentially capable of assimilating CO2 . Many scientists have previously reported that the silique
shell of oil rape (Brassica napus) [4]; the boll shell of castor (Ricinus communis) [5]; the pod wall of legume
crops, including chickpea (Cicer arietinum) [6], soybean (Glycine max) [7], and alfalfa (Medicago sativa) [8];
ears of cereal including rice (Oryza sativa) [9], barley (Hordeum vulgare) [10], and wheat (Triticum
turgidum) [11]; flowers [12], stems [13], and roots [14] in some plants could photosynthesize and make
an important contribution to yield formation. In addition, under drought conditions, the photosynthetic
contribution of NLGOs turn greater, and NLGOs even become the primary photosynthetic organs for
grain-filling [9,15].
      Photosynthesis in leaves is sensitive to water deficit. Under water-deficit conditions, the flag
leaves of cereal crops will wilt and senesce, while NLGOs are able to maintain relatively high
water content due to some special features, including xeromorphic anatomy [9], lower stomatal
conductance and transpiration rate [16], and a higher ability for osmotic adjustment [17]. In addition,
NLGOs show better photosynthetic performance in the change of stomatal densities [18], chlorophyll
concentration [5,19], and photosynthetic enzyme abilities [20] than leaves in response to water
deficit. NLGOs have been proved to play an important role in regulating carbon partitioning
during grain-filling to compensate for the reduction due to the decrease of photosynthetic ability
in leaves [7]. Shreds of evidence based on anatomical, physiological, and molecular research have
shown that the high photosynthetic efficiency pathway, C4-like or C3-C4 intermediate photosynthesis,
might exist in the NLGOs of C3 crops [11]. Kranz anatomy is considered a crucial characteristic
in C4 crops. The ear organs, including glume, lemma, and awn in C3 cereals, have two types of
chloroplasts existing, respectively, in two types of cells, mesophyll cells and the cells arranged around
the vascular bundles, similar to maize (Zea mays) leaves [11]. One of the key photosynthetic enzymes,
phosphoenolpyruvate carboxylase (PEPC), has been detected with activity in NLGOs, and PEPC has
a higher ability than ribulose-1,5-bisphosphate carboxylase (RuBisCo) under drought stress [21–23].
Besides PEPC, other enzymes, including NAD-dependent malic enzyme (NAD-ME), NADP-dependent
malic enzyme (NADP-ME), and NADP-dependent malate dehydrogenase (NADP-MDH) involved in
the C4 photosynthetic cycle, have been induced in NLGOs under drought stress [21]. Some genes,
including ppc, aat, mdh, me2, gpt, and ppdk, specific to NAD-ME type-C4 photosynthesis, have been
identified in wheat caryopsis [24]. However, other scientists have proposed the negative hypothesis
that C4 photosynthesis is lacking in C3 crops. Singal et al. reported that CO2 was assimilated by
C4 photosynthesis in the pericarp of wheat, but not in awn and glume [25]. A C4 photosynthesis
metabolism occurring in C3 crops depends on ontogeny differences, cultivars, and environments like
high or low CO2 and heat or drought stress [24,26]. Above all, the response mechanism of carbon
fixation in NLGOs to drought stress is still unclear.
      Alfalfa is widely cultured around the world to produce high-quality hay for feeding livestock,
especially dairy cows. Seed producers have long focused on alfalfa seed yield increase. Moderate
drought contributes to achieving higher seed yield during the flowering and seed maturation period.
Nevertheless, little is known on the physiological response and the photosynthetic contribution of
the pod wall in alfalfa under drought stress. Investigating and increasing the photosynthetic ability
of NLGOs, especially under stress conditions, is a novel way to increase the photosynthetic ability
of the whole plant and finally increase the grain yield. In this study, physiological, ultrastructural,
and proteomic analyses were carried out to (1) investigate the photosynthetic characteristics of the
pod wall in alfalfa, and (2) research the response mechanism of photosynthesis in the pod wall to
drought stress.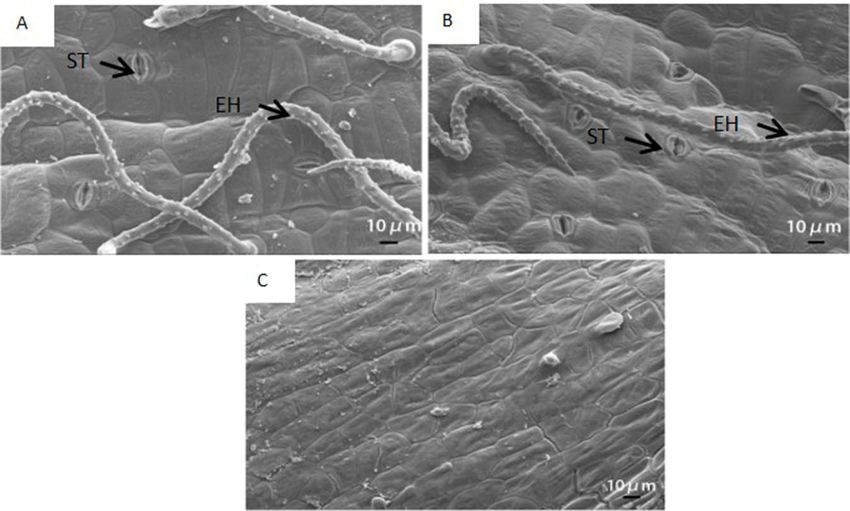
lots of dots existed on the epidermal hair. Cells of the inner surface of the pod wall were tightly
arranged together (Figure 1C).
Under WW, chloroplasts in the pod wall had the ability to photosynthesize from DAP5 to
DAP20. Chloroplasts on DAP5 existed with the intact structure and were arranged close to the cell
wall (Figure 2A). Chloroplast membrane structure was intact, and grana lamella was arrayed 3along
Int. J. Mol. Sci. 2020, 21, 4457 of 19
the long axis of the chloroplast, some of which had already produced starch grains. More and bigger
starch grains were produced in the chloroplasts on DAP10 (Figure 2B) and DAP15 (Figure 2C). The
2.
podResults
wall on DAP20 still had photosynthetic activity, while the cells had started to age and the nuclei
were degrading. Few osmiophilic granules were found in cells (Figure 2D).
2.1. Changes
Under of thechloroplasts
WS, Surface Characteristics
were ableandto Ultrastructure of Pod Wallon
produce photosynthate under
DAP5Drought Stress while the
and DAP10,
structure of chloroplasts
Stomata and epidermal was gradually
hair weredamaged
distinctlyfrom DAP15intothe
observed DAP20.
outerThe chloroplasts
surface of the had
pod intact
wall
membrane
(Figure 1A,B). structures
Stomata and werehad already of
composed started to produce
two semilunar starch
guard grains
cells on DAP5
encircled (Figure
by several 2E), and
subsidiary
they produced
cells. Stomata were moreopen and bigger
under starch
both WWgrains
andonWS,
DAP10 (Figure
and the thick2F). Lotswall
inner of starch grainsthe
of stomata, could still
bright
be observed on DAP15, while the evident changes occurred in the structure of chloroplasts,
color part, could be clearly observed. In addition, a hump occurred around the base of epidermal hair, i.e., the
membrane
and was existed
lots of dots partly broken, and the grana
on the epidermal hair.lamellae of thylakoids
Cells of the became
inner surface of theblurry (Figure
pod wall 2G).
were Few
tightly
starch grains existed
arranged together (Figure 1C). on DAP20, while lots of osmiophilic granules were presented. The membrane
of chloroplasts was seriously broken, and the structure of thylakoids was blurring (Figure 2H).
Figure1.1.The
Figure Thescanning
scanningelectron
electronmicrograph
micrograph of of
thethe outer
outer (A,B)
(A,B) andand the inner
the inner surface
surface (C) of(C)
theofpod
thewall
pod
wall
on theon10th
the day
10thafter
day after pollination
pollination (DAP10)
(DAP10) underunder well-watered
well-watered (A) water-stressed
(A) and and water-stressed treatments
treatments (B).
(B).stoma;
ST, ST, stoma; EH, epidermal
EH, epidermal hair; hair; D, dots;
D, dots; H, hump.
H, hump.
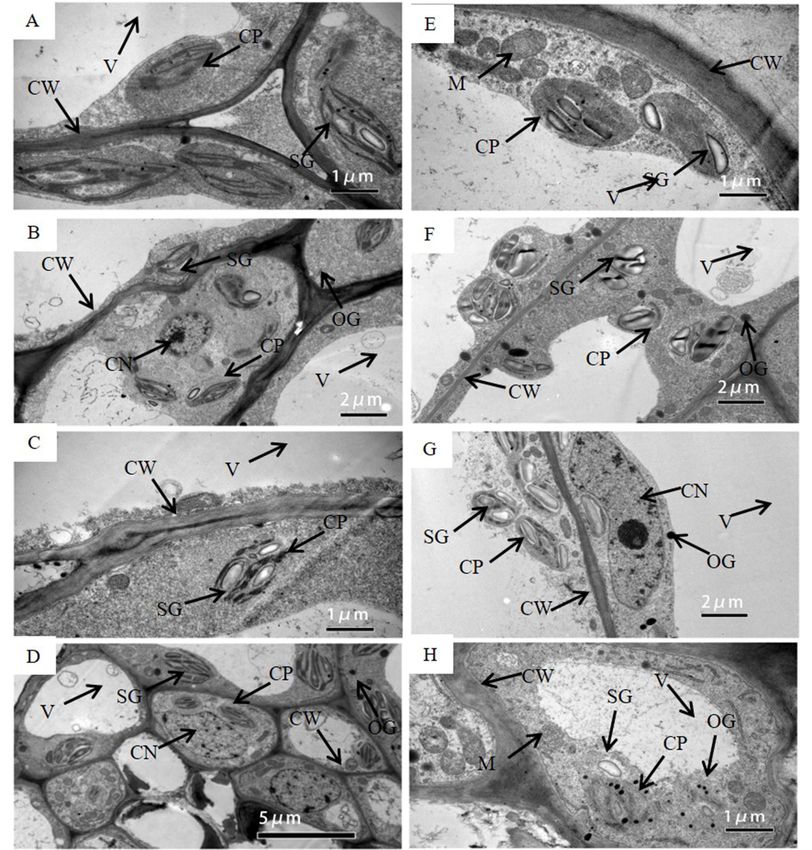
Under WW, chloroplasts in the pod wall had the ability to photosynthesize from DAP5 to DAP20.
Chloroplasts on DAP5 existed with the intact structure and were arranged close to the cell wall
(Figure 2A). Chloroplast membrane structure was intact, and grana lamella was arrayed along the long
axis of the chloroplast, some of which had already produced starch grains. More and bigger starch
grains were produced in the chloroplasts on DAP10 (Figure 2B) and DAP15 (Figure 2C). The pod
wall on DAP20 still had photosynthetic activity, while the cells had started to age and the nuclei were
degrading. Few osmiophilic granules were found in cells (Figure 2D).
Under WS, chloroplasts were able to produce photosynthate on DAP5 and DAP10, while the
structure of chloroplasts was gradually damaged from DAP15 to DAP20. The chloroplasts had
intact membrane structures and had already started to produce starch grains on DAP5 (Figure 2E),
and they produced more and bigger starch grains on DAP10 (Figure 2F). Lots of starch grains could
still be observed on DAP15, while the evident changes occurred in the structure of chloroplasts,
i.e., the membrane was partly broken, and the grana lamellae of thylakoids became blurry (Figure 2G).
Few starch grains existed on DAP20, while lots of osmiophilic granules were presented. The membrane
of chloroplasts was seriously broken, and the structure of thylakoids was blurring (Figure 2H).
Except for chloroplasts, the structure of other organelle or tissues changed under drought stress
as well. The central vacuole was bigger in the cell under WW (Figure 2D), while the gap between the
central vacuole and the cell wall become wider under WS (Figure 2H). The membrane structure of the
mitochondrion was intact and clear on DAP5 under WS (Figure 2E), while it was broken and blurred
on DAP20 (Figure 2H).
Int. J. Mol. Sci. 2020, 21, 4457                                                                          4 of 19
Int. J. Mol. Sci. 2020, 21, x FOR PEER REVIEW                                                             4 of 18

     Figure
     Figure 2.   Thetransmission
             2. The   transmissionelectron
                                    electron micrograph
                                           micrograph    of cells
                                                      of cells     in the
                                                               in the podpod
                                                                          wallwall on DAP5
                                                                              on DAP5  (A,E),(A,E),
                                                                                              DAP10 DAP10
                                                                                                     (B,F),
     (B,F), DAP15 (C,G), and DAP20 (D,H) under well-watered (A–D) and water-stressed treatment (E–H).
     DAP15 (C,G), and DAP20 (D,H) under well-watered (A–D) and water-stressed treatment (E–H). CW,
     CW, cell wall; CP, chloroplast; SG, starch grain; OG, osmiophilic granules; V, central vacuole; CN,
     cell wall; CP, chloroplast; SG, starch grain; OG, osmiophilic granules; V, central vacuole; CN, cell
     cell nucleus; M, mitochondrion; T, thylakoid.
     nucleus; M, mitochondrion; T, thylakoid.
2.2. Changes of Chlorophyll Concentration in Pod Wall under Drought Stress
      Except for chloroplasts, the structure of other organelle or tissues changed under drought stress
     With
as well.  thecentral
         The   development
                     vacuoleofwasthebigger
                                     pod wall,  thecell
                                            in the  concentration
                                                        under WWof(Figure
                                                                    chlorophyll a, chlorophyll
                                                                          2D), while           b, and total
                                                                                      the gap between   the
chlorophyll  decreased
central vacuole  and theunder    bothbecome
                           cell wall  WW and      WS under
                                               wider  treatments, and the
                                                            WS (Figure    concentration
                                                                        2H). The membrane of chlorophyll  a
                                                                                               structure of
was  higher than  that of chlorophyll   b, respectively. Furthermore, the concentration   of
the mitochondrion was intact and clear on DAP5 under WS (Figure 2E), while it was broken and chlorophyll  a,
chlorophyll b, and total
blurred on DAP20          chlorophyll
                    (Figure   2H).     in the treatment of WS decreased significantly (p < 0.05) compared
with WW (Table 1).
2.2. Changes of Chlorophyll Concentration in Pod Wall under Drought Stress
      With the development of the pod wall, the concentration of chlorophyll a, chlorophyll b, and
total chlorophyll decreased under both WW and WS treatments, and the concentration of chlorophyll
a was higher than that of chlorophyll b, respectively. Furthermore, the concentration of chlorophyll
a, chlorophyll b, and total chlorophyll in the treatment of WS decreased significantly (p < 0.05)
compared with WW (Table 1).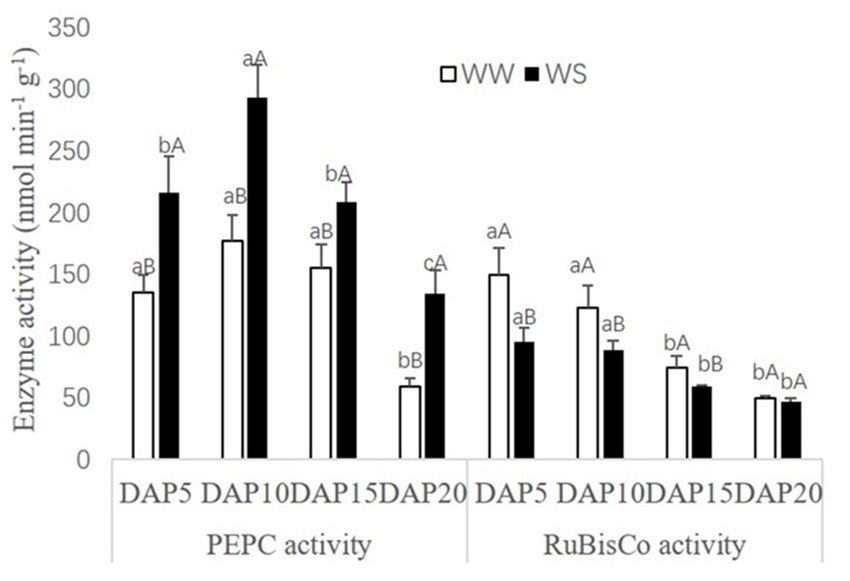
Int.
Int.J.J.Mol.
Mol.Sci. 2020,21,
Sci.2020, 21,4457
x FOR PEER REVIEW 5 5ofof1918
Table 1. Effect of drought stress on the concentration of chlorophyll in the pod wall.
Table 1. Effect of drought stress on the concentration of chlorophyll in the pod wall.
Chlorophyll a Chlorophyll b Total Chlorophyll
Chlorophyll−1a Chlorophyll−1b Total Chlorophyll
Days after Pollination (mg g )
(mg g−1 )
(mg g )
(mg g−1 )
(mg g−1)
(mg g−1 )
Days after Pollination
WW WS WW WS WW WS
WW WS WW WS WW WS
DAP5 0.314 aA 0.141 aB 0.137 aA 0.055 aB 0.451 aA 0.196 aB
DAP5 0.314 aA bA 0.141 aB abB 0.137 aA bA 0.055 aB abA 0.451 aA bA 0.196 aB bB
DAP10
DAP10 0.138
0.138 bA
0.085
0.085 abB
0.064
0.064 bA
0.044
0.044 abA
0.202
0.202 bA
0.128
0.128 bB
DAP15
DAP15 0.094
0.094 bA bA 0.041
0.041 bcB bcB 0.055
0.055 bA bA 0.025
0.025 bcB bcB 0.149
0.149 bA bA 0.066
0.066 cB cB
cA cA cB cB cA cA cB cB cA cA dB dB
DAP20
DAP20 0.024
0.024 0.012
0.012 0.019
0.019 0.010
0.010 0.043
0.043 0.022
0.022
WW,
WW,well-watered;
well-watered;WS, water-stressed. Different Different
WS, water-stressed. small letterssmall
in the letters
same column
in theand different
same capitals
column and in the same
different
row meant a significant difference at the 0.05 probability level.
capitals in the same row meant a significant difference at the 0.05 probability level.
2.3.
2.3.Changes
ChangesofofPhotosynthetic
PhotosyntheticEnzyme
EnzymeActivities
ActivitiesininPod
PodWall
Wallunder
underDrought
DroughtStress
Stress
PEPC
PEPCandandRuBisCo
RuBisCoactivities in pod
activities inwalls
pod both present
walls both apresent
declininga trend with the
declining pod with
trend development
the pod
(Figure
development (Figure 3). However, there were different responses for PEPC and RuBisCoofinWS.
3). However, there were different responses for PEPC and RuBisCo in the treatment the
As a comparison
treatment of WS.with
As WW, PEPC activities
a comparison couldPEPC
with WW, be increased significantly
activities (p < 0.05) significantly
could be increased in the treatment
(p <
of0.05)
WS,inwhile RuBisCo activities
the treatment wereRuBisCo
of WS, while decreased.
activities were decreased.
Figure 3. Effect of drought stress on photosynthetic enzyme activity (nmol min−1 g−1 ) in the pod
Figure 3. Effect of drought stress on photosynthetic enzyme activity (nmol min−1 g−1) in the pod wall.
wall. Different small letters up the white bar and different capitals up the black bar within one
Different small letters up the white bar and different capitals up the black bar within one
photosynthetic enzyme mean a significant difference at the 0.05 probability level. WW, well-watered;
photosynthetic enzyme mean a significant difference at the 0.05 probability level. WW, well-watered;
WS, water-stressed.
WS, water-stressed.
2.4. Proteomic Analysis on the Response of Pod Wall to Drought Stress
2.4. Proteomic Analysis on the Response of Pod Wall to Drought Stress
According to the Medicago database, a total of 4215 proteins were identified in the samples of
According
pod walls to the Medicago
(Supplementary File 1).database,
Under thea WW,
total of
3734215 proteins
proteins werewere identifiedupregulated
significantly in the samples
(foldof
change > 2.0,
pod walls p < 0.05) for WW15
(Supplementary File 1).
vs.Under
WW10, theand
WW,101373 proteins
proteins were
were significantly
significantly upregulated (fold
downregulated for
WW20 vs. WW10 (fold change < 0.5, p < 0.05, Figure 4). For the WS, there were 184 upregulated
change > 2.0, p < 0.05) for WW15 vs. WW10, and 101 proteins were significantly downregulated for
WW20 obtained
proteins vs. WW10 in (fold
WS20change < 0.5,
vs. WS10, andp the
< 0.05, Figure
number 4). For the WS,proteins
of downregulated there were
was 184 upregulated
lowest in WS20
proteins
vs. WS15.obtained in WS20
In addition, vs. WS10,
144 proteins andsignificantly
were the number of downregulated
downregulated inproteins
WS10 vs. was lowestwhile
WW10, in WS20
48
vs. WS15. In addition, 144 proteins were significantly
proteins were significantly downregulated in WS15 vs. WW15. downregulated in WS10 vs. WW10, while 48
proteins were significantly downregulated in WS15 vs. WW15.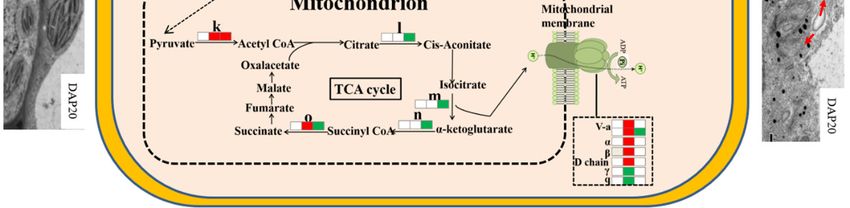
Int. J. Mol. Sci. 2020, 21, 4457                                                                      6 of 19
Int. J. Mol. Sci. 2020, 21, x FOR PEER REVIEW                                                         6 of 18

    Figure 4. Number of proteins differently expressed in pod walls under drought stress. The white
    and black squares represent, respectively, significant upregulation and downregulation at the 0.05
    probability level.
    Figure 4. Number of proteins differently expressed in pod walls under drought stress. The white and
    black squaresto represent,
    According        the Kyotorespectively,
                                Encyclopediasignificant upregulation
                                                 of Genes             and downregulation
                                                            and Genomes                     at the 0.05
                                                                            (KEGG) enrichment       analysis,
    probability level.
during pod development, most of the identified chlorophyll a–b binding proteins involved in the
photosynthesis–antenna proteins were significantly downregulated in pod walls under WW or WS
     According to the Kyoto Encyclopedia of Genes and Genomes (KEGG) enrichment analysis,
(Figure 5, Supplementary File 2). The synthesis of chlorophyll a–b binding proteins in the pod wall
during pod development, most of the identified chlorophyll a–b binding proteins involved in the
was restricted by the drought stress on DAP10 (Figure 5, Supplementary File 3).
photosynthesis–antenna proteins were significantly downregulated in pod walls under WW or WS
     Under the treatment of WS, some proteins, including ribulose-phosphate 3-epimerase, ctosolic
(Figure 5, Supplementary File 2). The synthesis of chlorophyll a–b binding proteins in the pod wall
fructose-1 6-bisphosphatase, fuctose-1, 6-bisphosphatase, fructose-bisphosphate aldolase, glyoxysomal
was restricted by the drought stress on DAP10 (Figure 5, Supplementary File 3).
malate dehydrogenase, malate dehydrogenase, malic enzyme, and sedoheptulose-1,7-bisphosphatase,
     Under the treatment of WS, some proteins, including ribulose-phosphate 3-epimerase, ctosolic
which are involved in carbon fixation of photosynthetic organisms, were significantly upregulated
fructose-1 6-bisphosphatase, fuctose-1, 6-bisphosphatase, fructose-bisphosphate aldolase,
among different growth stages after pollination (Figure 5, Supplementary File 2). In contrast, some
glyoxysomal malate dehydrogenase, malate dehydrogenase, malic enzyme, and sedoheptulose-1,7-
proteins, including 26S proteasome on-ATPase regulatory subunit 6, aspartate aminotransferase,
bisphosphatase, which are involved in carbon fixation of photosynthetic organisms, were
and glutamate-glyoxylate aminotransferase, were significantly downregulated at different durations
significantly upregulated among different growth stages after pollination (Figure 5, Supplementary
after pollination.    Furthermore, under the treatment of WW, proteins such as fructose-1,
File 2). In contrast, some proteins, including 26S proteasome on-ATPase regulatory subunit 6,
7-bisphosphatase, fructose-bisphosphate aldolase, malic enzyme, and PEPC were significantly
aspartate aminotransferase, and glutamate-glyoxylate aminotransferase, were significantly
upregulated at different durations after pollination, while proteins of cytosolic triosephosphate
downregulated at different durations after pollination. Furthermore, under the treatment of WW,
isomerase, glyceraldehyde-3-phosphate dehydrogenase, and phosphoglycerate kinase were
proteins such as fructose-1, 7-bisphosphatase, fructose-bisphosphate aldolase, malic enzyme, and
significantly downregulated.
PEPC were significantly upregulated at different durations after pollination, while proteins of
     The synthesis of cytosolic fructose-1 6-bisphosphatase, fructose-1, 6-bisphosphatase,
cytosolic triosephosphate isomerase, glyceraldehyde-3-phosphate dehydrogenase, and
fructose-bisphosphate aldolase, and malic enzyme was inhibited by the drought stress on DAP10,
phosphoglycerate kinase were significantly downregulated.
and the synthesis of glyoxysomal malate dehydrogenase and ribose-5-phosphate isomerase A were
     The synthesis of cytosolic fructose-1 6-bisphosphatase, fructose-1, 6-bisphosphatase, fructose-
both inhibited on DAP15 and DAP20, respectively (Figure 5, Supplementary File 3). Nevertheless,
bisphosphate aldolase, and malic enzyme was inhibited by the drought stress on DAP10, and the
aspartate aminotransferase on DAP15 and cytosolic triosephosphate isomerase and phosphoglycerate
synthesis of glyoxysomal malate dehydrogenase and ribose-5-phosphate isomerase A were both
kinase on DAP20 were significantly induced by drought stress.
inhibited on DAP15 and DAP20, respectively (Figure 5, Supplementary File 3). Nevertheless,
     Proteins involved in photosynthesis, including cytochrome b6-f complex iron-sulfur subunit,
aspartate aminotransferase on DAP15 and cytosolic triosephosphate isomerase and
F0F1 ATP synthase subunit gamma, oxygen-evolving complex/thylakoid lumenal 25.6 kDa protein,
phosphoglycerate kinase on DAP20 were significantly induced by drought stress.
and photosystem II oxygen-evolving enhancer protein, were significantly upregulated in the pod wall
at different durations after pollination under WS, while light-harvesting complex I chlorophyll a/b
binding protein, oxygen-evolving enhancer protein, photosystem I P700 chlorophyll a apoprotein a2,
and photosystem II D2 protein were significantly downregulated (Figure 5, Supplementary File 2).
Under WW, there were some significantly downregulated proteins, including cytochrome b559 subunit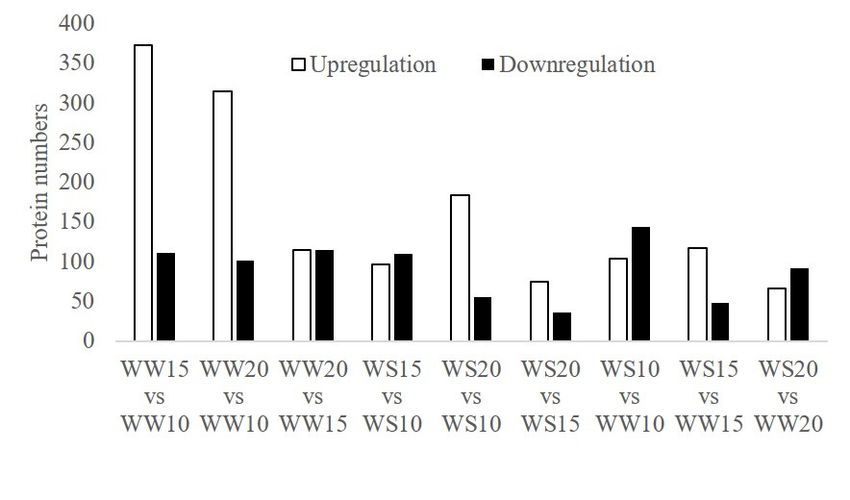
Int. J. Mol. Sci. 2020, 21, 4457                                                                                    7 of 19

 alpha, cytochrome b6-f complex iron-sulfur subunit, light-harvesting complex I chlorophyll a/b binding
 protein, oxygen-evolving enhancer protein, and photosystem II D2 protein at different durations
Int. J. Mol.
 after       Sci. 2020, 21, x FOR PEER REVIEW
         pollination.                                                                             7 of 18

                 Clusteranalysis
     Figure5.5.Cluster
     Figure                analysisofofproteins
                                         proteinsinvolved
                                                   involvedinin
                                                              thethe significant
                                                                   significant   pathway
                                                                               pathway     related
                                                                                       related     to photosynthesis
                                                                                                to photosynthesis in
     in pod
     pod    walls
          walls   at at  different
                      different    durations
                                 durations     afterpollination
                                             after   pollinationunder
                                                                   underWWWWand andWS.
                                                                                   WS.I,I, photosynthesis—antenna
                                                                                           photosynthesis—antenna
     proteins; II,
     proteins;  II, carbon
                    carbon fixation
                             fixation in
                                      in photosynthetic
                                          photosynthetic organisms;
                                                           organisms; III, photosynthesis.

       For the treatment
      Proteins   involvedofinWS,    some proteins,including
                                 photosynthesis,     including cytochrome
                                                                  oxygen-evolving
                                                                                b6-f enhancer
                                                                                      complex protein,      photosystem
                                                                                                  iron-sulfur    subunit,
F0F1 ATP synthase subunit gamma, oxygen-evolving complex/thylakoid lumenal 25.6 kDa protein,I
 II oxygen-evolving        enhancer   protein,  photosystem      I reaction  center  subunit    II, and   photosystem
 reaction
and         center subunit
      photosystem               N in the podenhancer
                        II oxygen-evolving       wall on protein,
                                                            DAP10, wereweresignificantly
                                                                              significantlyupregulated
                                                                                               upregulatedin(Figure
                                                                                                                 the pod5,
 Supplementary
wall                  File 3). However,
      at different durations                  there were
                                 after pollination   undersome       proteins
                                                              WS, while        presenting downregulation
                                                                          light-harvesting     complex I chlorophyllin the
pod    wall  on DAP15,      such  as cytochrome     b559  subunit    alpha, cytochrome      b6-f
a/b binding protein, oxygen-evolving enhancer protein, photosystem I P700 chlorophyll a apoproteincomplex     iron-sulfur
 subunit,
a2,        ATP synthaseIIsubunit
     and photosystem                  gamma,
                              D2 protein    wereoxygen-evolving       complex/thylakoid
                                                  significantly downregulated        (Figurelumenal     25.6 kDa protein,
                                                                                               5, Supplementary       File
photosystem      I P700    chlorophyll  a  apoprotein   a2, and   photosystem    I reaction
2). Under WW, there were some significantly downregulated proteins, including cytochrome b559 center   subunit  II.
subunitMeanwhile,      some proteins
          alpha, cytochrome             were expressed
                                  b6-f complex              differently
                                                  iron-sulfur   subunit,and   significantly in
                                                                          light-harvesting       the amino
                                                                                               complex         sugar and
                                                                                                           I chlorophyll
 nucleotide
a/b  binding sugar
               protein,metabolism,    the ascorbate
                           oxygen-evolving     enhancerandprotein,
                                                             aldarateandmetabolism,
                                                                          photosystem  the II
                                                                                           beta-alanine
                                                                                              D2 protein metabolism,
                                                                                                             at different
 the  carbon   metabolism,
durations after pollination.    the  starch  and   sucrose   metabolism,     the  citrate cycle,    the  glycine,   serine,
 and For
       threonine    metabolism,     the  linoleic  acid  metabolism,     oxidative   phosphorylation,
            the treatment of WS, some proteins, including oxygen-evolving enhancer protein,                  phagosome,
plant–pathogen
photosystem          interaction, proteasome,
                 II oxygen-evolving       enhancerandprotein,
                                                        the alpha-linolenic
                                                                 photosystemacid    metabolism
                                                                                 I reaction    centerin pod  wallsII,under
                                                                                                        subunit       and
 drought   stress  (Table   2).
photosystem I reaction center subunit N in the pod wall on DAP10, were significantly upregulated
(Figure 5, Supplementary File 3). However, there were some proteins presenting downregulation in
the pod wall on DAP15, such as cytochrome b559 subunit alpha, cytochrome b6-f complex iron-sulfur
subunit, ATP synthase subunit gamma, oxygen-evolving complex/thylakoid lumenal 25.6 kDa
protein, photosystem I P700 chlorophyll a apoprotein a2, and photosystem I reaction center subunit II.
     Meanwhile, some proteins were expressed differently and significantly in the amino sugar and
nucleotide sugar metabolism, the ascorbate and aldarate metabolism, the beta-alanine metabolism,
the carbon metabolism, the starch and sucrose metabolism, the citrate cycle, the glycine, serine, and
threonine metabolism, the linoleic acid metabolism, oxidative phosphorylation, phagosome, plant–
pathogen interaction, proteasome, and the alpha-linolenic acid metabolism in pod walls under
drought stress (Table 2).
Int. J. Mol. Sci. 2020, 21, 4457 8 of 19
Table 2. Different expression of proteins involved in some pathways in the pod wall under drought stress.
Fold
KEGG Accession Proteins
WS10 vs. WW10 WS15 vs. WW15 WS20 vs. WW20
A0A072UKS2 PfkB family carbohydrate kinase NS NS 0.4
A0A072VQZ5 UDP-D-apiose/UDP-D-xylose synthase NS NS 0.2
Amino sugar and nucleotide sugar
G7JUS9 UDP-glucuronic acid decarboxylase NS 3.3 0.4
metabolism
G7ID31 Chitinase NS NS 5.0
G7LA76 Chitinase (Class Ib)/Hevein NS NS 3.3
A0A072TLF4 Myo-inositol oxygenase 0.4 NS NS
NAD-dependent aldehyde
A0A072U2G7 0.2 3.3 NS
dehydrogenase family protein
A0A072UQP6 UDP-glucose 6-dehydrogenase 2.5 NS NS
G7L571 UDP-glucose 6-dehydrogenase NS 2.5 NS
UTP-glucose-1-phosphate
Ascorbate and aldarate metabolism A0A072V120 NS 2.5 NS
uridylyltransferase
A0A072V151 L-ascorbate oxidase 5.0 NS NS
A0A072VNM9 GME GDP-D-mannose-3, 5-epimerase NS 3.3 0.1
G7L1 × 0 GME GDP-D-mannose-3, 5-epimerase 2.5 NS 0.3
Aldo/keto reductase family
G7JTZ5 0.5 NS NS
oxidoreductase
G7KAG7 Thylakoid lumenal 29 kDa protein 0.3 NS NS
beta-Alanine metabolism A0A072UCM6 Glutamate decarboxylase NS NS 0.2
G7IT85 Phosphoglycerate kinase NS NS 3.3
G7IT86 Phosphoglycerate kinase NS NS 3.3
G7KJZ8 Glucose-6-phosphate isomerase NS NS 0.4
Carbon metabolism
G7L1U4 Ribose-5-phosphate isomerase A NS NS 0.4
I3S3S0 Cytosolic triosephosphate isomerase NS NS 2.0
A0A072VS77 Methylenetetrahydrofolate reductase NS 3.3 0.3
A0A072UCM8 Phosphotransferase 0.3 NS NS
A0A072UKS2 PfkB family carbohydrate kinase NS NS 0.4
A0A072UU47 Glycoside hydrolase family 1 protein 3.3 NS NS
Starch and sucrose metabolism
A0A072VLQ9 Starch synthase 2.5 NS NS
G7IJV7 Glycoside hydrolase family 3 protein 0.3 NS NS
G7KJZ8 Glucose-6-phosphate isomerase NS NS 0.4Int. J. Mol. Sci. 2020, 21, 4457 9 of 19
Table 2. Cont.
Fold
KEGG Accession Proteins
WS10 vs. WW10 WS15 vs. WW15 WS20 vs. WW20
E1 subunit-like 2-oxoglutarate
G7KVS0 NS NS 0.3
dehydrogenase
G7JYQ8 Aconitate hydratase NS NS 0.3
Citrate cycle (TCA cycle)
B7FJJ4 Pyruvate dehydrogenase E1 beta subunit NS 2.0 2.5
G7KHI5 Isocitrate dehydrogenase [NADP] NS NS 0.2
A2Q2V1 ATP-citrate lyase/succinyl-CoA ligase NS 2.5 0.1
A0A072URB1 Amine oxidase NS NS 5.0
A0A072V290 Amine oxidase NS NS 3.3
G7J7B0 Amine oxidase NS NS 5.0
A9YWS0 Serine hydroxymethyltransferase NS NS 0.2
Glycine, serine and threonine Glycine dehydrogenase
metabolism G7I9Z0 NS NS 0.4
[decarboxylating] protein
G7JJ96 Aminomethyltransferase NS NS 0.3
NAD-dependent aldehyde
G7JNS2 NS NS 0.4
dehydrogenase family protein
G7L9H1 Phosphoserine aminotransferase NS NS 0.3
A0A072UMH4 Lipoxygenase 0.5 NS NS
G7J629 Lipoxygenase 0.4 NS NS
G7LIX7 Lipoxygenase 5.0 NS NS
Linoleic acid metabolism
G7LIY0 Lipoxygenase 5.0 NS 0.4
G7LIY2 Lipoxygenase 10.0 NS NS
G7J632 Lipoxygenase 2.5 2.5 NS
Archaeal/vacuolar-type H+-ATPase
A0A072URM9 NS 2.0 NS
subunit A
A0A072V4G2 F0F1 ATP synthase subunit gamma NS 0.5 NS
A0A072W1H5 ATP synthase subunit beta NS 2.5 NS
Oxidative phosphorylation
A0A126TGR5 ATP synthase subunit alpha NS 2.0 NS
B7FN64 NADH dehydrogenase NS 0.4 NS
G7JIL4 V-type proton ATPase subunit a NS 2.5 0.3
G7I9M9 ATP synthase D chain NS 5.0 NSInt. J. Mol. Sci. 2020, 21, 4457 10 of 19
Table 2. Cont.
Fold
KEGG Accession Proteins
WS10 vs. WW10 WS15 vs. WW15 WS20 vs. WW20
Archaeal/vacuolar-type H+-ATPase
A0A072VSL4 NS NS 0.4
subunit B
Archaeal/vacuolar-type H+-ATPase
B7FMK2 NS NS 3.3
Phagosome subunit E
Archaeal/vacuolar-type H+-ATPase
G7KSI7 NS NS 0.3
subunit B
G7LIN7 Tubulin beta-1 chain NS NS 5.0
B7FNA2 EF hand calcium-binding family protein NS NS 2.5
G7I7Q4 Heat shock protein 81-2 NS 2.5 0.2
Plant–pathogen interaction
G7IDZ4 Heat shock protein 81-2 NS NS 0.1
A0A072U9J1 Heat shock protein 81-2 2.5 5.0 0.3
Glyceraldehyde-3-phosphate
A0A072TQB8 NS NS 10
dehydrogenase
B7FGZ8 Proteasome subunit beta type NS NS 2.5
Proteasome
G7JTX3 6S proteasome regulatory subunit S2 1B NS 5.0 0.3
I3RZQ6 Proteasome subunit alpha type NS NS 3.3
I3SSX1 Proteasome subunit alpha type NS NS 2.5
G7J5N1 Uncharacterized protein 3.3 NS NS
alpha-linolenic acid metabolism
Q711Q9 Allene oxide cyclase 2.5 0.1 NS
Fold change over 2.0 means significant (p < 0.05) upregulation and below 0.5 means significant (p < 0.05) downregulation. NS, nonsignificant.Int. J. Mol. Sci. 2020, 21, 4457 11 of 19
3. Discussion
3.1. Observation of Surface and Ultrastructure in the Pod Wall
Stomata were distinctly observed on the outer surface of the pod wall (Figure 1). Stoma acted
in respiration and transpiration and allowed CO2 to enter for operating photosynthesis as well.
Previous research has shown that stoma was also found on other NLGOs, such as the exposed
peduncles of wheat [22], the silique shell of oilseed rape [4], and the capsule wall of castor [5].
In addition, chloroplast, the important site for doing the light reaction of photosynthesis, was found in
cells of the pod wall (Figure 2). At the early stage of pod development, the structure of chloroplasts in
the pod wall is well-organized and intact, and the photosynthate, starch grains, are already observed
in the chloroplasts (Figure 2A,E). Similar results were reported when observing the ultrastructure
of the pod wall of pea [27] and chickpea [6]. Under WW, the pod wall at the late stage even could
produce starch grains (Figure 2D). NLOG could maintain functional activity at the late stage when
the photosynthetic activity of leaves declined [8,22,28]. However, drought stress could damage the
structure of chloroplast membranes and thylakoids, and few starch grains were produced (Figure 2H).
In addition, the epidermal hair, existing on the outer surface of the pod wall, likely acts to prevent
damage from direct sunlight and protect against water loss.
3.2. Response of Chlorophyll Concentration and Photosynthetic Enzyme Activities
In the pod wall of alfalfa, chlorophyll a and chlorophyll b could be detected, and the concentration
of chlorophyll a, chlorophyll b and total chlorophyll decreased with the development of pods (Table 1).
Similarly, the concentration of chlorophyll a, chlorophyll b, and total chlorophyll in cotton (Gossypium
hirsutum) leaves and NLGOs, including bracts, stems and boll shells, decreased with bolls developing,
and the decreasing rate of the concentration in stems and boll shells was lower than that in leaves at
the late stage of boll [28]. The chlorophyll biosynthesis was inhibited in the pod wall under drought
stress (Table 1), while the content change was lower in NLOG than in leaves to maintain relatively
high photosynthetic capacity [15,20,23]. Except for chlorophyll, photosynthetic enzymes are crucial for
operating photosynthesis as well. The activities of key enzymes in the C3 and C4 cycles in the pod wall
were determined in the present study and the activities of PEPC and RuBisCo both decreased with the
development of pods (Figure 3). In addition, the activity of PEPC was higher than that of RuBisCo,
and drought stress could induce the activity of PEPC (Figure 3). Previous studies reported that PEPC
could make more contributions to photosynthesis than RuBisCo in NLGOs [22]. Although the activity
of RuBisCo decreased under drought stress in NLGOs, the increasing activity of PEPC could, in part,
compensate to ensure dry matter production [21,23].
3.3. The Differential Expression of Proteins under Drought Stress
3.3.1. Photosynthesis-Antenna Proteins
Six proteins identified in the pod wall were chlorophyll a–b binding proteins, which are the
apoproteins of the light-harvesting complex of photosystem II that existed on the membrane of
chloroplasts [29]. I3SZG9 (Lhca3) is the PSI inner antenna protein (LCHI); Lhcb 1, Lhcb 4, Lhcb 5,
and Lhcb 6 belong to the PSII inner antenna proteins (LCHII). In the plants, 50% of chlorophyll associated
with LCHII play important roles in the regulation of light energy distribution and photoprotective
reaction. In this study, two types of antenna proteins identified in the pod wall were downregulated
with the development of pod, and their synthesis was limited by the drought stress (Figure 5; Table 1).
Similarly, the antenna proteins were downregulated in sugarcane (Saccharum officinarum) [30] and
cucumber (Cucumis sativus) [31] under drought stress, which implied that drought stress impeded the
synthesis of antenna proteins, suppressing the absorption of light. In addition, the downregulation of
these proteins could decrease energy and substance consumption to promote the operation of other
physiological activities for resisting drought stress [32].Int. J. Mol. Sci. 2020, 21, 4457 12 of 19
3.3.2. Photosynthesis
According to KEGG enrichment analysis for photosynthesis, the identified protein complex
participates in the reactions taking place on the thylakoid membrane. Proteins, including PetC, PsbS,
PsbQ, PsbO, and PsbC, were downregulated under WW (Figure 5, Supplementary File 2), which means
that the photosynthetic ability of the pod wall decreases as the pod developes. In addition, the PSII
components, including PsbE, PsbP, and PsbO, were downregulated under drought stress (Figure 5,
Supplementary File 2). PsbE is cytochrome b559 subunit α, and the set of these three proteins, PsbP,
PsbO, and PsbQ, was bound to the luminal surface of PSII, oxidizing water molecules to release
O2 [33]. PsaD, PsaN, and PsaB are subunits of the PSI complex, and their synthesis is suppressed by the
drought stress as well. F0F1 ATP synthase subunit γ (F0F1-ATPases), largely existing in chloroplasts,
mitochondria, and cell nuclei, was downregulated in this study, which resulted in the reduction of
ATP synthesis [34] and the decline of photosynthetic ability [35]. The downregulation of F0F1-ATPases
by drought stress was also found in poplar (Populus yunnanensis) [36] and soybean [37]. Drought stress
damages the electron transfer system on the thylakoid to reduce the photosynthetic ability of the pod
wall through suppressing the synthesis of F0F1-ATPases, cytochrome b6-f complex, and the proteins
involved in the photosystem [37].
3.3.3. Carbon Fixation in Photosynthetic Organisms
Under WW, PEPC, the key enzyme in the C4 cycle, was significantly upregulated in the pod
wall on DAP15, compared with that on DAP10 (Figure 5, Supplementary File 2). Drought stress
inhibited the synthesis of RuBisCo in leaves in alfalfa [38]. The induced proteins in the C4 cycle
could compensate for the decrease of photosynthetic ability resulting from the inhibition of proteins
in the C3 cycle under drought stress [39]. NLGOs of C3 plants might operate C3–C4 intermediate
photosynthesis or C4-similar photosynthesis [11]. Two cell types (mesophyll and Kranz cells) were
localized in the ears of wheat [11], in which the activity of PEPC was higher than in flag leaves, and the
activity of PEPC was higher than that of RuBisCo [40]. In addition, compared with WW, another
C4-pathway enzyme, aspartate aminotransferase, was significantly upregulated in the pod wall on
DAP15 under WS (Figure 5, Supplementary File 3). The upregulation of aspartate aminotransferase
contributed to increasing the stress resistance of plants and maintaining high photosynthetic abilities
under stress [41]. Some enzymes participating in the reduction period of the C3 cycle were upregulated
under drought stress, while others involved in the regeneration period of RuBisCo were downregulated
(Figure 5, Supplementary File 3). Fructose-1, 6-bisphosphatase and fructose-bisphosphate aldolase
were downregulated in pod walls on DAP10 under WS in comparison with WW, while triosephosphate
isomerase and phosphoglycerate kinase were upregulated in pod walls on DAP20. Phosphoglycerate
kinase, belonging to an upstream acting enzyme in the C3 cycle, had interaction with PEPC and
aspartate aminotransferase in the C4 cycle under drought stress, which was found in maize [42].
Drought stress could induce the synthesis of triosephosphate isomerase in rice [43] and maize [44] to
ensure the operation of photosynthesis.
3.3.4. Carbohydrate Metabolism
Starch grains were observed to be filling the chloroplasts in the pod wall on DAP10 under WS
(Figure 2), which meant that starch synthase was induced in pod walls on DAP10 by drought stress
(Table 2). The recent research reported that total carbohydrate content decreased in the pod wall of
soybean under drought stress, but not the starch content [7]. Enhance expression of starch synthase
presented the protective response to drought stress in the pod wall.
Identified proteins, including pyruvate dehydrogenase (PDH) E1 beta subunit and ATP-citrate
lyase/succinyl (ACL)-CoA ligase involved in the citrate cycle, were upregulated in pod walls on DAP15
under WS (Table 2). PDH produces chemical energy, and drought stress could promote the expression
of relative encoding genes in rice [45]. PDH is one component of the pyruvate dehydrogenase complexInt. J. Mol. Sci. 2020, 21, 4457 13 of 19
(PDC) that can oxidize pyruvate into acetyl-CoA and NADH. In addition, the overexpression of
the ACL gene could enhance drought resistance in tobacco (Nicotiana tabacum) [46]. Some other
proteins involved in the citrate cycle, including methylenetetrahydrofolate reductase, E1 subunit-like
2-oxoglutarate dehydrogenase, aconitate hydratase, isocitrate dehydrogenase [NADP] and ATP-citrate
lyase/succinyl-CoA ligase, were downregulated in pod walls on DAP20 under drought stress (Table 2).
The downregulation of these proteins impedes the carbohydrate metabolism in the pod wall at the late
growth stage. Previous research has shown that the stagnate of carbohydrate metabolism in the plants
under drought stress could cause the accumulation of sugar [47], which contributes to improving the
osmotic potential to enhance drought tolerance [38].
3.3.5. Energy Metabolism
Identified proteins, including archaeal/vacuolar-type H+-ATPase subunit A, ATP synthase subunit
beta, ATP synthase subunit alpha, and ATP synthase D chain, were upregulated in pod walls on DAP15
(Table 2). Budak et al. reported that ATP synthase subunit CF1 and ATP synthase subunit alpha had a
higher expression level in wild wheat, with stronger drought resistance [48]. Under drought stress,
the upregulation of these proteins involved in ATP synthesis could ensure energy metabolism in the
plants for maintaining the operation of main physiological activities [49]. Photosynthesis is sensitive
to drought stress, while respiration is not. The normal operation of respiration could provide the
necessary energy for decreasing the damage from drought stress [7].
3.3.6. Other Metabolism
Chitinase plays an important role in resistance to stress [50,51]. The activity of chitinase is low in
the plant, but drought stress can induce the expression of the chitinase gene in wheat [50] and faba
beans (Vicia faba) [51]. Similar results were found in the present study, where chitinase was upregulated
in the pod wall on DAP15 under drought stress (Table 2). Heat shock protein 90 (Hsp90) complex
regulated proteins fold and degrade and maintain stable plant cells [52]. Heat shock protein 81-2
(Hsp81-2) is a member of Hsp90 family and can be induced by drought stress in arabidopsis (Arabidopsis
thaliana) [53]. In the present study, Hsp81-2 involved in plant–pathogen interaction was identified and
upregulated in the pod wall on DAP10 and DAP15 under drought stress. Most of the lipoxygenases
(LOXs) identified were upregulated in the pod wall on DAP10 (Table 2). LOX participates in many
activities in the plants, and drought stress caused the rapid accumulation of LOX mRNA in barley [54].
The overexpression of CaLOX1 enhanced the resistance to drought stress in arabidopsis [55].
In summary, the structure of chloroplast in the pod wall is damaged at the late stage of development
under drought stress, but not at the early stage. The synthesis of some proteins involved in photosystem I,
photosystem II, and the regeneration period of RuBisCo in the pod wall at the early stage and TCA
cycle at the late stage are impeded under drought stress (Figure 6). Nevertheless, drought stress can
induce the activity of PEPC and promote the synthesis of some proteins participating in the pathway
of the C4 cycle and energy metabolism at the early stage and the reduction period of RuBisCo at the
late stage.
This study provides the ultrastructural, physiological, and proteomic changes in alfalfa pod walls
under drought stress. The results suggest that the pod wall shows the capability of conducting
photosynthesis and regulating the C4 photosynthetic pathway, ATP synthesis, and resistance
metabolism to ensure the operation of physiological reactions under drought stress.Int. J. Mol. Sci. 2020, 21, 4457 14 of 19
Int. J. Mol. Sci. 2020, 21, x FOR PEER REVIEW 14 of 18
Figure
Figure 6.6.TheThepathways
pathwaysof proteomic mechanisms
of proteomic in the pod
mechanisms wallpod
in the under drought
wall understress. a, Aspartate
drought stress.
aminotransferase; b, malate dehydrogenase;
a, Aspartate aminotransferase; c, malic enzyme;c,d,
b, malate dehydrogenase; phosphoglycerate
malic kinase; e, triosephosphate
enzyme; d, phosphoglycerate kinase;
isomerase; f, fructose-1,
e, triosephosphate 6-bisphosphate
isomerase; aldolase; g, fructose-1,
f, fructose-1,6-bisphosphate 6-bisphosphatase;
aldolase; h, ribose-5-phosphate
g, fructose-1,6-bisphosphatase;
isomerase; i, glucose-6-phosphate isomerase; j, starch synthase; k, pyruvate dehydrogenase
h, ribose-5-phosphate isomerase; i, glucose-6-phosphate isomerase; j, starch synthase; E1k,beta subunit;
pyruvate
l,dehydrogenase
aconitate hydratase; m, isocitrate dehydrogenase (NADP); n, E1 subunit-like
E1 beta subunit; l, aconitate hydratase; m, isocitrate dehydrogenase (NADP); 2-oxoglutarate
dehydrogenase,
n, E1 subunit-likeo, ATP-citrate lyase/succinyl-CoA
2-oxoglutarate ligase. Three
dehydrogenase, squares from left
o, ATP-citrate to right represent WS10
lyase/succinyl-CoA vs.
ligase.
WW10, WS15 vs. WW15, and WS20 vs. WW20, respectively. The red
Three squares from left to right represent WS10 vs. WW10, WS15 vs. WW15, and WS20 vs. squares represent significant
upregulation at the 0.05 probability level. The green squares represent significant low-regulation at the 0.05
WW20, respectively. The red squares represent significant upregulation at the 0.05 probability level.
probability level. The white squares represent no significance. The red arrows show the damaged part of the
The green squares represent significant low-regulation at the 0.05 probability level. The white squares
chloroplast membrane in the pod wall under WS. Define the Dotted black arrow if possible
represent no significance. The red arrows show the damaged part of the chloroplast membrane in the
pod wall under WS. Define the Dotted black arrow if possible
4. Material and Method
4. Material and Method
4.1. Material
4.1. Material
M. sativa cv. Zhongmu No. 2 seeds were sown in the plastic pots (weight 0.5 kg, height 30 cm, base
diameter 19 cm,cv.
M. sativa and top diameter
Zhongmu No.252 cm)
seedsin awere
greenhouse
sown inintheOctober 2015.
plastic potsEach pot was
(weight 0.5filled with a mixture
kg, height 30 cm,
soil
baseofdiameter
vermiculite, peat,and
19 cm, andtop
black soil by 2:1:1
diameter (total
25 cm) in asoil weight 3.5in
greenhouse kg,October
water content 23%).pot
2015. Each Four seedlings
was filled
with a similar growth status were kept in each pot when the seedlings’ height was around 10 cm.
with a mixture soil of vermiculite, peat, and black soil by 2:1:1 (total soil weight 3.5 kg, water content They were
equivalently and adequately watered every two days. All plants were cut till 10 cm, and
23%). Four seedlings with a similar growth status were kept in each pot when the seedlings’ height was then pots were
moved out of and nearby the greenhouse, without any shelter, in April 2016. Every day, each pot was
around 10 cm. They were equivalently and adequately watered every two days. All plants were cut till
weighed with an electronic scale and watered to 7 kg. From 18 April (before visible bud stage), a drought
10 cm, and then pots were moved out of and nearby the greenhouse, without any shelter, in April 2016.
stress treatment, denoted by WS, was started by watering each pot to 4.5 kg, while the control, denoted by
Every day, each pot was weighed with an electronic scale and watered to 7 kg. From 18 April (before
WW, was still watered to 7 kg. Plants in WW and WS treatments were pollinated artificially every 5 days
visible bud stage), a drought stress treatment, denoted by WS, was started by watering each pot to
from 6 June till 21 June. After pollination, the flowers pollinated were marked with hang tags. On 26 June,
4.5 kg, while the control, denoted by WW, was still watered to 7 kg. Plants in WW and WS treatments
the pod walls of marked pods with 3 replicates were collected on day 5 (DAP5), day 10 (DAP10), day 15
were pollinated
(DAP15), and dayartificially
20 (DAP20)every 5 days
after from 6under
pollination June till
WW 21 June.
and WSAfter pollination, the flowers pollinated
treatments.
were marked with hang tags. On 26 June, the pod walls of marked pods with 3 replicates were collected
on day 5 (DAP5), day 10 (DAP10), day 15 (DAP15), and day 20 (DAP20) after pollination under WW
and WS treatments.Int. J. Mol. Sci. 2020, 21, 4457 15 of 19
4.2. Surface and Ultrastructure Characteristics Observation for Pod Wall
The pod walls of DAP10 under WW and WS treatments were used as samples to observe the
surface characteristics by using a scanning electron microscope (manufacture Hitachi S-570, city Japan).
The pod walls of DAP5, DAP10, DAP15, and DAP20 under WW and WS treatments were used as
samples for taking images with a transmission electron microscope (manufacture Hitachi H-7500,
city Japan) to observe ultrastructure characteristics. Pretreatments of the pod walls for observation by
using the scanning and transmission electron microscopes were conducted according to [56].
4.3. Chlorophyll Concentration of Pod Walls Measurement
The pod walls on DAP5, DAP10, DAP15, and DAP20 under WW and WS treatments were sampled
and cut into filaments, respectively. Chlorophyll a and chlorophyll b concentrations in each sample
with three repetitions were determined by soaking in extracting solution, filling in the 10 mL centrifuge
tube. The extracting solution was the mixture of acetone and absolute ethyl alcohol by the volume rate
of 2:1. Absorbancy of extracting solution at 663 and 645 nm was determined by using a ultraviolet
spectrophotometer (manufacture UH5300, city Japan) to calculate the concentration of chlorophyll a
and chlorophyll b. The gross chlorophyll concentration was the sum of chlorophyll a and chlorophyll b.
4.4. Photosynthetic Enzyme Activities Assays
The pod walls on DAP5, DAP10, DAP15, and DAP20 under WW and WS treatments were sampled
with three repetitions. Each sample was homogenized in extracting solutions using a pestle and
mortar in ice. The extracting solution contained 1 M Tris-H2 SO4 (pH 7.8), 5% glycerol, 7 mM DTT,
and 1 mM EDTA. The homogenate was filtered, and then the filtrate was centrifuged at 8000× g for
10 min at 4 ◦ C. The supernatant was saved in an ice bath for subsequent enzyme assay. Photosynthetic
enzyme activities were determined using an ultraviolet spectrophotometer (UH5300, Hitachi, Japan) at
340 nm. The reaction solution for phosphoenolpyruvate carboxylase (PEPC) contained 0.1 mol L−1
Tris-H2 SO4 (pH 9.2), 0.1 M MgCl2 , 100 mM NaHCO3 , 40 mM PEP, 1 mg mL−1 NADH and MDH [57].
The reaction mixture for ribulose-1,5-bisphosphate carboxylase (RuBisCo) contained 100 mM Tris-HCl
(pH 7.8), 160 U/mL CPK, 160 U mL−1 GAPDH, 50 mM ATP, 50 mM phosphocreatine, and 160 U mL−1
phosphoglyceric kinase [58].
4.5. Proteomic Analysis
The pod walls on DAP10, DAP15, and DAP20 under WW (denoted by WW10, WW15, and WW20,
respectively) and WS (denoted by WS10, WS15, and WS20, respectively) treatments were collected
and stored at −80 ◦ C. Then, 0.05 g tissues of each sample with 3 repetitions were ground in liquid
nitrogen before the addition of 200 µL plant total protein lysis buffer containing 20 mM Tris-HCl
(pH7.5), 250 mM sucrose, 10 mM EGTA, 1% Triton X-100, protease inhibitor, and 1 M DTT. The mixture
was incubated on ice for 20 min. Plant cell debris was removed via centrifugation at a speed of relative
centrifugal force of 15,000× g for 15 min at 4 ◦ C. The supernatant was collected, and the rest was
centrifugated again, as above. The protein concentration was determined with a Bio-Rad Protein Assay
kit based on the Bradford method, using BSA as a standard at a wavelength of 595 nm. All independent
protein extractions were performed.
Briefly, 60 µg protein samples were reduced with 5 µL 1 M DTT for 1 h at 37 ◦ C, alkylated with
20 µL 1 M iodoacetamide (IAA) for 1 h in the dark, and then digested with sequencing-grade modified
trypsin (Promega) for 20 h at 37 ◦ C. Digested peptides were separated with chromatography using an
Easy-nLC1000 system (Thermo Scientific) autosampler. The peptide mixture was loaded on a self-made
C18 trap column (C18 3 µm, 0.10 × 20 mm) in solution A (0.1% formic acid), then separated with a
self-made Capillary C18 column (1.9 µm, 0.15 × 120 mm), with a gradient solution B (100% acetonitrile
and 0.1% formic acid) at a flow rate of 600 nL/min. The gradient consisted of the following steps: 0–10%
solution B for 16 min, 10–22% for 35 min, 22–30% for 20 min, then increasing to 95% solution B in 1 minInt. J. Mol. Sci. 2020, 21, 4457 16 of 19
and holding for 6 min. Separated peptides were examined in the Orbitrap Fusion mass spectrometer
(Thermo Scientific, Waltham, MA, USA), with a Michrom captive spray nanoelectrospray ionization
(NSI) source. Spectra were scanned over the m/z range 300–4000 Da at 120,000 resolution. An 18-s
exclusion time and 32% normalization collision energy were set at the dynamic exclusion window.
4.6. Statistical Analysis
The significance of differences between mean values of physiological parameters, including the
chlorophyll concentration and the enzyme activities under WW and WS, were analyzed using an LSD
test by software SAS version 8.0.
RAW files of mass spectrometry were extracted using the MASCOT version 2.3.02 (Matrix Science,
London, UK). Mass spectrometry data were searched, identified, and quantitatively analyzed using
the software of Sequest HT and Proteome Discover 2.0 (Thermo Scientific). The database used in
this study was uniprot-Medicago.fasta. Protein species with at least two unique peptides were
selected for protein species quantitation, and the relative quantitative protein ratios between the two
samples were calculated by comparing the average abundance values (three biological replicates).
Protein species detected in only one material (A-line or B-line), with at least two replicates considered
to be presence/absence protein species. Additionally, Student’s t-tests were performed to determine
the significance of changes between samples. A fold-change of >2 and p-value < 0.05 in at least two
replicates were used as the thresholds to define differently accumulated protein species.
Supplementary Materials: Supplementary materials can be found at http://www.mdpi.com/1422-0067/21/12/4457/s1.
Author Contributions: H.W. and P.M. designed the experiments; H.W. did the experiments wrote the manuscript.
Q.Z. and P.M. reviewed and edited the manuscript. All authors have read and agreed to the published version of
the manuscript.
Funding: This research was financially supported by the China Agriculture Research System (CARS-34) and the
earmarked fund for the Beijing Common Construction Project.
Conflicts of Interest: The authors declare no conflict of interest.
References
1. Loomis, R.S.; Williams, W.A. Maximum crop productivity: An extimate. Crop Sci. 1963, 3, 67–72. [CrossRef]
2. Shen, Y. The Most Improtant Chemistry Reaction on the Earth-Photosynthesis; Tsinghua University Press: Beijing,
China, 2000; pp. 2–13.
3. Long, S.; Marshall-Colon, A.; Zhu, X. Meeting the global food demand of the future by engineering crop
photosynthesis and yield potential. Cell 2015, 161, 56–66. [CrossRef] [PubMed]
4. Wang, C.; Yang, J.; Hai, J.; Chen, W.; Zhao, X. Photosynthetic features of leaf and silique of ‘Qinyou 70 oilseed
rape (Brassica napus L.) at reproductive growth stage. Oil Crop. Sci. 2018, 3, 176.
5. Zhang, Y.; Mulpuri, S.; Liu, A. Photosynthetic capacity of the capsule wall and its contribution to carbon
fixation and seed yield in castor (Ricinus communis L.). Acta Physiol. Plant. 2016, 38, 245. [CrossRef]
6. Furbank, R.T.; White, R.; Palta, J.A.; Turner, N.C. Internal recycling of respiratory CO2 in pods of chickpea
(Cicer arietinum L.): The role of pod wall, seed coat, and embryo. J. Exp. Bot. 2004, 55, 1687–1696. [CrossRef]
7. Sengupta, D.; Kariyat, D.; Marriboina, S.; Reddy, A.R. Pod-wall proteomics provide novel insights into
soybean seed-filling process under chemical-induced terminal drought stress. J. Sci. Food Agric. 2019,
99, 2481–2493. [CrossRef] [PubMed]
8. Wang, H.; Hou, L.; Wang, M.; Mao, P. Contribution of the pod wall to seed grain filling in alfalfa. Sci. Rep.
2016, 6, 26586. [CrossRef]
9. Tambussi, E.A.; Bort, J.; Guiamet, J.J.; Nogués, S.; Araus, J.L. The photosynthetic role of ears in C3 cereals:
Metabolism, water use efficiency and contribution to grain yield. Crit. Rev. Plant Sci. 2007, 26, 1–16.
[CrossRef]
10. Jiang, Q.; Roche, D.; Durham, S.; Hole, D. Awn contribution to gas exchanges of barley ears. Photosynthetica
2006, 44, 536–541. [CrossRef]You can also read