An Experimental-Numerical Approach for Modelling the Mechanical Behaviour of a Pneumatic Tyre for Agricultural Machines - MDPI
←
→
Page content transcription
If your browser does not render page correctly, please read the page content below
applied
           sciences
Article
An Experimental–Numerical Approach for Modelling
the Mechanical Behaviour of a Pneumatic Tyre for
Agricultural Machines
Alexandros Sotirios Anifantis 1 , Maurizio Cutini 2              and Marco Bietresato 3, *
 1    Department of Agricultural and Environmental Science, University of Bari Aldo Moro, via Amendola 165/A,
      I-70126 Bari (BA), Italy; alexandrossotirios.anifantis@uniba.it
 2    Consiglio per la ricerca in agricoltura e l’analisi dell’economia agraria (CREA)-Centro di ricerca Ingegneria e
      Trasformazioni agroalimentari (CREA-IT), via Milano 43, I-24047 Treviglio (BG), Italy;
      maurizio.cutini@crea.gov.it
 3    Faculty of Science and Technology, Free University of Bozen/Bolzano, Piazza Università 5,
      I-39100 Bolzano (BZ), Italy
 *    Correspondence: marco.bietresato@unibz.it; Tel.: +39-0471-017181

 Received: 20 April 2020; Accepted: 14 May 2020; Published: 18 May 2020

 Featured Application: The mechanical behaviour of an agricultural pneumatic tyre was investigated
 experimentally and the results, linearized in adjacent stretches, were used to tune a finite element
 model, including both the carcass and the air.

 Abstract: The mechanical behaviour of an agricultural tyre is a matter of extreme interest as it is
 related to the comfort of operators, to the adherence of agricultural machines, and to the compaction
 of agricultural soil. Moreover, the deformability of the tyres plays a fundamental role in vehicle
 stability in terms of side rollover. The behaviour of a loaded tyre during its deformation is complex,
 due to the combined contributions of the carcass components, the tread rubber and the air contained
 within it. Therefore, this study proposes an experimental–numerical approach for the mechanical
 characterization of agricultural tyres based on real-scale experiments and matches these results with
 a finite-element (FE) model. The tyre flattening in the elastic field has been described using two
 coefficients (Young’s modulus “E”, Poisson’s ratio “ν”), whose values have been identified with an
 iterative FEM procedure. The proposed approach was applied to two different tyres (420/85 R24 and
 460/85 R34), each one inflated at two different pressures (1.0 bar and 1.6 bar). Young’s modulus was
 appreciated to be highly variable with the inflation pressure “p” of the tyres. Furthermore, the response
 surface methodology was applied to find two mathematical regression models, useful for studying
 the variations of the tyre footprint dimensions according to the type of tyre. This simple approach
 can be applied in other simulations without suffering any loss of accuracy in the description of
 the phenomenon.

 Keywords: farm tractor; vertical loading of tyre; tyre flattening; FE model; safety; response
 surface methodology

1. Introduction
     In recent decades, agriculture has faced a gradual transition towards higher working speeds for all
machines involved and greater use of transport-oriented farm tractors, due to a constantly-increasing
demand for higher productivities and lower costs. This change raises lots of issues for many technical
systems of agricultural vehicles. In particular, agricultural tyres are the mechanical interfaces by which
the engine power of wheeled tractors is delivered to the ground, enabling a vehicle to travel safely and

Appl. Sci. 2020, 10, 3481; doi:10.3390/app10103481                                     www.mdpi.com/journal/applsci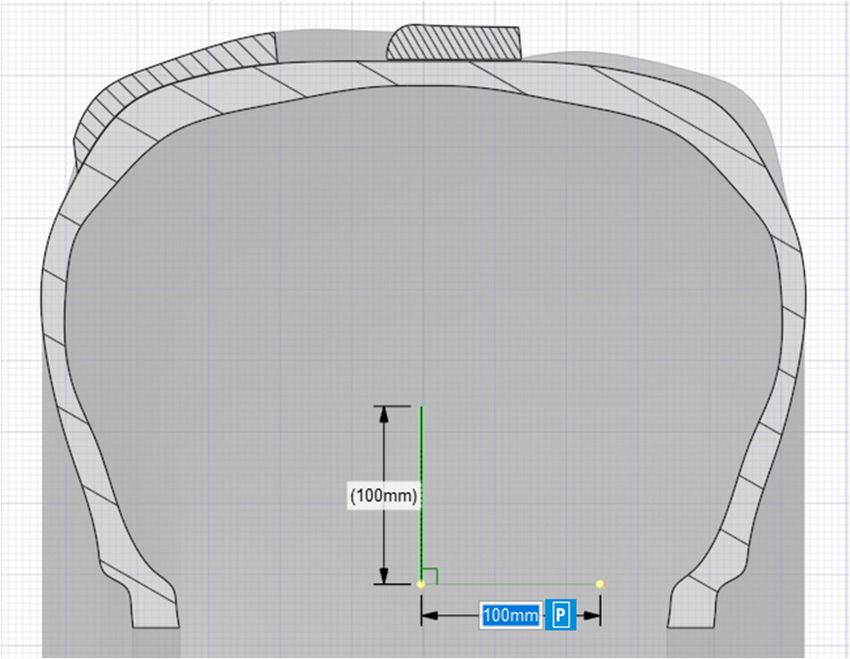
Appl. Sci. 2020, 10, 3481                                                                            2 of 20

to perform its tasks. Therefore, tyres need to retain a high level of efficiency and effectiveness both
in the field and on the road. There are several aspects involved, from the capability for the tyres to
limit energy waste while rolling (efficiency), to the capability of accomplishing successfully the tasks for
which they are intended and/or which they are requested to complete (effectiveness). In this regard,
the most important technical demands concern the conciliation of two only-apparently antithetical
aspects involving the tyres: the safety and the performance of the vehicle when it operates both on
the road and in the field. As regards safety, intended as the preservation of a safe situation despite
the presence of an elastic medium such as tyres, vehicle stability remains a very relevant topic [1],
as well as the comfort for professional operators, intended as the mitigation of whole-body vibrations
and the protection of workers from correlated occupational diseases [2]. As regards performance,
the focus is, in this case, on the maximization of adherence to the road, of traction in the field, and the
limitation of soil compaction. The necessary premise is the knowledge of the deformation of the tyre in
correspondence to the contact area with the ground, e.g., detected by making use of laser sensors in a
purely-experimental approach [3]. Apart from the instrumentation, the same article [3] also reports
an interesting fact that is indicative of the complexity of the phenomenon: tyre deformation due to
contact with the ground affects not only the footprint area (±40◦ from the centre of the footprint) but
also other parts close to it (up to ±140◦ ). Other studies have also highlighted the need to consider the
many operative conditions in order to gain a clear understanding of tyre performance. For example,
the importance of inflation pressure on adhesion and slippage was investigated in [4] and [5,6],
respectively. The control of these parameters has a fundamental role in tyre and vehicle performances
and in fuel consumption [7], especially for large towed vehicles [8–10], and thus reduces energy loss,
which is crucial for agriculture [11–14]. A centralized system to control the inflation pressure of
agricultural tractor tyres according to the soil and working conditions was developed and tested in [15],
and a wireless power charger for the pressure sensors was the object of another recent contribution [16].
The tyre pressure can also be identified using 3-axis accelerometers and by exploiting the relationship
between tyre pressure and characteristic frequency of the rim, as explained in [17].
      The most widespread approach that emerges from the literature, in this case, is to make use of the
geometrical characteristics and of the constitutive equations of the materials of the bodies in contact
(e.g., using the values of the coefficients regarding the tyre materials collected in [18]). For example,
in [19,20], a model for the prediction of tyre traction capability from a series of geometrical and elastic
tyre properties, soil characteristics and slippage is presented. Other authors use a similar approach
to identify a correlation between the nominal characteristics of tyres and their two-dimensional
footprint (2D), considering the tyre footprint on a rigid surface [21,22]. However, 3D models of the
whole wheel also have been developed to further deepen the knowledge about the soil-compaction
phenomenon [23] and to develop some indexes that, taking account of both the contact area and the
volume of soil involved in the footprint, can be related to the compaction and traction behaviour
of a considered tyre [24,25]. Moreover, the technological evolution of the tyre structure brought
about by the “improved flexion” and “very high flexion” tyres (namely, IF and VF tyres) and the
concept of new tread profiles, different from classic ones, confirm the importance of continuing to
improve the modelling of agricultural tyres to deepen the knowledge of their operative behaviour.
An accurate study of the tyre vertical dynamics and, hence, of the vehicle dynamics, can require
models of agricultural tyres that are more complex than a damper-spring system [26,27], but which
can also take into account the elastic, mechanical and geometric properties. This approach is present
in the recent scientific literature concerning the automotive [28,29] and, especially, in all the works
using simulation software to study the driveability of the vehicle in order to develop Advanced
Driver-Assistance Systems (ADAS). The main properties regarding on-road tyre performances (e.g.,
longitudinal, lateral forces or self-aligning moment) can be expressed by the so-called “magic formula”,
an empirical model proposed by Hans B. Pacejka, commonly used to simulate steady-state tyre forces.
The magic formula can be applied whatever the structure of the wheel: indeed, it has also been
applied to a mechanical elastic wheel (ME-Wheel) for an off-road vehicle to set up an integrated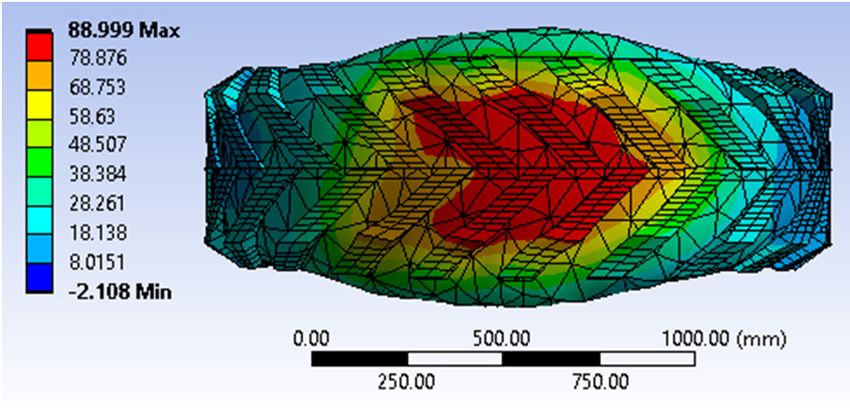
Appl. Sci. 2020, 10, 3481                                                                               3 of 20

yaw and rollover stability control [30]. However, it is also necessary to consider the geometry and
mechanical properties of the tyres when developing models of agricultural vehicle aimed at studying
both stability [31,32], and traction and soil compacting [33,34]. To this end, the approach based on
a tyre equipped with strain sensors, also known as “Intelligent Tyre”, seems particularly promising,
thus allowing relevant vehicle dynamics information to be provided [35]. In order to simulate the
behaviour of an agricultural tyre, the finite elements method (FEM) has been hence considered the
most appropriate, e.g., for studying deformation of an off-road tyre based on experimental results
of characterization of the material [36,37]. The influence of tyre pressure on the deformations of an
agricultural tractor wheel has been studied in [38] by means of a plane-symmetric FE model of the tyre
in the frontal plane. A more detailed 3D FE model was used in [36]; this detailed multi-component
model accurately reproduces the real structure of the tyre with its tread, inner fabric, carcass, sidewalls,
circumferential and radial cords and bead cores. The modelling of the interaction of a tractor tyre
with the soil surface also requires a high detail of this last, if the aim is to analyse the contact pressure
distribution for several wheel loads and tyre inflation pressures, as in [39,40]. In these cases, the soil
structure has been modelled through a multilayered mesh with its attributes corresponding to the soil
properties, and, the tyre–soil interface pressures having been validated by equipping a tyre thread
with six miniature pressure transducers [39] or by using proper lab equipment [40].
      The aim of this work is to study the elastic behaviour of an agricultural tractor tyre under a
vertical load to identify which physical parameters (inflation pressure, mechanical characteristics of the
tyre, geometry and dimensions) most influence the overall elastic coefficients of the tyre. In addition,
the mathematical development of the global elastic force-vertical displacement response has been
investigated to determine whether this development can be considered linear, linear in stretches
or non-linear. In particular, the proposed approach does not require any preliminary destructive
inspection of the tyre structure and it is based on the vertical elastic characterisation of the tyre in
the laboratory, the mathematical statistical analysis of the tyre elastic coefficients and the subsequent
creation of an FE model to develop a structurally-homogeneous three-dimensional model which
exhibits the same deformation of the corresponding real system (i.e., the same flattening). Such a tuned
model is useful for predicting the main footprint dimensions and for any simulation including this
elastic medium, e.g., to foresee the soil compaction or calculate the attitude of a vehicle on uneven or
inclined grounds. Finally, the response surface methodology was applied to find two mathematical
regression models by means of ANOVA tests, useful in studying the variations of the tyre footprint
dimensions while varying the tyre type.

2. Materials and Methods
      In this study, a mixed experimental–numerical approach was proposed: after some experimental
trials, a simplified FE model of the tyre (i.e., structurally homogeneous, without the subparts present in
real tyres) was iteratively tuned by acting on the material properties (Young’s modulus—E, Poisson’s
ratio—ν). By doing so, it was possible to find two values (for E and ν) that include the contribution of
all the different parts that compose the tyre, not all made of rubber. The application of the proposed
methodology led to the definition of the above-mentioned elastic coefficients on two different tyres.
A sensitivity analysis on Young’s modulus and on Poisson’s ratio was carried out. Thanks to the same
FE model, it was also possible to verify a hypothesis of linearity of the flattening varying the pressure
between the two operating limits investigated experimentally (1.0 bar, 1.6 bar), simulating the vertical
loading of a tyre inflated at 1.3 bar, and the linearity of the deflections of the FE model varying its elastic
coefficients, using elastic coefficients derived from the coefficients at 1.0 bar and 1.6 bar. Moreover, it was
also possible to calculate the maximum longitudinal and transversal dimensions of the footprint area
on the ground, assuming an approximately elliptical shape, by varying the vertical load and the
inflation pressure. Finally, the response surface methodology was applied to find two mathematical
regression models, useful in studying the variations of the tyre footprint dimensions while varying
type of tyre, inflation pressure and material properties.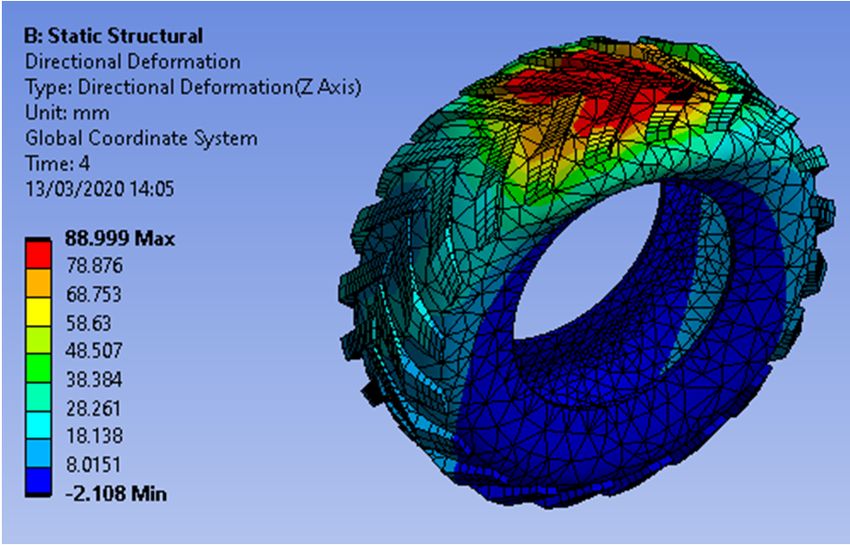
Appl. Sci. 2020, 10, 3481                                                                                                         4 of 20

      The approach followed in this study to determine the elastic behaviour of an agricultural tractor
tyre is shown in the flow diagram in Figure 1 and consists of three phases:

•     (Phase 1) “experimental phase” or “data generation and collection phase”; a series of experiments for
         Appl. Sci. 2020, 10, x FOR PEER REVIEW                                                                       4 of 20
      the determination of vertical force-displacement diagrams of agricultural tyres were carried out
      on•a full-scale
               (Phase 1) vehicle       (specifically,
                             “experimental              a farm
                                            phase” or “data      tractor);
                                                              generation and collection phase”; a series of experiments for
•              the   determination     of vertical force-displacement
      (Phase 2.1) “numerical phase” or “data interpretation              diagrams
                                                                             phase”;of agricultural  tyres were
                                                                                        the experimental        carried
                                                                                                               data  wereoutsuitably
               on a full-scale vehicle (specifically, a farm tractor);
      processed to highlight the tyre-flattening phenomenon trends and associate a characteristic value
         •     (Phase 2.1) “numerical phase” or “data interpretation phase”; the experimental data were suitably
      of the elastic      coefficient;
               processed to highlight the tyre-flattening phenomenon trends and associate a characteristic
•     (Phasevalue2.2) of“simulation      phase” or “virtual model tuning phase”; a three-dimensional model of a
                           the elastic coefficient;
         • was
      tyre     (Phasecreated,     a staticphase”
                         2.2) “simulation    loading     situation
                                                    or “virtual       was applied
                                                                model tuning            and the coefficients
                                                                             phase”; a three-dimensional     modelthat   define the
                                                                                                                   of a tyre
      material was    created,
                   were          a static loading
                            iteratively    varied situation
                                                   to have thewassimulation
                                                                   applied andoutput
                                                                                 the coefficients
                                                                                          alignedthat
                                                                                                    withdefine
                                                                                                           whatthewas
                                                                                                                   material
                                                                                                                       found in the
               were iteratively varied to have the simulation output aligned with what was found in the
      experimental         tests.
              experimental tests.

                    1. EXPERIMENTATION

                    Tyre testing conditions

                    • Tyre structure (dimensions, ply
                      number, tread design)
                    • Rubber characteristics
                      (elastic coefficient, Poisson’s ratio,
                      thermal conductivity)                                              Tyre-system response
                    • Internal air pressure (1.0, 1.6 bar)
                                                                      Complex            • Load–deformation curve
                    Test operating conditions                        phenomena             (flattening curves if vertical)

                    • Load on a single tyre
                      (entity, application time)
                    • Surface characteristics (stiffness)
                    • Environmental temperature

                    2.2 FEM SIMULATION                                                   2.1 EXPERIMENTAL DATA PROCESSING

                    Model settings

                    • Drawing of spatial dominion                                        Graphical and numerical study
                    • Selection of tyre material
                                                                                          • Elastic behaviour
                      properties
                                                                     Comparison             schematisation/linearisation
                    • Application of loads (and other
                                                                                            (at 1.0 bar, 1.6 bar)
                      boundary conditions) and
                      computation of displacements

                    Iteration
                    • Modification of material                  No    Do results
                      properties                                      coincide?

                    Tuned FE model                                    Yes

                     • Tyre mean characteristics for
                       rubber and air (global elastic
                       coefficient, global Poisson’s ratio)
                       at 1.0 bar and 1.6 bar

                     • Calculation of tyre mean
                       characteristics for rubber and air
                       (global elastic coefficient, global
                       Poisson’s ratio) at 1.3 bar

                                                                                          • Hypothesis of elastic behaviour
                     • Simulation of deflection at 1.3 bar           Comparison             schematisation/linearisation at 1.3
                                                                                            bar

                                                               No                         • Tyre footprint main dimensions
                                                                     Do results    Yes
                                                                                            (longitudinal and transversal axes)
                                                                     coincide?
                                                                                            at 1.0 bar, 1.3 bar, 1.6 bar

      Figure 1. Approach followed for the computation of the mean characteristics for the schematisation of
      a tyre (including the concurrent behaviour of rubber and air).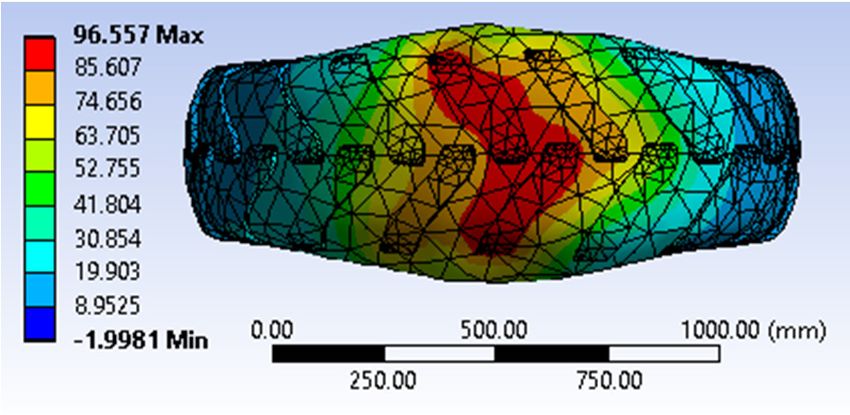
Appl. Sci. 2020, 10, 3481 5 of 20
All output parameters from phase 1 have been measured experimentally, whilst the parameters
from Phase 2.1 have been calculated and those from Phase 2.2 have been derived from FE modelling.
Each phase corresponds to a series of activities, detailed in the following paragraphs.
2.1. Experimental Phase
The experimental measurement of the vertical stiffness of the tyres was carried out on two different
agricultural tyres (see Table 1) and in two pressure conditions (100 kPa and 160 kPa, i.e., 1.0 bar and
1.6 bar), for a total of 4 different tyre-loading scenarios. The main characteristics of the tested tyres,
which are stamped on the sidewalls of tyres using a technical information format compliant with
ETRTO standard [41], are shown in Table 1. The indicated tyres have very different sizes and they have
been chosen because each one can be considered as representative of a specific class of tyres usually
equipping 4WD farm tractors (420/85 R24 for front tyres, 460/85 R34 for rear tyres).
Table 1. Nominal characteristics of the tested tyres.
Tested Tyre Load and Speed Tread Width Radius Index Load Capacity
Denomination Index (ETRTO) (mm) (mm) (kgf @ 160 kPa)
420/85 R24 137-A8/134-B 429 625 2120
460/85 R34 147-A8/144-B 467 775 2800
In order to replicate the geometry with CAD software, the two indicated tyres were removed from
their own rims and the transversal section was measured. As the tested tyres were worn, some of their
dimensions differed from the nominal ones:
• the 420/85 R24 tyre presented a radius index of 600 mm at 1.0 bar and of 602 mm at 1.6 bar with
1240 kgf of load;
• the 460/85 R34 presented a radius index of 762 mm at 1.0 bar and of 765 mm at 1.6 bar with
1140 kgf of load.
The chosen load values for the elastic characterization spanned from 0 N (corresponding to an
unladen tyre) to 23 kN (maximum load). The maximum load was chosen to be the same for the four
samples and in order to reach at least 80% of the nominal load capacity indicated for the 460/85 R34 tyre.
Two repetitions of the loading sequence were carried out in all four experimental cases.
The tyres were mounted on a “Laser 110 4WD” farm tractor by Same (Treviglio, Bergamo, Italy; [42]).
The tractor was placed with the tyre to be tested over a weighing platform (M13 by Adda Bilance,
Cassano d’Adda, MI, Italy) and a position transducer (PT1E by Celesco, Toronto, Canada) was
connected with a cable to the wheel hub. The tractor axle with the tested tyre was lifted by a crane
(ZKKE 16 t by Demag, Agrate Brianza, MB, Italy) in order to start in a condition of unloaded tyre.
An acquisition system (DEWE-43A by Dewesoft, Roma, Italy) was set to start when the weight,
measured by the platform, reached the value of 100 N. Once the tractor was completely released from
the crane, the tractor rested on the floor (and hence, one of its wheel on the platform); an additional
weight was then loaded on the axle of interest by pulling it down through a hydraulic cylinder
(equipment developed by CREA-IT, Treviglio (BG), Italy) connected to the tractor hook. The load
was applied with a medium speed of about 2 kN·s−1 . The frequency of acquisition was set to 100 Hz.
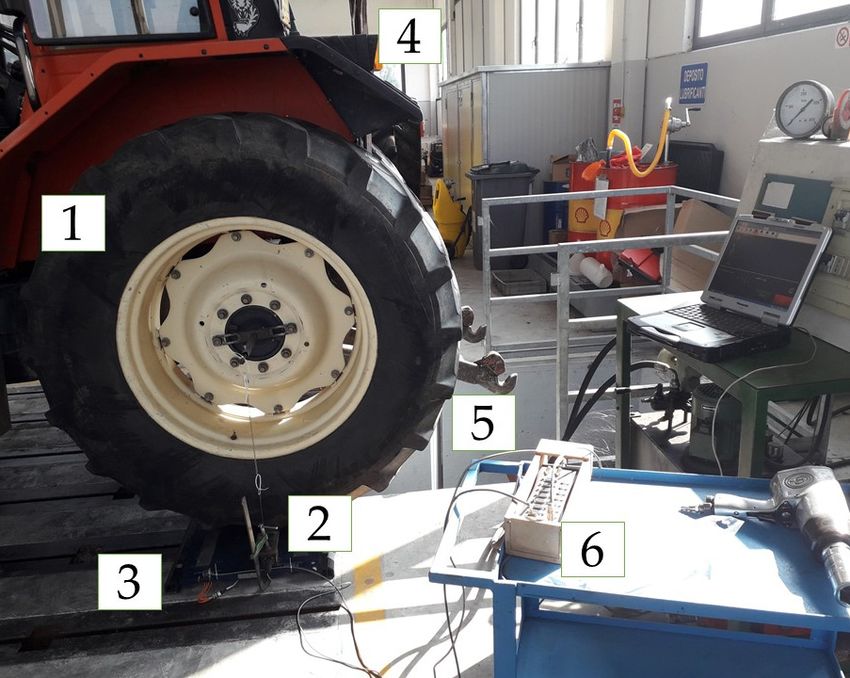
The experimental setup is reported in Figure 2.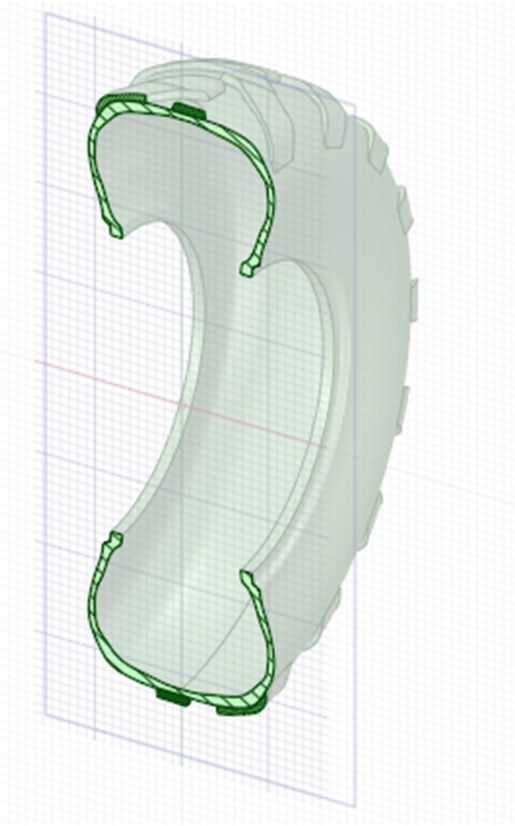
Appl. Sci. 2020, 10, 3481 6 of 20
Appl. Sci. 2020, 10, x FOR PEER REVIEW 6 of 20
Appl. Sci. 2020, 10, x FOR PEER REVIEW 6 of 20
Figure 2. Experimental setup for the measurement of the elastic properties of the tyres: (1) Tested tyre
Figure 2. Experimental
Figure 2. 460/85
Experimental
setup
setup
for the measurementofofthe
for the measurement
the elastic
elastic (4)
properties
properties
of tyres:
of the(5)
the tyres: (1) Tested
(1) Tested
(in this case: R34); (2) transducer; (3) weighing platform; crane rope; hydraulic cylinder;
tyretyre
(in (in
thisthis
case: 460/85
case: 460/85R34);
R34);(2)
(2) transducer; (3)weighing
transducer; (3) weighing platform;
platform; (4) crane
(4) crane rope;rope; (5) hydraulic
(5) hydraulic
(6) acquisition system (connected to the laptop on the right side of the photograph, used to store the
cylinder; (6) (6)
cylinder; acquisition
acquisitionsystem
system(connected
(connected totothe
thelaptop
laptoponon
thethe right
right sideside of photograph,
of the the photograph, used to
used to
data collected).
storestore
the the
data collected).
data collected).
2.2. Simulation Phase
2.2. Simulation
2.2. Simulation Phase
Phase
The two tyres were modelled using finite elements after having obtained their geometries
TheThe twotwo
experimentally
tyres
tyres weremodelled
thewere
in in
modelled using
laboratory.
using finite
finite elements
elements after
afterhaving
ofhaving
obtained
obtained their their
geometries
geometries
experimentally the laboratory.AllAll cross-section dimensions
cross-section dimensions of the the
twotwotyrestyres
werewere measured
measured and and
experimentally
drawn in AutoCAD in the(bylaboratory.
Autodesk, All cross-section dimensions of the two tyres were measured and
drawn in AutoCAD (by Autodesk,San San Rafael, CA,USA).
Rafael, CA, USA). InIn particular,
particular, the the cross-section
cross-section of eachof tyre
each tyre
drawn
was was in AutoCAD
measured (by
at regular Autodesk,
intervals San Rafael, CA, USA). In particular, the cross-section of each tyre
measured at regular intervalsofofthe
the tyre profile,thus
tyre profile, thusallowing
allowing a careful
a careful 2D reconstruction
2D reconstruction of the of the
wasshapes
shapesmeasured
and and at
of the regular intervals of the tyre profile, thus allowing a careful 2D
of the thicknesses (Figure 3a). In addition, the lug sections of the tyres were measured
thicknesses (Figure 3a). In addition, the lug sections of the tyres reconstruction
were also also of the
shapes and
withmeasured
respect to of
withthe
both thicknesses
respect to both
the front (Figure
the and
view frontthe3a).
viewtopIn
andaddition,
the top
view. the lug sections
view. Subsequently,
Subsequently, the section of the
the section tyres
drawndrawn were
in also
in AutoCAD
measured
was AutoCAD with
imported was respect
into imported to
SpaceClaim both the
into2019 front
SpaceClaim view and the top
2019 R3Canonsburg,
R3 (by Ansys, view. Subsequently,
(by Ansys, Canonsburg,
Pennsylvania, the
Pennsylvania, section
USA). AllUSA). drawn
All
tyre segments in
AutoCAD
were tyre was imported
segments
chamfered with into SpaceClaim
wereinterpolation
chamfered with
splines. 2019
interpolation
The 3DR3splines.
(by Ansys,
models The 3D
of theCanonsburg,
models
tyres were of thePennsylvania,
tyres were
created USA). All
fromcreated
a revolution
tyre from a revolution
segments were of each cross-section
chamfered with around the
interpolation related
splines. The tyre
3D axis
models of rotation
of the and were
tyres the lug created
of each cross-section around the related tyre axis of rotation and the lug geometries were 3D-modelled
geometries were 3D-modelled separately and added as a matrix of objects (Figure 3b). As shown, the
separately and added as a matrix of objects (Figure 3b). As shown, the graphical comparison of lug
from a revolution of each cross-section around the related tyre axis of rotation and the the
graphicalwere
geometries comparison
3D-modelledof the two images isand
separately veryadded
preciseasanda the geometric
matrix of model
objects is very3b).
(Figure detailed
As and the
shown,
two close
images is very precise and the geometric model is very detailed and close to reality.
to reality.
graphical comparison of the two images is very precise and the geometric model is very detailed and
close to reality.
(a) (b)
Figure
Figure 3. Example
3. Example ofof a crosssection
a cross section of
of a tyre
tyre(here:
(here:a a420/85
420/85R24 tyre);
R24 (a) exported
tyre); by AutoCAD
(a) exported and and
by AutoCAD
(b) modelled in Ansys SpaceClaim
(b) modelled in Ansys SpaceClaim 2019 R3.2019 R3.
(a) (b)
Figure 3. Example of a cross section of a tyre (here: a 420/85 R24 tyre); (a) exported by AutoCAD and
(b) modelled in Ansys SpaceClaim 2019 R3.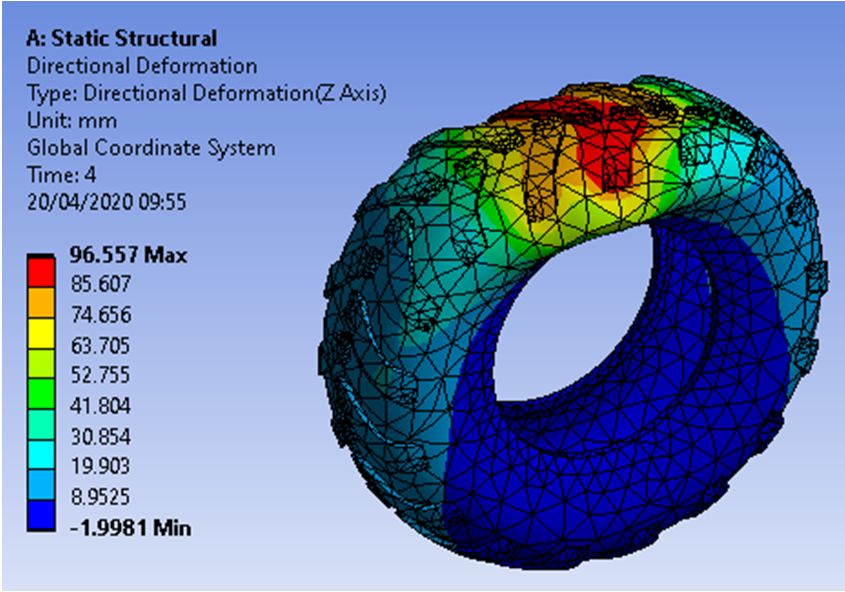
Appl. Sci. 2020, 10, 3481 7 of 20
Appl. Sci. 2020, 10, x FOR PEER REVIEW 7 of 20
Figure 44 shows
Figure shows anan example
example ofof one
one of of the
the two
two tyres
tyres in
in section
section (Figure
(Figure 4a),
4a), and
and the
the whole
whole tyre
tyre
(Figure 4b) as well. The model that is proposed is all-inclusive of all the components
(Figure 4b) as well. The model that is proposed is all-inclusive of all the components that make up a tyre, that make up
a tyre,the
from from
solidthe solid
part part
of the of thetorubber
rubber to thewithout
the carcass, carcass,modelling
without modelling them separately.
them separately. In the
In the performed
performed geometrical modelling, the smallest parts have not been considered and
geometrical modelling, the smallest parts have not been considered and the level of detail, although the level of detail,
although quite high, has not dropped beneath geometries smaller than one centimetre,
quite high, has not dropped beneath geometries smaller than one centimetre, all this in order all this in order
to
to simplify
simplify thethe subsequent
subsequent calculation
calculation of of deformationsand
deformations andstresses.
stresses.However,
However,the thechosen
chosen geometric
geometric
approximation does
approximation does not
not generate
generate any
any significant
significant change
change in in the
the tyre
tyre deformation
deformation characteristics
characteristics
compared to
compared to the
the actual
actual geometry.
geometry.
(a) (b)
Figure 4.
Figure 3Dtyre
4. 3D tyre section
section(in
(in this
this case:
case: 420/85
420/85R24)
R24)modelled
modelledin
inAnsys
AnsysSpaceClaim
SpaceClaim2019
2019R3
R3(a)
(a)and
andin
in
Ansys SpaceClaim
Ansys SpaceClaim 2019
2019 R3
R3 (b).
(b).
The tyre
The tyre deformation
deformation configurations
configurationswere were simulated
simulatedwith with Ansys
Ansys Mechanical
Mechanical2019 2019R3 R3 software
software
(Ansys, Inc., Canonsburg, PA, USA) using two models composed
(Ansys, Inc., Canonsburg, PA, USA) using two models composed respectively of 21,130 nodes respectively of 21,130 nodes and and
9381
tetrahedral
9,381 elements
tetrahedral for the
elements for420/85 R24 tyre
the 420/85 R24and tyre28,617 nodesnodes
and 28,617 and 8921andtetrahedral elements
8,921 tetrahedral for the
elements
for the 460/85 R34 tyre. The strength of this work is the definition of a simplified model thatsame
460/85 R34 tyre. The strength of this work is the definition of a simplified model that can show the can
deformations
show the sameofdeformations
the real physical system
of the under thesystem
real physical same loading
under the conditions.
same loading To this end, the model
conditions. To this of
the tyre
end, the has
modelbeenofmodelled
the tyre as hasa been
homogeneous
modelledspatial continuum. Since
as a homogeneous spatialthe continuum.
tyre internal Since
belts andthe plies
tyre
have not been modelled, a new material was defined in the FE software.
internal belts and plies have not been modelled, a new material was defined in the FE software. The The stress–strain curve was
approximated with a linear trend similar to the low-strain Neo-Hookean
stress–strain curve was approximated with a linear trend similar to the low-strain Neo-Hookean model [43], and so it represents
the simplest
model [43], and model
so itthat can be the
represents implemented.
simplest model A quasi-static
that can betest was conducted
implemented. [44]. Subsequently,
A quasi-static test was
the characteristics of the rubber were iteratively changed by trying
conducted [44]. Subsequently, the characteristics of the rubber were iteratively changed by trying to to mediate the real conditions;
thus, thethe
mediate texture and the metallic
real conditions; thus, filaments,
the texturewhich and the aremetallic
generally present which
filaments, in the tyre carcass, were
are generally also
present
included in the elasticity parameters of the selected material. In particular,
in the tyre carcass, were also included in the elasticity parameters of the selected material. In an average Poisson’s ratio
of 0.48 wasan
particular, selected
average forPoisson’s
all the tests [43]ofwith
ratio 0.48different pressures
was selected for and
all thefor both
tests the
[43]tyres,
withindifferent
order to
compensate
pressures andforforthe presence
both the tyres,of some
in ordermetallic elements within
to compensate for thethe tyre mesh.
presence of someInstead, the elements
metallic values of
Young’s modulus were calculated for all the tests through a
within the tyre mesh. Instead, the values of Young’s modulus were calculated for all the convergent iteration process so that the
tests
strain curve calculated with the FEM method coincided with the
through a convergent iteration process so that the strain curve calculated with the FEM method experimental one. For these reasons,
the Poisson’s
coincided withratio and Young’s modulus
the experimental one. For these set inreasons,
the simulations
the Poisson’scan beratioproperly as equivalent
namedmodulus
and Young’s set
Poisson’s ratio and equivalent Young’s modulus. Therefore, the proposed models
in the simulations can be properly named as equivalent Poisson’s ratio and equivalent Young’s modulus. are inclusive of all the materials
that form a tyre,
Therefore, i.e., referring
the proposed modelsnot areonly to theofdifferent
inclusive solid parts
all the materials thatthat
formcompose
a tyre, i.e.,the referring
tyre (e.g.,notthe only
carcass)
to
but also to the air that is contained within the tyre at different pressures
the different solid parts that compose the tyre (e.g., the carcass) but also to the air that is contained for the different tests. Indeed,
it was considered
within as a variation
the tyre at different of Young’s
pressures for themodulus
differentof elasticity.
tests. Indeed, Initother
was words,
considered an increase in tyre
as a variation
inflation
of Young’s pressure
modulus wasofmatched
elasticity.byInan increase
other words, in Young’s
an increasemodulus
in tyreofinflation
the tyres. pressure was matched
by an increase in Young’s modulus of the tyres.
Thanks to these FE models, it was possible to estimate the main dimensions of the tyre
footprints (a major longitudinal axis, along the median plane of the tyre, and a minor transversal axis,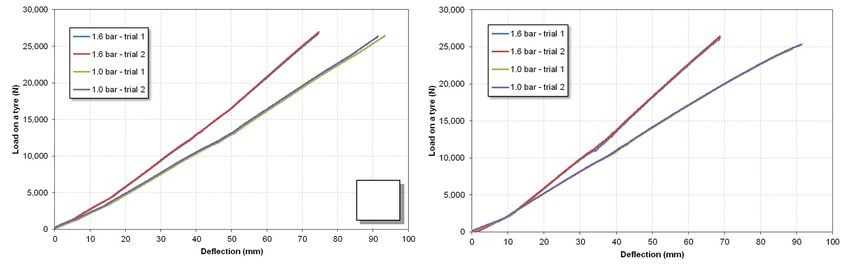
Appl. Sci. 2020, 10, 3481                                                                                            8 of 20

Appl. Sci. 2020, 10, x FOR PEER REVIEW                                                                              8 of 20
       Thanks to these FE models, it was possible to estimate the main dimensions of the tyre footprints
along  a plane
 (a major          containing
            longitudinal    axis,the   rotation
                                    along         axis of plane
                                            the median     the tyre).  Then,
                                                                  of the  tyre,these
                                                                                 and values
                                                                                      a minorobtained      from
                                                                                                  transversal     thealong
                                                                                                               axis,   FEMa
simulations    were    processed     by  using   specific  statistical software   (Design-Expert
 plane containing the rotation axis of the tyre). Then, these values obtained from the FEM simulations 7.0.0  by Stat-Ease,
Minneapolis,
 were processed  MN, byUSA).
                          usingAfter     a preliminary
                                  specific                 analysis(Design-Expert
                                             statistical software    of variance (ANOVA)           aimed at highlighting
                                                                                       7.0.0 by Stat-Ease,     Minneapolis,
the
 MN,parameters
       USA). After  of ainfluence
                          preliminary(factors)  on the
                                         analysis       two tyre(ANOVA)
                                                    of variance    footprintaimed
                                                                               dimensions      (responses),
                                                                                      at highlighting    theaparameters
                                                                                                               subsequentof
application    of  the  response     surface   methodology      (RSM)    allowed    the formulation
 influence (factors) on the two tyre footprint dimensions (responses), a subsequent application of the   of  a polynomial
interpolation
 response surface model     (with selected
                       methodology        (RSM)coefficients)
                                                   allowed thefitting     the FEM
                                                                 formulation          data [45]. This
                                                                                 of a polynomial             model has
                                                                                                      interpolation   modela
mathematical      form    that is  completely     independent     of the  physics  of  the  represented
 (with selected coefficients) fitting the FEM data [45]. This model has a mathematical form that is         process,  being
mainly   oriented
 completely         to obtain aof
                independent        reliable  prediction-capability
                                     the physics    of the representedfor the models
                                                                          process,      within
                                                                                     being       the validity
                                                                                             mainly    orienteddomains
                                                                                                                 to obtainofa
the factors.
 reliable     For this reason, thefor
          prediction-capability         explicit   polynomial
                                           the models    within regression-functions
                                                                 the validity domains of  obtained     in this
                                                                                              the factors.  Forway
                                                                                                                 thiscan be
                                                                                                                      reason,
used  to study    the trend   of  the  real  unknown     function   varying  the  factors  [46–51].
 the explicit polynomial regression-functions obtained in this way can be used to study the trend of the
 real unknown function varying the factors [46–51].
3. Results and Discussion
 3. Results and Discussion
3.1. Influence of the Physical Parameters on the Tyre Global Coefficient of Elasticity
 3.1. Influence of the Physical Parameters on the Tyre Global Coefficient of Elasticity
3.1.1. Experimental Data Processing
 3.1.1. Experimental Data Processing
      Experimentally, the flattening (or, more precisely, the deflection) of a tyre is a quantity derived
       Experimentally,
from the     application ofthe    flattening
                               a load,         (or, morestrictly
                                        and therefore,    precisely,  the deflection)
                                                                  speaking,    a possibleofrepresentation
                                                                                            a tyre is a quantity
                                                                                                           shouldderived
                                                                                                                   have
 from
the      the application
     applied                 of a load,
                load in abscissa         anddeflection
                                    and the   therefore,instrictly speaking,
                                                             ordinate.  However,a possible  representation
                                                                                    a representation        shouldwith
                                                                                                       was chosen    have
 the  applied     load   in abscissa   and  the  deflection   in ordinate.   However,     a representation
the axes exchanged with respect to the above statement (deflection in abscissa, load in ordinate; Figure     was  chosen
 with
5), as itthe  axes exchanged
           is more                with
                     similar to the   onerespect to given
                                           usually   the above   statement
                                                            for elastic       (deflection
                                                                        systems   (springs,indeformed
                                                                                              abscissa, load in ordinate;
                                                                                                         materials). The
 Figure    5), as it is more  similar  to the one   usually  given for  elastic systems
elastic coefficients calculated from these data, therefore, have the usual graphic meaning(springs, deformed   materials).
                                                                                                                 of the
 The elastic
(average         coefficients calculated
             or instantaneous)     values offrom    theseofdata,
                                              the slope          therefore, have
                                                            the deformation         the usual graphic meaning of the
                                                                                curves.
 (average or instantaneous) values of the slope of the deformation curves.

                                                       a                                                              b

       Figure 5. Experimental load–deflection curves at two different inflating pressures: (a) 420/85 R24 tyre;
       (b) 460/85
      Figure       R34 tyre. Twoload–deflection
              5. Experimental     trials were performed
                                                  curves for eachdifferent
                                                         at two   case.    inflating pressures: (a) 420/85 R24
      tyre; (b) 460/85 R34 tyre. Two trials were performed for each case.
      Observing the trend and the value of the first derivative, each load–deflection curve was divided
 into three stretches, each characterised by a substantially-constant slope of the curve related to the
     Observing the trend and the value of the first derivative, each load–deflection curve was divided
 loading process. For each stretch, identified by a couple of points in the Cartesian load–deflection
into three stretches, each characterised by a substantially-constant slope of the curve related to the
 plane, the interpolation line at the least squares was calculated, and its linear coefficient (in N·mm−1 )
loading process. For each stretch, identified by a couple of points in the Cartesian load–deflection
 was then indicated as the elastic coefficient k related to that stretch of the experimental curve (Table 2).
plane, the interpolation line at the least squares was calculated, and its linear coefficient (in N·mm−1)
was then indicated as the elastic coefficient k related to that stretch of the experimental curve (Table 2).

      Table 2. Values of the elastic coefficients in the three stretches of a loading curve in the two
      experimental trials for a 420/85 R24 tyre inflated with an initial pressure of 1.0 bar.

                 Tyre, Inflation Pressure       Quantity Stretch 1 Stretch 2          Stretch 3
                                               k (N·mm−1)        212        275          312
                 420/85 R24 1.0 bar           load int. (kgf) 19.4/386.4386.4/1381.21381.2/2694.4
                                              defl. int. (mm)−0.1/−16.8 −16.8/−52.1 −52.1/−92.4
                 420/85 R24 1.6 bar            k (N·mm−1)        268        356          419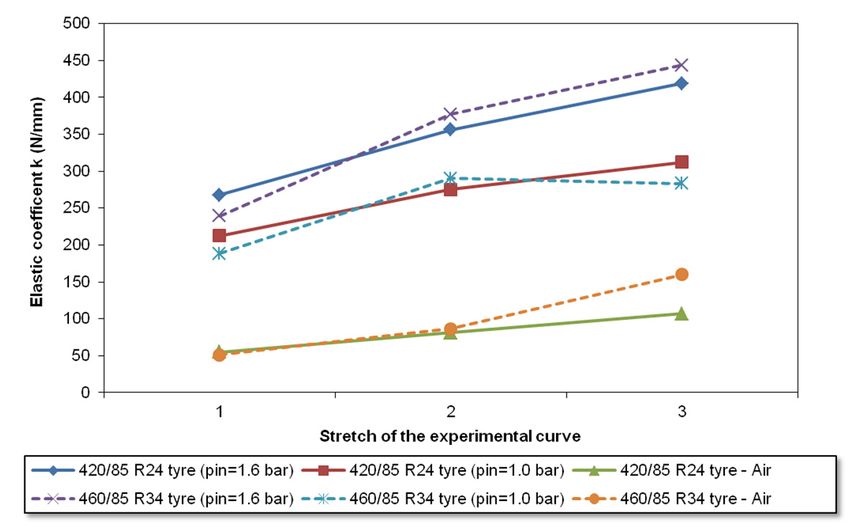
Appl. Sci. 2020, 10, 3481 9 of 20
Table 2. Values of the elastic coefficients in the three stretches of a loading curve in the two experimental
trials for a 420/85 R24 tyre inflated with an initial pressure of 1.0 bar.
Tyre, Inflation Pressure Quantity Stretch 1 Stretch 2 Stretch 3
k (N·mm−1 ) 212 275 312
420/85 R24 1.0 bar load int. (kgf ) 19.4/386.4 386.4/1381.2 1381.2/2694.4
Appl. Sci. 2020, 10, x FOR PEER REVIEW 9 of 20
defl. int. (mm) −0.1/−16.8 −16.8/−52.1 −52.1/−92.4
k (N·mmload−1 ) 268 356 419
int. (kgf) 16.0/430.6 430.6/1645.51645.5/2735.2
420/85 R24 1.6 bar load int. (kgf ) 16.0/430.6 430.6/1645.5 1645.5/2735.2
defl. int. (mm)−3.1/−18.7 −18.7/−52.1 −52.1/−77.7
defl. int. (mm) −3.1/−18.7 −18.7/−52.1 −52.1/−77.7
k (N mm−1) 188 290 284
k (N mm−1 ) 188 290 284
460/85 R34 1.0 bar
460/85 R34 1.0 bar
load int. (kgf) 14.1/180.0 180.0/1133 1133.0/2404.4
load int. (kgf ) 14.1/180.0 180.0/1133 1133.0/2404.4
defl. int. (mm)
defl. int. (mm) −0.1/−8.4 −8.4/−40.4
−0.1/−8.4 −40.4/−86.5−40.4/−86.5
−8.4/−40.4
k (N mm−1) 240 377 444
k (N mm−1 ) 240 377 444
460/85
460/85 R34 1.6 bar R34 1.6 bar load
load int. (kg f ) int. (kg ) 8.5/239.6
f8.5/239.6 239.6/1219.11219.1/2653.0
239.6/1219.1 1219.1/2653.0
defl. int. (mm)−1.1/−10.4
defl. int. (mm) −1.1/−10.4 −10.4/−35.7 −35.7/−67.9−35.7/−67.9
−10.4/−35.7
The
The linear
linear interpolation
interpolationperfectly
perfectlyfits
fitsthe
thethree
threestretches
stretchesofofthe theload–deflection
load–deflectioncurves,
curves, as as the
the
minimum values of the R 2 coefficient are all very high: 0.997 (420/85 R24, 1.0 bar), 0.998 (420/85 R24,
2
minimum values of the R coefficient are all very high: 0.997 (420/85 R24, 1.0 bar), 0.998 (420/85 R24,
1.6
1.6bar),
bar),0.997
0.997(460/85
(460/85R34,
R34,1.01.0bar),
bar),0.997
0.997(460/85
(460/85R34,R34,1.6
1.6bar).
bar).
All
Allthe
the curves
curves ofof Figure
Figure 55 show
show aa hardening
hardening behaviour,
behaviour, i.e.,
i.e., the
the angular
angular coefficient
coefficient (i.e.,
(i.e., the
the elastic
elastic
coefficient
coefficient k) of their three stretches increases as the deformation progresses. This is probablydue
k) of their three stretches increases as the deformation progresses. This is probably dueto to
the progressive involvement of different parts of the tyre as the tyre flattens, e.g., the
the progressive involvement of different parts of the tyre as the tyre flattens, e.g., the side walls andside walls and the
belts. ThisThis
the belts. evidence can can
evidence alsoalso
be seen from
be seen fromthethe
graph plotted
graph plotted in in
Figure
Figure6,6,plotting
plottingthe
thevalues
valuesof ofthe
the
average elastic coefficients in correspondence with the three stretches of the load–deflection
average elastic coefficients in correspondence with the three stretches of the load–deflection curves. curves.
Figure 6. Values of the average elastic coefficients in correspondence with the different stretches of the
Figure 6. Values of the average elastic coefficients in correspondence with the different stretches of
loading curves of the 420/85 R24 and 460/85 R34 tyres.
the loading curves of the 420/85 R24 and 460/85 R34 tyres.
By comparing the deflections at two different air pressures, it is also possible to evidence the
By comparing the deflections at two different air pressures, it is also possible to evidence the
contribution of the air in sustaining part of the vehicle load. In particular, the air acts like a pneumatic
contribution of the air in sustaining part of the vehicle load. In particular, the air acts like a pneumatic
spring that is in parallel with the rubber and the carcass (belt and body plies, i.e., radial cords) forming
spring that is in parallel with the rubber and the carcass (belt and body plies, i.e., radial cords) forming
the inner structure of the tyre. With a simple subtraction, it is, therefore, possible to evidence an elastic
the inner structure of the tyre. With a simple subtraction, it is, therefore, possible to evidence an elastic
constant due to increment of the air pressure at the different values of displacement (i = 1 to 3; see also
constant due to increment of the air pressure at the different values of displacement (i = 1 to 3; see also
Table 3):
Table 3):
(
,i = struct,i
k 1.6bar= struct ,i + k
k1.6bar,i kk + kair,1.6bar,i
air ,1.6bar,i ⇒ k1.6bar,i − k1.0bar,i = kair,1.6bar,i − kair,1.0bar,i (1)
k1.0bar,i = kstruct,i + kair,1.0bar,i k 1.6ba r ,i − k 1.0bar,i = k air ,1.6bar,i − k air ,1.0bar,i (1)
k
1.0bar,i = k struct ,i + k air ,1.0bar,i
Table 3. Differences between the elastic coefficients at 1.0 bar and 1.6 bar in the three stretches of a
loading curve in the two experimental trials for the two tyres (in N·mm−1), according to Equation (1).
Stretch 1 Stretch 2 Stretch 3
Tyre Unit
Ave. Values Ave. Values Ave. Values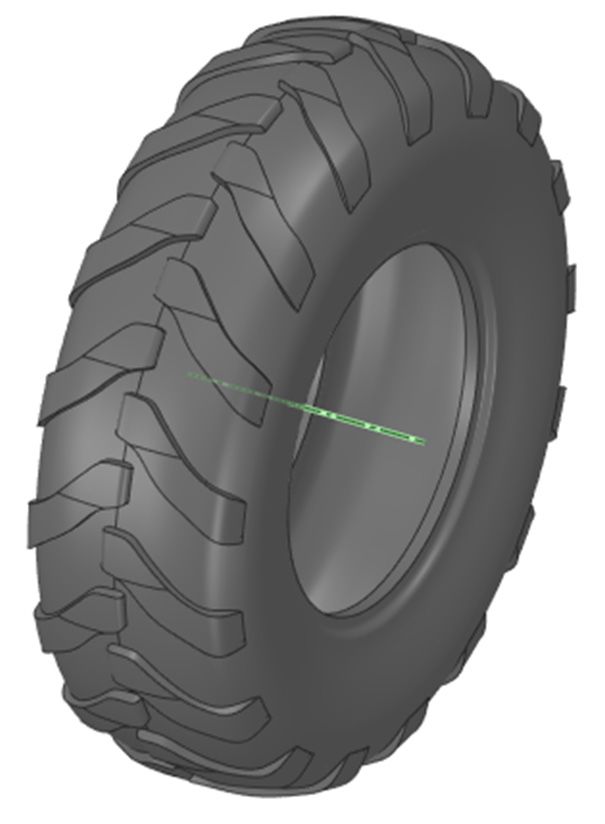
Appl. Sci. 2020, 10, 3481                                                                                       10 of 20

      Table 3. Differences between the elastic coefficients at 1.0 bar and 1.6 bar in the three stretches of a
      loading curve in the two experimental trials for the two tyres (in N·mm−1 ), according to Equation (1).

                                                       Stretch 1              Stretch 2               Stretch 3
          Tyre                        Unit
                                                     Ave. Values          Ave. Values               Ave. Values
       420/85 R24                 N·mm−1                  55                     81                     107
       460/85 R34                 N·mm−1                  51                     86                     160

     The results related to the air have also been plotted in Figure 6. The air contribution also shows
the same hardening trend of the carcass: even if a constant air pressure is assumed, as the deflection
continues, the footprint on the ground increases and an increasing force is needed to further press
the tyre.
     Finally, another observation can be formulated: both the tyres have similar elastic coefficients,
witnessed by the points of Figure 6, that are very close to one another in correspondence to each stretch.

3.1.2. FE Simulation
     From the analysis of the experimental data of the tests on both tyres at the two pressures of
1.0 bar and 1.6 bar, three linear stretches with different slope of the load–deflection curves were
identified; for this reason, three stretch phases were implemented in the FE model in terms of extremal
points. Under the hypothesis of linearity of the tyre deflections with the inflating pressure values,
the load–deflection curve was calculated and plotted at the intermediate pressure of 1.3 bar between
the two values used in the experiments.
     The experimental deflections at each phase and at the pressures of 1.0 bar, 1.3 bar, and 1.6 bar were
then applied to the FE models and the resulting forces on the anchorages of the internal circular crown
of the tyres were calculated. The contact that occurs during the flattening of the tyres on a plane was
simulated by taking into consideration four lugs for the 420/85 R24 tyre and six lugs for the 460/85 R34 tyre.
For both the tyres, differential displacements were given to the lugs in order to simulate the contact that
gradually affects different areas of the tyres. The final coefficients (Young’s modulus, Poisson’s ratio)
resulting from the iterative tuning process of the FE models at 1.0 bar and 1.6 bar are shown in Table 4.
Instead, Young’s modulus and Poisson’s ratio corresponding to the pressure of 1.3 bar were calculated
by averaging the value of those coefficients at 1.0 bar and 1.6 bar, thus hypothesizing that a linear
variation of elastic coefficients produces a linear variations of deflections.

      Table 4. Values of Young’s moduli and Poisson’s ratios for the finite elements method (FEM) simulations.
      The coefficients related to 1.0 bar and 1.6 bar were obtained by converging experimental and FEM
      results; the coefficients at 1.3 bar are the average between the coefficients at the other pressures.

                            p = 1.0 bar (ref.)           p = 1.3 bar (+30%)                p = 1.6 bar (+60%)
       Tyre
                        E (MPa)              ν (-)     E (MPa)          ν (-)             E (MPa)          ν (-)
    420/85 R24           7.6 (ref.)          0.48     8.3 (+9.2%)       0.48          9.0 (+18.4%)         0.48
    460/85 R34          14.0 (ref.)          0.48    16.5 (+17.9%)      0.48          19.0 (+35.7%)        0.48

      The load–deflection curves with different Young’s moduli, Poisson’s ratios and inflation pressures
(1.0 bar, 1.3 bar, 1.6 bar) resulting from the FEM simulations are represented in Figure 7. In the same
figure, the experimental curves for both the tyres at 1.0 bar and 1.6 bar and the calculated curve at
1.3 bar are also reported for proper comparison with the FEM outputs.
Figure 7 based on the best fitting condition of the curves represented in red. As can be seen for both
the tyres, a variation of −5% of these coefficients (Young’s, Poisson’s) does not generally lead to an
excessive deviation of the curves with respect to the experimental curve. On the contrary, a variation
of +5% of the two coefficients leads to a significant variation of the elastic response of the tyre, in
some cases almost equal to 5000 N. This effect is visible above all for the Poisson’s ratio because,
Appl. Sci. 2020, 10, 3481 11 of 20
when it is incremented by +5%, its value is close to 0.50, i.e., the typical value for rubber.
(a) (d)
(b) (e)
(c) (f)
Figure
Figure7.7.FEM
FEMload–deflection
load–deflectioncurves
curveswith
withdifferent
differentequivalent
equivalentYoung’s
Young’s moduli
moduli and
and Poisson’s
Poisson’s ratios of
of the
the rubber
rubber in in comparison
comparison with
with thethe experimental
experimental tyre
tyre curves
curves forfor 420/85
420/85 R24R24 (a–c)
(a–c) andand 460/85
460/85 R34R34(d–f):
(a,d) tyre inflation pressure of 1.0 bar; (b,e) tyre inflation pressure of 1.3 bar; (c,f) tyre inflation pressure
of 1.6 bar.
The curve in blue is the experimental curve, whilst the curve in red is the curve calculated through
the FE model. As can be seen, except for the initial section, the two curves are superimposed.
From the analysis carried out through the FE modelling, it can be seen that an increase of 0.3 bar
(i.e., 0.03 MPa) in the tyre inflation pressure corresponds to an increase in Young’s modulus of 0.7 MPa
and 2.5 MPa for the 420/85 R24 and 460/85 R34 tyres, respectively. This means that Young’s modulusAppl. Sci. 2020, 10, 3481 12 of 20
of elasticity of the tyres is about 10 times more sensitive in the case of the 420/85 R24 tyre and about
100 times more sensitive in the case of the 460/85 R34 tyre to variations of the initial inflation pressure
(1.0 bar, 1.3 bar, 1.6 bar) than Poisson’s ratio. It can, therefore, be concluded that a change in the
inflation pressure of the tyre greatly influences the elastic response of the tyre.
In order to study the effect of the variation of Young’s modulus and Poisson’s ratio on tyre
deformation and contact pattern, the stress–strain curves corresponding to a variation of ±5% of
Young’s modulus and ±5% of Poisson’s ratio were also calculated and plotted in blue shading in
Figure 7 based on the best fitting condition of the curves represented in red. As can be seen for both
the tyres,
Appl. a variation
Sci. 2020, 10, x FOR PEER of −5% of these coefficients (Young’s, Poisson’s) does not generally lead12to
REVIEW of an
20
excessive deviation of the curves with respect to the experimental curve. On the contrary, a variation
of +5% of (a,d)
(d–f): the twotyrecoefficients leads of
inflation pressure to 1.0
a significant variation
bar; (b,e) tyre of pressure
inflation the elastic response
of 1.3 oftyre
bar; (c,f) the inflation
tyre, in some
casespressure
almost of 1.6 bar.
equal to 5000 N. This effect is visible above all for the Poisson’s ratio because, when it is
incremented by +5%, its value is close to 0.50, i.e., the typical value for rubber.
3.2. Predictions of the Tyre Footprint Dimensions
3.2. Predictions of the Tyre Footprint Dimensions
3.2.1. FE-Simulation
3.2.1. FE-Simulation
Once the coincidence of the FE model tyre flattening under load has been verified for all the
Once the
considered coincidence
pressure values,ofthethefocus
FE model
moved tyreonflattening under load of
to other parameters hasinterest
been verified
provided for by
all the
the
considered pressure values, the focus moved on to other parameters of interest
model. Figure 8 shows an example of the deformation of the FE model of the tyre in the direction of provided by the model.
Figure
the 8 shows
vertical an for
axis (z) example of the deformation
the inflation pressure of 1.0 of the
bar FE
andmodel
for bothof the
the tyre
tyres.inThe
the z-axis
direction of the
coincides
vertical axis (z) for the inflation pressure of 1.0 bar and for both the tyres. The
with the application direction of the force vector, i.e., the z-axis is perpendicular to the support z-axis coincides with the
application direction of the force vector, i.e., the z-axis is perpendicular to the support
plane. As shown in the figure, the tyre deflection involves a large part of the tyre itself and its effects plane. As shown
in the figure,
interest almost the tyre
the deflection
entire carcass.involves
The tyresa large part during
selected of the tyre
the itself and its effects
experimentation areinterest almostwell
worn tyres, the
entire carcass. The tyres selected during the experimentation are worn
representing real operating conditions, and the geometries shown in the FE model are close to tyres, well representing real
operating
reality. Theconditions,
420/85 R24and tyrethe geometries
has less wear shown in the FEhigher
and, therefore, model lugs;
are close
this to reality.
gives The 420/85 R24
a reinforcement of
tyre has less wear and, therefore, higher lugs; this gives a reinforcement of the
the contact area and, hence, a lower concavity in the central area of the tyre contact footprint. On the contact area and, hence,
a lower concavity
contrary, since thein lugstheof central area of
the 460/85 thetyre
R34 tyrearecontact
morefootprint.
worn, theOn the contrary,
central area of thesince the lugs
contact of the
footprint
460/85
is moreR34 tyre are more worn, the central area of the contact footprint is more concave.
concave.
(a) (b)
Figure
Figure 8.
8. 3D
3D FEM
FEM vertical
vertical deformations
deformationsin in direction
directionof
of compression
compressionload
loadi.e.,
i.e.,for
for 420/85
420/85 R24
R24 (a)
(a) and
and
460/85 R34
460/85 R34 (b)
(b) at
at the
the inflation
inflation pressure of 1.0 bar.
Figure 99 shows
Figure shows thethe 3D
3D FE
FE model
model ofof the
the contact
contact pattern
pattern when
when the the inflation
inflation pressure
pressure isis 1.0
1.0 bar
bar for
for
both the tyres. The figures also show a graduated scale for measuring the contact
both the tyres. The figures also show a graduated scale for measuring the contact area; in particular, area; in particular,
the geometry
the geometry of of the
the contact
contact mark
mark can
can be
be approximated
approximated to to an
an ellipse
ellipse with
with the
the edges
edges coinciding
coinciding with
with
the boundaries of the green zone (coinciding with the flat zone of the tyre deformed
the boundaries of the green zone (coinciding with the flat zone of the tyre deformed by the static by the static
loads). For
loads). Foreach
eachcase,
case,aa major longitudinalaxis
major longitudinal axis(i.e.,
(i.e.,along
alongthethemedian
medianplaneplaneof of the
the tyre)
tyre) and
and aa minor
minor
transversal axis of the contact area (i.e., along a plane containing the rotation axis
transversal axis of the contact area (i.e., along a plane containing the rotation axis of the tyre) were of the tyre) were
identified. In general, the dimensions of the contact marks of the 420/85 R24 tyre
identified. In general, the dimensions of the contact marks of the 420/85 R24 tyre reach about 675 mmreach about 675 mm
for the longitudinal axis and 575 mm for the transversal axis, whilst for the 460/85 R34 tyre they are
about 935 mm for the longitudinal axis and 558 mm for the transversal axis. The dimensions comply
with the measurements made on the actual tyre during the compression test and are in accordance
with the dimensions obtained from simulations and literature formulas [52]. Indeed, the size of the
longitudinal axis of the contact pattern coincides with the size of the tyre semi-diameter in theAppl. Sci. 2020, 10, 3481 13 of 20
for the longitudinal axis and 575 mm for the transversal axis, whilst for the 460/85 R34 tyre they are
about 935 mm for the longitudinal axis and 558 mm for the transversal axis. The dimensions comply
with the measurements made on the actual tyre during the compression test and are in accordance
with the dimensions obtained from simulations and literature formulas [52]. Indeed, the size of the
longitudinal axis of the contact pattern coincides with the size of the tyre semi-diameter in the absence
of deformation. In addition, the contact pattern for both the tyres does not vary much when the
inflation pressure
Appl. Sci. 2020, varies.
10, x FOR PEER REVIEW 13 of 20
(a) (b)
Figure9.9.Examples
Figure Examples ofof simulation
simulation of the 3D FEM
FEM tyre
tyre footprint
footprint for
for420/85
420/85R24
R24(a)
(a)and
and460/85
460/85R34
R34tyres
tyres
(b)atatthe
(b) theinflation
inflationpressure
pressureof
of1.0
1.0bar.
bar.
The
Thedimensions
dimensionsofof thethe
contact marks
contact in correspondence
marks in correspondencewith different values for
with different Young’s
values modulus
for Young’s
and Poisson’s
modulus andratio were then
Poisson’s ratioanalysed,
were then andanalysed,
the resultsand
of these
the comparisons on the
results of these different lengths
comparisons on theof
the contactlengths
different marks are reported
of the contactasmarks
a function of the twoascited
are reported coefficients
a function of thein two
Figure 10 (for
cited readability
coefficients in
Figure
only the10 (for readability
results only of
at the pressure the1.0
results at reported;
bar are the pressuretheof 1.0 bar
trend andare
thereported;
conclusionsthe trend
relevantandtothe
the
conclusions
other pressurerelevant
setting toarethe other pressure
similar). setting are
In those figures, thesimilar). In those
longitudinal and figures, the longitudinal
transversal dimensions of and
the
transversal
FEM footprintdimensions
axis of theof the FEM
420/85 footprint
R24 tyre axis of the
with different 420/85 R24
equivalent tyre with
Young’s different
moduli (E) andequivalent
Poisson’s
Young’s
ratios moduli
(ν) are (E) and Poisson’s
represented. ratios (ν)
In each graph, the are
tworepresented. In each graph,
percentage variations of thethe two percentage
dimensions on the
variations ofand
longitudinal the dimensions
transversal on theoflongitudinal
axes and transversal
the tyre contact pattern areaxes
shownof the
as tyre
±5%contact
of the pattern
modulus areof
shown as ±5% of the modulus of elasticity given by the best approximation
elasticity given by the best approximation condition, represented by the red curves in Figure 7.condition, represented
by the red curves
In general, as in Figure
shown by7.the graphs, a variation of ±5% in Young’s modulus of elasticity does not
correspond to a significant variation in both the longitudinal and the transversal dimension of the
contact area, although there is a considerable variation in the deflection force, as shown in Figure 7.
On the contrary, the dimensions of the contact area are much more significant in the case of the
variation of the equivalent Poisson’s ratio. An increase in Poisson’s ratio corresponds to an increase in
the longitudinal dimension of the contact pattern and a decrease in the transversal dimension of the
contact pattern. Therefore, it can be concluded that an increase in the amount of metal fibres inside the
tyre causes a decrease in the longitudinal dimension of the contact area, leading to a change of the
footprint shape from a flattened rectangular to a square shape. The effect is more pronounced for the
420/85 R24 tyre than for the 460/85 R34.
(a) (b)
(c) (d)You can also read