Injection into the shallow aquifer-aquitard system beneath Mexico City for counteracting pore pressure declines due to deeper groundwater ...
←
→
Page content transcription
If your browser does not render page correctly, please read the page content below
Geofísica Internacional (2019) 58-1: 81-99
                                                                                          Original   paper

Injection into the shallow aquifer-aquitard system beneath Mexico
City for counteracting pore pressure declines due to deeper
groundwater withdrawals: Analysis of one injection well
Felipe Vázquez-Guillén* and Gabriel Auvinet-Guichard
Received: April 24, 2018; accepted: September 20, 2018; published on line: January 18, 2019

Resumen                                                    Abstract

Los acuíferos están siendo severamente                     Aquifers are being severely overexploited
sobre-explotados en muchas partes del                      in several sites around the world as urban
mundo conforme al continuo aumento de las                  populations continue to grow. Excessive
poblaciones urbanas. Además, la excesiva                   groundwater subtraction of aquifers has also
extracción del agua subterránea de los acuíferos           accelerated the consolidation of the overlying
ha acelerado dramáticamente la consolidación               aquitards dramatically, creating severe land
de los acuitardos sobre-yacientes, creando                 subsidence and many other related issues.
severos hundimientos del terreno y muchos                  Mexico City, with its population of 20 million
otros problemas relacionados. La Ciudad de                 inhabitants and depleted main aquifer, is a
México, con una población de 20 millones de                prime site for experimental approaches for
habitantes y un acuífero principal exhausto, es            redress. In this paper, a purpose-specific
un sitio que ofrece excelentes condiciones para            strategy for the land subsidence mitigation
experimentar técnicas de compensación. En                  of Mexico City is suggested. The strategy
este artículo, se propone una estrategia con el            consists of rising depleted pore pressure in
propósito específico de mitigar el hundimiento del         the shallow aquifer beneath Mexico City to
subsuelo de la Ciudad de México. La estrategia             induce a diffusion process through the upper
consiste en aumentar la presión de poro en el              and lower aquitards that generate increments
acuífero somero por debajo de la Ciudad de                 of pore pressure in the system to counteract
México con la intención de inducir un proceso              current pore pressure declines associated to
de difusión a través de los acuitados superior             groundwater withdrawals of the main aquifer
e inferior, para generar incrementos de presión            unit. The strategy is analyzed on the basis
de poro en el sistema que contrarresten los                of analytical solutions and typical hydraulic
actuales descensos de presión de poro asociados            parameters for the shallow aquifer-aquitard
a las extracciones de agua subterránea en                  system beneath Mexico City subject to one
la unidad acuífera principal. La estrategia se             injection well. The results provide for the
analiza analíticamente y se utilizan parámetros            first time the coupled hydraulic responses of
hidráulicos típicos del sistema acuífero-acuitado          the shallow aquifer-aquitard system beneath
somero por debajo de la Ciudad de México                   Mexico City subject to water injection and
sujeto a un pozo de inyección. Los resultados              provides useful data for field injection tests to
proporcionan, por primera vez, las respuestas              be conducted in the near future.
hidráulicas acopladas del sistema sujeto a la
inyección de agua y proporcionarán datos útiles            Key words: Induced diffusion. Analytical
cuando se realicen pruebas de inyección en el              solutions. Coupled hydraulic responses. Land
futuro cercano.                                            subsidence.

Palabras clave: Difusión inducida. Soluciones
analíticas. Respuestas hidráulicas acopladas.
Hundimiento del terreno.

F. Vázquez-Guillén*
G. Auvinet-Guichard
Instituto de Ingeniería
Coordinación de Geotecnia
Universidad Nacional Autónoma de México
Ciudad Universitaria, Apdo. Postal 70-472
Coyoacán, 04510
CDMX, México.
*
 Corresponding author: fvazquezg@exii.unam.mx

                                                      81
F. Vázquez-Guillén and G. Auvinet-Guichard

Introduction                                              m per year (Auvinet et al., 2017). Zones
                                                          where thickness and/or compressibility of
Mexico City is located within the southwestern            aquitards vary steeply, differential settlements
portion of the Basin of Mexico (Figure 1).                (from point-to-point) become so disparate
Conventionally, the Valley of Mexico refers to            that, beyond a certain limit, the soil begins to
the lowest area of this basin. It is essentially an       fracture (Auvinet et al., 2013). Soil fracturing
extensive plain at an average altitude of 2240            has caused the collapse of buildings, breakage
m above sea level formed by low strength,                 of water and sewage pipelines, wastewater
very compressible, lacustrine clayey aquitards            flooding and leakages (Jimenez et al., 2004).
partially overlying highly productive regional            Several studies have confirmed that through
aquifers of volcanic and sedimentary origin.              such fractures, aquifers are directly exposed
Over 20 million people in Mexico City and its             to pollution caused by wastewater and
metropolitan area rely on groundwater as their            garbage leaching (Mazari and Mackey 1993).
main water resource. Currently, greater rates             In addition, large portions of the lacustrine
than can be naturally replenished are being               sediments in the valley exhibit piezometric
subtracted from one of these aquifer units, so            depressions (Figure 2a) and increments of
in several detected locations it is overexploited         effective stresses (grain-to-grain) (Figure
(Conagua, 2009; NRC, 1995).                               2b). As water exploitation continues, rates
                                                          of subsidence and differential settlements
    Consequences      of    such      excessive           increase constantly. This cumulative process
groundwater exploitation extend well beyond               makes both the size of the subsiding area
decreasing freshwater availability for residents          and the damage on the built-up environment
in Mexico City. This exploitation has also                to increase. Under these conditions, building
accelerated    the   aquitard’s   consolidation           and/or maintaining the operational capacity of
dramatically, creating non-uniform spatially              any engineered work within the valley requires
distributed land subsidence all over the Valley           prognoses of piezometric losses, rates of
of Mexico. Areas where aquitards are at their             ground consolidation and subsoil deformations
thickest, subsidence may reach rates of 0.40              at the site in question (Reséndiz et al., 2016).

Figure 1. The location of Mexico City within the context of the Basin of Mexico. TMVB stands for Trans-Mexican
                                                 Volcanic Belt.

82      Volume 58 Number 1
Geofísica Internacional
Figure 2. Profiles illustrating typical conditions in the lacustrine plain beneath Mexico City and the purpose of
the injection well studied in our investigation: a) Pore pressure, b) Vertical effective stress. UC: Upper Clay; HL:
Hard Layer; LC: Lower Clay; DD: Deep Deposits.
Over the last few decades, Comisión same time, aquifer recharge activities were
Nacional del Agua (Conagua) and Sistema de implemented in other sites in Mexico City,
Aguas de la Ciudad de México (Sacmex) have specifically around the treatment plants in
implemented a program in Mexico City to “Cerro de la Estrella” (19°20’11.58” N; 99°
deal with aquifer overdraft and meet the ever 4’29.21” O) and “San Luis Tlaxialtemalco”
increasing water demand (Conagua, 2006; (19°15’29.87” N; 99° 1’46.31” O). Single-well
DGCOH, 1997; DGCOH and Lesser, 1991). injection rates of 0.05 m3/s and of 0.06 m3/s
Among the main actions of this program, one were used to recharge the main aquifer unit
consists of artificially recharging the main in these two sites (DGCOH, 1997). In 2007,
production aquifer with treated waste water as a result of these investigations, Conagua
and/or rainfall water at a rate of 10 m3/s using published the first official standards in the
injection wells located to an average depth of country regarding the recuperation of aquifers
~150 m (DGCOH, 1997). Artificial recharge and protection of groundwater (NOM-014-
attempt to reduce the aquifer’s overdraft Conagua-2007; NOM-015-Conagua-2007).
within Mexico City’s area estimated in ~22 Presently, the artificial recharge technique and
m3/s (World Bank, 2013). The authorities also the interaction between the native water and
expect to reduce land subsidence through the injected water are still under examination
this program, but this benefit is seen as a (Huizar et al., 2016; Conagua, 2006).
collateral effect; they are mostly concerned
with restoring abstracted volumes of water to Artificial recharge studies relating to Mexico
the main production aquifer safely. City have examined the general performance
of injection wells in the field (Cruickshank,
The most significant efforts to implement 1998), the feasibility of using reclaimed
a recharge program began at the end of wastewater as the injected water (Carrera and
the past century when water injection tests Gaskin, 2007; DGHOH, 1997), the impact of
were conducted as part of the activities of injecting treated wastewater on the quality of
“Proyecto Texcoco” (Cruickshank, 1998). This the native water (Conagua, 2006; DGHOH,
project aimed to create a storage wastewater 1997) and the rates at which water can be
reservoir consisting of several artificial lakes injected at specific sites (Cruickshank, 1998;
by consolidation of in-situ soils through DGCOH and Lesser, 1991). However, there has
groundwater extraction wells. Around the not been a study of underground injection for
January - March 2019 83F. Vázquez-Guillén and G. Auvinet-Guichard
land subsidence mitigation. Thus, this paper compressibility curve of Mexico City’s clay that
examines underground injection specifically as represents the consolidation of the overlying
a strategy for the land subsidence mitigation aquitard subject to the influence of groundwater
of Mexico City. In other words, we investigated withdrawals in the underlying aquifer. Due to
an injection well whose main purpose was not the large permeability contrast between the
to restore abstracted volumes of water to the aquifer and aquitard, head declines in the
main aquifer unit, but rather, to counteract aquifer give rise to excess pore pressure in
current pore pressure declines in the aquitards the aquitard that diminishes toward the land
as a result of groundwater withdrawals. Figure surface. A transient downward movement of
2 illustrates the setting of the injection well water through the aquitard is thus induced
considered in our investigation. The results of that reaches a steady state condition when the
this study provide for the first time the coupled hydraulic head in the aquitard equilibrates with
hydraulic responses of the shallow aquifer- the head change in the adjacent aquifer.
aquitard system beneath Mexico City subject
to water injection and provides useful data for During the transient state condition, total
field injection tests to be conducted in the near stress in the aquifer-aquitard system remains
future. constant, so changes in pore pressure are
associated with equal and opposite changes in
Principles of water injection into aquifer- effective stress. As a result, effective stress (
aquitard systems σ v' ) increases and a reloading of the aquitard
takes place. Initially, the increment in effective
In alluvial, lacustrine and shallow-marine stress in the aquitard may be small and thus,
environments, clayey aquitards often appear land subsidence may be so as well. However,
'
interbedded and interfingered with sandy and as soon as the preconsolidation stress ( σ p ) is
gravelly aquifers. Aquifers may be confined and surpassed, the aquitard suffers deformations
semiconfined by aquitards. Most of the times, on the virgin loading curve with a sudden
there is a large permeability contrast between increase in compressibility and subsidence rate
aquifers and aquitards and also aquitards (stress path 1-2). This inelastic compression of
are of a highly compressible nature. These the aquitard is responsible for the vast majority
characteristics make that an aquifer-aquitard of land subsidence.
system respond to fluid injection as a leaky-
aquifer system for practical purposes. Leaky- The injection well studied in our investigation
aquifer systems are represented by alternating attempts to counteract this ongoing process
layers of aquifers and aquitards, each of which by increasing pore pressure in the aquitard by
is characterized with its hydraulic conductivity, diffusion. As a result of this practice, the effective
specific storage and thickness. Thus, the coupled stress is decreased causing the aquitard to
hydraulic responses of leaky-systems (pore recover a small portion of the total deformation
pressure responses, head buildup in aquifers (stress path 2-3). Evidence of this response
and leakage rates through aquitards) involve has been found during underground injection
the hydraulic parameters of both aquifers and tasks conducted in several sites around the
aquitards. Several authors have discussed the world (Zhang et al., 2015; Zhou and Burbey,
hydrodynamics of wells in such systems (e.g. 2014; Amelug et al., 1999), where decrements
Neuman and Witherspoon, 1969; Herrera and in effective stress have been indirectly verified
Figueroa, 1969; Herrera, 1970; Herrera, 1976; by measuring expansions at specific hydro-
Cheng and Morohunfola, 1993; Cihan et al., stratigraphic units of the injection formation.
2011). The theory of effective stress and one- For the shallow aquifer beneath Mexico City,
dimensional consolidation (Terzaghi, 1925), is the limiting value of the increment in pore
directly applicable to the understanding of the pressure may be bounded by the hydrostatic
behavior of aquifer-aquitard systems subject to profile, yet theoretically, only a small value
water injection (Domenico and Mifflin, 1965). is needed in order to mitigate subsidence. In
Alternatively, the aquitard-drainage model can practice, however, it is necessary that further
be used for the same purpose (Tolman and increments of effective stress in the aquitard
Poland, 1940). associated to groundwater subtraction of the
main aquifer unit be counteracted by the
In the following, a leaky-aquifer system injection well. After increments of effective
consisting of one aquifer underlying one stress in the aquitard have been counteracted,
aquitard is considered. To better appreciate the subsidence in Mexico City can be mitigated
impact of water injection on land subsidence or even arrested. Otherwise, the tendency of
mitigation, the phenomenon of land subsidence subsidence will continue unabated (stress path
is explained first. Figure 3 illustrates a typical 2-4).
84 Volume 58 Number 1Geofísica Internacional
Figure 3. Typical compressibility curve of the Mexico City’s clay illustrating the effects of groundwater extraction
and water injection.
Previous applications of underground computational tools in the near future (Teatini
injection et al., 2011). In Mexico City, however, injection
sites have not been studied for their potential
The first applications of underground injection ability to mitigate land subsidence, despite
addressing land subsidence issues appeared several decades of injections for the purpose
within the oil industry. At the end of the 1950’s, of water replenishment.
water injection into the subsurface was used
to mitigate excessive surficial settlements Shallow aquifer-aquitard system beneath
originated by oil extraction in the Wilmington Mexico City
field, Long beach, California (Otott and Clarke,
1996). Later on, this strategy was adopted The fill of the Mexico Basin comprises lacustrine
by several countries as a complementary and alluvial deposits. The upper most ~100-
policy for land subsidence mitigation and its 150 m of this fill has been described by
implementation showed promising results several researchers (Marsal and Mazari, 1959;
(Poland, 1972; Poland, 1984). Cities where this Zeevaert, 1982; Vázquez and Jaimes, 1989).
practice has successfully been implemented For illustrative purposes, one stratigraphic
include: Las Vegas (Amelug et al., 1999; Bell et cross-section E-W of the upper ~90 m of
al., 2008), Shanghai (Zhang et al., 2015; Shi such fill is shown in Figure 4a. Specifically,
et al., 2016) and Bangkok (Phien et al., 1998), the lacustrine deposits of the basin fill consist
among others. Depending on the magnitude of of low strength, highly compressible clays
the induced expansions and the management of and allophanes (Ovando et al., 2013). The
the groundwater extractions, land subsidence average thickness of the lacustrine deposits is
in these cities has been controlled, mitigated ~40-50 m beneath Mexico City but increases
or arrested. Moreover, a water injection project significantly outside the city limits. Beneath
led by the University of Padua which aims to Mexico City, lacustrine deposits are present
uplift the city of Venice in order to protect it in two formations –the upper and lower clay
from periodic floods is at a very advanced stage formations-- clearly divided by a lens of only
of development (Gambolati and Teatini, 2014). a few meters thick composed mainly of sands,
Recently, the project has been studied carefully gravely sands, and thin lenses of soft silty clays
through numerical simulations (Teatini et al., (Ovando et al., 2013). The National Research
2010) and researchers expect to perform Council called this permeable unit the “shallow
injection tests for calibrating the developed aquifer” because it provided freshwater to
January - March 2019 85F. Vázquez-Guillén and G. Auvinet-Guichard
Mexico City in the mid to late 1800s (NRC, 3x10⁻¹⁰ ms-1 in one site near downtown Mexico
1995). The soil mechanics community refers to City. For the hard layer, Rudolph et al. (1989)
this soil stratum as the first “hard layer” after report average values of 1x10⁻⁴ ms1 and of
Marsal and Mazari (1959). Overlying the upper 8x10⁻⁵ ms-1 for the hydraulic conductivity
clay formation, a crust of dried low plasticity and values of 1x10⁻³ m-1 and of 2x10⁻³ m-1
silty clays is found, which in turn underlies an for the specific storage coefficient. Herrera
anthropogenic fill. The alluvial deposits of the et al. (1989) report values for the horizontal
basin fill, in contrast, comprise very consistent hydraulic conductivity of the deep deposits
silts and sandy silts interbedded with hard generally ranging between 1x10⁻⁵ ms-1 and
clays. Marsal and Mazari (1959) refer to these 15x10-5 ms-1 with isolated values of 0.01x10-
soils as the “deep deposits” when they appear 5
ms-1 and values from 1x10⁻⁶ m-1 to 10x10-6
underlying the lower clay formation. m-1 with isolated values of 0.01x10⁻⁶ m-1 for the
specific storage coefficient.
The vertical hydraulic conductivity of the
aquitards varies between ~5x10⁻⁹ ms-1 and Before extensive groundwater withdrawal
~20x10-9 ms1, whereas their specific storage from the shallow aquifer in the mid to late
coefficient is found in the range of ~1x10- 1800s, both the regional aquifer and shallow
2
s-1 to ~15x10-2 s-1 (Herrera et al., 1989). aquifer were subject to artesian pressure (NRC,
Marsal and Mazari (1959) demonstrated 1995), so natural discharge paths caused water
through geotechnical explorations that the clay to move upward through the aquitards (Durazo
sediments become stiffer and less permeable and Farvolden, 1989). Currently, extensive
with depth. Some authors have found evidence groundwater subtraction has inverted the
of reduced hydraulic conductivity during field- gradients and water is now moving downward
permeability tests. Near the aquifer-aquitard in most of this area (Ortega and Farvolden,
interface, Rudolph et al. (1991) found values 1989). Thus, aquitards are now contributing
in the range of 2.5x10⁻⁹ ms-1 to ~3.5x10⁻⁹ ms-1 to the aquifer’s yield by leakage flux which is
in the Texcoco area, and Vargas and Ortega derived mainly from a depletion of storage in
(2004) found values between 3x10-11 ms-1 and the clayey aquitards.
Figure 4. Illustration of the subsoil beneath Mexico City (Modified after Marsal and Mazari, 1959): a) Cross-
section W-E through the lacustrine plain; the location of cross-section AA’ is indicated in Figure 1, b) Conceptual
model of the shallow aquifer-aquitard system.
86 Volume 58 Number 1Geofísica Internacional
On the basis of field and laboratory data the following governing equation (Cihan et al.,
collected over the last decades related to 2011):
the compression of the upper aquitard in the
central part of Mexico City (Ovando et al., − +
2003), it is estimated that leakage of the upper 1 ∂ ∂si 1 ∂si wi wi
aquitard may account for ~50-60% of total r = + + ; i = 1, , N ,
r ∂r ∂r Di ∂t Ti Ti
land subsidence in this area. Leakage flux of (1a)
aquitards together with the initial exploitation
of the shallow aquifer may also explain the where si = hi(r, t)-hi0 with hi [L] being the
typical conditions for pore pressure decline hydraulic head in aquifer i and hi0 the initial
observed in most of the lacustrine plain. Pore head in that aquifer. Di = ki /Ssi [L2T-1] is the
pressures in the upper ~15 m are often found hydraulic diffusivity where ki [LT-1] is the
at hydrostatic conditions, yet in deeper sandy hydraulic conductivity and Ssi [L-1] is the
layers within the clays, pore pressure depletion specific storage coefficient of aquifer i. Ti = kibi
rates from 0.002 to 0.014 kPa per year have [L2T-1] is the transmissivity with bi [L] being
been reported by some research (Ovando et al., the thickness of aquifer i. r [L] is the radial
2003). Hence, any injection project designed distance from the center of the well and t [T] is
a
to mitigate aquitard’s consolidation process the time. wi [LT-1] denotes the rate of diffuse
induced by the depletion of pore pressures leakage (i.e. specific discharge) through the
as a consequence of the exploitation of the aquifer-aquitard interface from aquifer i into
main aquifer should increase pore pressure in the overlying (a = +) or underlying (a = -)
aquitards to a faster rate. This paper provides aquitard, and can be calculated according to:
a first estimate of pore pressure restoration
rates taking into account the coupled flow
in aquifers and aquitards on the basis of the kiα ∂siα
following mathematical model. wiα = − (1b)
biα ∂zαDi
zαDi =0
Mathematical model for water injection
The mathematical model for water injection where sia = sia (r , z aDi , t ) [L] is the hydraulic
a
adopted here is based on a set of governing head buildup in aquitard (i, a), k i [LT-1]
equations formulated to represent transient is the hydraulic conductivity and bi [L] is
a
groundwater flow in a homogeneous and the thickness of that aquitard. z aDi = zia / bia ;
isotropic, confined multilayered aquifer- {0 ≤ z aDi ≤ 1} is the dimensionless local vertical
aquitard system of infinite horizontal extension a
coordinate and zi [L] is the local vertical
with one injection well screened over the a
coordinate, with zi = 0 at the interface
entire thickness of selected aquifers. Figure 4b between aquifer i and aquitard (i, a), and
illustrates one such system consisting of two zia = bia at the interface between aquifer i + a
aquifers and two aquitards. The flow pattern and aquitard (i, a). Note that i + a = i + 1 for a
induced by the injection well is assumed to be = +, while i + a = i - 1 for a = -.
horizontal in aquifers and vertical in aquitards.
This assumption is widely used in practice as The vertical flow through aquitard (i, a) is
long as the hydraulic conductivity contrast described by the well-known diffusion equation:
between aquifers and adjacent aquitards is
at least of one order of magnitude (Neuman
and Witherspoon, 1969). The exchange of ∂ 2 siα (biα ) 2 ∂siα
α 2
= α ; 0 ≤ zαDi ≤ 1 (2a)
water that occurs through the aquifer-aquitard ∂z Di Di ∂t
interfaces as a result of the injection of water
is called leakage. In such leaky-systems, subject to boundary conditions at aquifer-
horizontal flow in aquifers is coupled with each aquitard interfaces:
other by accounting for diffuse leakage through
aquitards according to the following system of
governing equations.
siα (r , 0, t ) = si (r , t )
(2b)
siα (r ,1, t ) = si +α (r , t ),
Governing equations for multilayered
systems where Diα = kiα / Ssiα is the hydraulic diffusivity
a
In terms of the hydraulic head buildup si = and Ssi is the specific storage coefficient of
si(r, t) [L], single-phase radial flow in aquifer aquitard (i, a). In equation (2b), there is a
+ + − −
i of the multilayered system is described by relationship such that si ( r , z Di , t ) = si +1 ( r , z Di+1 , t )
− +
for z D = 1 − z D .
i +1 i
January - March 2019 87F. Vázquez-Guillén and G. Auvinet-Guichard
Assuming that the entire system of aquifers solution procedure essentially consists of
and aquitards is at hydrostatic pressure at t = transforming the governing equations into
0, the initial conditions for the system can be the Laplace-domain (Cihan et al., 2011a;
written as: Cheng and Morohunfola, 1993; Zhou et al.,
2009) and solving the resulting system of
si (r , t = 0) = 0, ordinary differential equations by applying the
(3) eigenvalue analysis method (Churchill, 1966;
siα (r , zαDi , t = 0) = 0. Hunt, 1985). The set of analytical solutions
used in this paper are explained in the sequel.
Outer boundary conditions are:
The head buildup in the aquifers of a
si (∞, t ) = 0, multilayered system with one injection well
(4) and diffuse leakage is given by:
siα (∞, zαDi , t ) = 0.
( )
N
The top and bottom boundaries of the si = ∑ c Ij ξi , j K 0 r λ j , or (8a)
system may have either a zero head buildup or j =1
a non-flow condition:
c Ij = 1 ( 2π EiI, j ) ∑ k =1 Q k ( p ) ξ k , j ,
N
s1− (r ,1, t ) = 0 or (5a) (8b)
I
∂s1− (r ,1, t ) / ∂z D−1 = 0, (5b) where c j are the coefficients obtained from
the boundary condition at the injection
wellbore which are expressed as a function of
sN+ (r ,1, t ) = 0 or (6a) the Laplace variable p (representative of time),
Q ( p )
is the Laplace transform of Equation
(7) (Cihan et al., 2011), K0 is the zeroth-
∂sN+ (r ,1, t ) / ∂z D+ N = 0. (5a) order modified Bessel function of second kind,
As mentioned above, Equations (1)-(6) EiI, j = rwi λ j K1 (rwi λ j ) with EiI, j = 1 as
couple the one-dimensional radial flow in rwi → 0 , where K1 is the first-order modified
aquifers with each other through the vertical Bessel function of second king. l and x are the
flow in aquitards. eigenvalues and eigenvectors, respectively,
of the eigenvalue system (A'-lI)x' = 0 with
Boundary conditions for one injection well A ' = T1/ 2 AT−1/ 2 and x’=T1/2x, where A is a
matrix of dimension N x N referred to as the
In presence of one injection well with constant diffuse-leakage-coupling matrix, T is the
or time-dependent injection rate, the boundary diagonal transmissivity matrix of dimension N
condition at the radial wall of the cylindrical x N with components Ti and I is a unit diagonal
well interval screened in any aquifer is written matrix.
as:
The rate of diffuse leakage through the
∂s (r , t ) aquifer–aquitard interface between aquifer
−2π rwiTi i wi = Qi (t ); i = 1, , N , (7) i and its neighboring aquitard (i, a) can be
∂r calculated by integration of the diffuse leakage
over the entire interface area (Zhou et al.,
where Qi(t) is the injection rate through the 2009):
injection well with radius rwi fully screened
into aquifer i, and si is the corresponding head
∞
Q iα = 2π ∫ w iα ( r , p ) rdr = ∑ ∑
N N
(
fiα ξi , j − giα ξi +α , j )
ξ k , j Q k ( p ) ; i = 1,… ,
buildup in that aquifer. Conventionally, Qi(t) > 0 j =1 k =1 λj
0 is used for injection. As a first approximation, ∞
Qi = 2π ∫ wi ( r , p ) rdr = ∑ ∑
no skin effect nor well bore storage are taken
α
α
N N
(
fiα ξi , j − giα ξi +α , j )
ξ k , j Q k ( p ) ; i = 1,… , N .
into account. 0 j =1 k =1 λj
∞ N N
( fiα ξi, j − giα ξi+α , j )ξ Q p ; i = 1,…, N .
Q α = 2π w α ( r , p ) rdr =
∫0 i for one injection
Analyticali solutions ∑ ∑ wellλ
j =1 k =1
k, j k ( ) (9)
j
Analytical solutions to Equations (1)-(7)
α α α
were obtained by Cihan et al. (2011a,b) where w i (r , p ) = fi si − gi si +α is the aLapla-
using the Laplace transform method. The ce transform of the diffuse leakage. f i and
88 Volume 58 Number 1Geofísica Internacional
gia are functions that depend on the type of the shallow aquifer beneath Mexico City is
boundary conditions specified at the top and considered (Figure 4a). Then, it is simplified
bottom boundaries of the system. to a multilayered aquifer-aquitard system
which consists of two-aquifers and two
For the particular case of a multilayered aquitards (Figure 4b). The aquifer between
system with no-flow condition specified at the aquitards represents the shallow aquifer,
bottom boundary (Equation 5b) or at the top whereas the overlying and underlying
boundary (Equation 6b), the corresponding aquitards characterize the upper and lower
equations for the head buildup in aquitards clay formations. The lower aquifer represents
become: the deep deposits. An injection well with a
radius of 0.15 m is drilled vertically through
cosh κ iα 1 − zαDi ( ) the upper three layers. Then, the injection
α
( α
s = r , z , p = si
i Di )
cosh(κ iα )
, well is cased throughout the upper two layers,
but it is screened over the entire thickness of
(10a) the intermediate aquifer, which is the shallow
aquifer. Layers of the system are assumed to
with: be horizontal. A confined system whose lateral
boundaries extend to infinity is assumed.
Thus, the ground surface and bottom of the
κ iα ( p ) = p Diα biα , (10b) model are no-flow boundaries. The system is
assumed to be under hydrostatic equilibrium
and the functions fia and gia are given by: with respect to the hydraulic head. Hence,
computed pore pressures are in fact values in
excess of the hydrostatic profile and the effect
fiα ( p ) = (κ iα biα ) κ iα tanh (κ iα ) , (11a) of a non-hydrostatic initial equilibrium on the
relative increments in pore pressure with depth
is assumed to be negligible. The conditions
giα ( p ) = 0. (11b) under which the analysis is conducted are
also assumed to be representative of one
Solutions to Equations (8)-(11) are obtained injection well outside the influence range of
here using the computational code ASLMA any pumping well into the deeper production
(Cihan et al., 2011b). Details of the analytical aquifer. For this analysis, hydraulic properties
solution procedure and its verification process typical of the shallow aquifer-aquitard system
can be found elsewhere (Cihan et al., 2011a; beneath Mexico City area are chosen (Table
Cheng and Morohunfola, 1993). Analytical 1). Values of specific storage for the upper
solutions calculate the transient behavior of and lower clay formations used in the analysis
pressure buildup in aquifers and aquitards and consider the less compressible character of the
the rate of diffuse leakage through aquitards. soils under the unloading stress paths imposed
by the injection well, in agreement with the
Conceptual model and its hydraulic recommendations of several authors (Marsal
characterization and Mazari, 1959; Teatini et al., 2010; Teatini
et al., 2011; Gambolati and Teatini, 2014).
In the present analysis, one cross-section
that is deemed to be representative of
Table 1. Hydraulic properties used in the conceptual model of the shallow aquifer-aquitard system
beneath Mexico City subject to one injection well. UC: Upper Clay; HL: Hard Layer; LC: Lower Clay;
DD: Deep Deposits.
Unit Material b k T Ss S
[m] [ms-1] [m2s-1] [m-1] [--]
UC Very soft and highly compressible clay. 30.0 5.0x10⁻⁹ 1.5x10⁻⁷ 0.015 0.45
HL Very dense clayey sand. 3.0 5.0x10⁻⁵ 1.5x10⁻⁴ 1x10⁻⁴ 0.0003
LC Soft and highly compressible clay. 8.0 1.0x10⁻⁹ 8.0x10⁻⁹ 0.005 0.04
DD Very dense silty sand and gravel. 9.0 1x10⁻⁴ 9.0x10⁻⁴ 5x10⁻⁵ 0.00045
January - March 2019 89F. Vázquez-Guillén and G. Auvinet-Guichard
Computed hydraulic responses and gradual. The dashed line plotted in both figures
discussion indicates an upper threshold for pore pressure
development calculated as the sum of the
Coupled hydraulic responses as a function of vertical effective stress at the bottom of the
time of the shallow aquifer-aquitard system UC formation and the undrained shear strength
beneath Mexico City subject to water injection of this formation at that depth. Assuming
are analyzed in this section. Injection rates of an average undrained resistance for the UC
0.002 m3s-1 and of 0.004 m3s-1 and injection formation equal to 70 kPa at 30 m depth on
periods of 1000 d and of 5000 d are considered the basis of the values reported by Marsal and
for analyzing the hydraulic responses. The Mazari (1959) and reading from Figure 2b a
analyzed responses comprise pore pressure typical value for the effective vertical stress
responses in the entire system, head buildup in equal to 140 kPa at that depth, the upper
aquifers and leakage rates through aquitards. threshold for pore pressure development
The assessment of leakage rates through the yields 210 kPa. This is an estimated upper limit
aquitards is necessary to quantify the amount that should not be exceeded in order to avoid
of water that is transferred from the injection hydraulic fracturing of the UC at the contact
aquifer to adjacent aquifers through the with the HL. As can be observed in Figure
aquitards. 5a, an injection rate of 0.004 m3s-1 induces
pore pressure slightly higher than such limit
Pore pressure responses very near the injection well and therefore this
rate may not be adequate in some practical
Plots of Figure 5 show the effect of the situations. However, the numerical value for
injection rate on pore pressure development avoiding the hydraulic fracturing of the clay
at the contact between the injection aquifer may vary from site to site, and therefore it
(HL) and the upper clay (UC) formation. Pore should be accurately determined in all cases.
pressure is plotted as a function of the radial
distance from the injection well center for two The effect of the injection period can also
injection periods. The results shown in Figure be seen in the plots of Figure 5. It shows that
5a and Figure 5b correspond to injection rates in passing from 1000 d to 5000 d of injection,
of 0.004 m3s-1 and 0.002 m3s-1, respectively. pore pressure does not increase significantly
From both plots, it is observed that pore near the injection well. As the distance
pressure decreases as injection rate decreases increases, pore pressure is increased around
and dissipates very fast near the injection 15-20 kPa for an injection rate of 0.004 m3s-1
well. Away from 15 m of the injection well (Figure 5a) and around 10 kPa for an injection
center, pore pressure reduction becomes more rate of 0.002 m3s-1 (Figure 5b).
Figure 5. Effect of the injection rate and injection period on pore pressure development at the interface between
the injection aquifer and the upper clay formation: a) The injection rate is Qw=0.004 m3s-1, b) The injection rate
is Qw=0.002 m3s-1. Pc is an estimated upper threshold for pore pressure development below which hydraulic
fracturing of the UC is avoided.
90 Volume 58 Number 1Geofísica Internacional
In order to evaluate the impact of the As explained above, the injection period
transmissivity of the injected formation on does not increase pore pressure significantly,
pore pressure development, two additional especially near the injection well, even though
cases are now considered. The results of these the injection period increases from 1000 d to
analyses are shown in the plots of Figure 6. In 5000 d.
the first case (Figure 6a), the transmissivity of
the injection aquifer is increased by one order of Pore pressure fields through the aquifer-
magnitude and in the second case (Figure 6b) aquitard system generated by the injection well
the transmissivity is decreased by one order of are shown in Figure 7 and Figure 8. The pore
magnitude. Again, the dashed line in both plots pressure fields of Figures 7a and 7b correspond
represents the estimated upper limit for pore to an injection rate of 0.002 m3s-1 and injection
pressure development. It can be observed periods of 1000 d and 5000 d, respectively.
from Figure 6a that as the transmissivity of Figures 8a and 8b show pore pressure fields
the injection aquifer increases, a higher rate of corresponding to an injection rate of 0.004
water can be injected into the aquifer without m3s-1 and injection periods of 1000 d and 5000
inducing pore pressure beyond the limit for d, respectively.
hydraulic fracturing of the clay. The injection
rate may even be as high as 0.03 m3s-1. However, For both injection rates and injection
Figure 6b indicates that as transmissivity of the periods, the highest increments in pore
injection aquifer decreases, it is necessary to pressure are observed very near the injection
reduce the injection rate dramatically in order well, at the interface between the HL and the
to avoid hydraulic fracturing. In this last case, UC and LC formations. As the injection period
the injection rate may be as low as 0.00045 increases, pore pressure propagates longer
m3s-1. Therefore, the transmissivity of the distances in both directions of the Cartesian
injection aquifer is one of the variables with plane. Namely, for an injection rate of 0.002
higher impact in the water injection task and m3s-1, pore pressure increments are observed
this parameter should be accurately determined at a depth of ~10 m after 1000 d of injection
in the field. This finding is consistent with the very near the injection well, but when the
results of stochastic simulations of multiphase injection period increases to 5000 d, pore
flow. The importance of the permeability of the pressure increments extend vertically upward
injection formation in application to geological from the injection aquifer significantly. In the
CO2 storage was pointed out in González et horizontal direction, pore pressure increments
al. (2015). Authors found that the aquifer are observed 800 m away from the injection
permeability have a significant influence on the well center for an injection period of 1000 d
pore pressure producing a wide-spread range of and beyond 1000 m for 5000 d of injection. For
fluid overpressure in their stochastic analysis. an injection rate of 0.004 m3s-1 and an injection
Figure 6. Effect of transmissivity of the injection aquifer on pore pressure development at
the interface between the injection aquifer and the UC formation: a) The transmissivity of the
injection aquifer is 1.5 x 10⁻³ m2s-1, b) The transmissivity of the injection aquifer is 1.5 x 10⁻⁵
m2s-1.
January - March 2019 91F. Vázquez-Guillén and G. Auvinet-Guichard
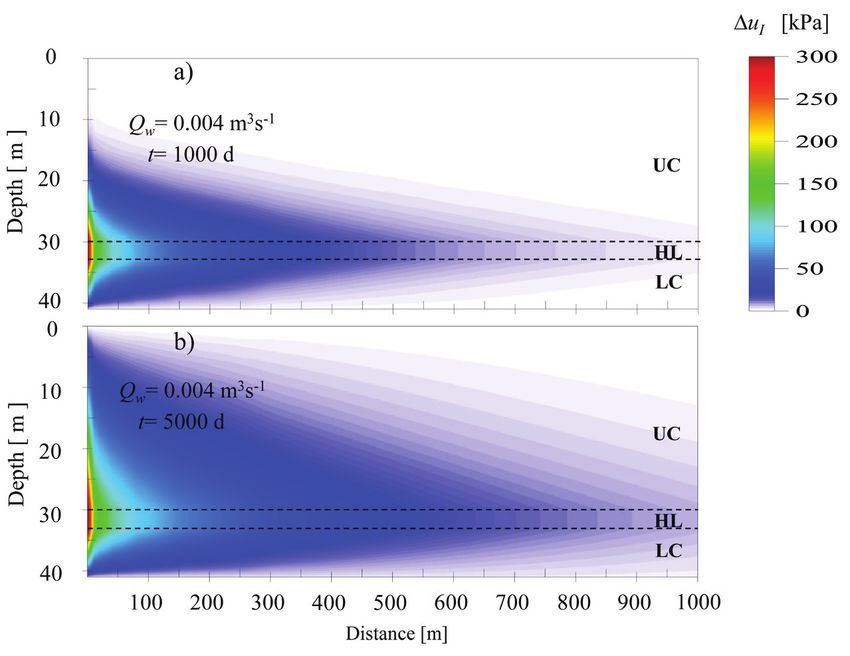
period of 5000 d, pore pressure propagates Table 2 summarizes increments of pore
vertically upward until it reaches a depth of pressure in the aquifer-aquitard system as
~0.25 m near the injection well. According to a function of the radial distance from the
results in Figure 5a, however, there is a risk of injection well center, depth from the surface
hydraulic fracturing of the UC formation very and injection rate after 1000 d of injection (see
near the injection well for such an injection rate. Figure 2a for explanation of the variables).
Considering the significant benefit of injecting The percentages reported in the table are
rates of the order of 0.004m3s-1, we suggest calculated as the ratio of the increment in pore
that investing sufficient resources is warranted pressure generated by the injection well and
to accurately determine the threshold at which the initial decrement in pore pressure, which is
hydraulic fracturing of the clay can occur during calculated as the difference between the actual
underground injection tasks. and the hydrostatic profiles at corresponding
Figure 7. Pore pressure fields
for an injection rate equal to
0.002 m3s-1: a) After 1000 d
of injection, b) After 5000 d of
injection.
Figure 8. Pore pressure fields
for an injection rate equal to
0.004 m3s-1: a) After 1000 d
of injection, b) After 5000 d of
injection.
92 Volume 58 Number 1Geofísica Internacional
depths (Figure 2a). The results reported in Computed pore pressure restoration rates
Table 2 indicate that for an injection rate of (ru) as a function of the injection rate for
0.002 m3s-1, ~19% of the initial deficit in different depths and radial distances from
pore pressure is restituted in UC formation the injection well center are reported in Table
at a depth of 23.5 m and 250 m away from 3. For an injection rate of 0.002 m3s-1, pore
the injection well center. At a depth of 38 m, pressure in the UC formation (23.5 m depth)
~7% of the initial deficit in pore pressure is increases at a rate of 1.82-0.22 kPa per year,
restituted in the LC formation at 250 m away whereas in the LC formation (38.0 m depth),
from the injection well. Note also that for the pore pressure increases at a rate of 1.64-0.23
same injection rate, pore pressure in the Hard kPa per year. Higher pore pressure restoration
Layer (HL) does not exceed the hydrostatic rates are found in the injection formation, as
conditions since only ~25.8% of the initial expected, and also when the injection rate
deficit in pore pressure is restituted in that increases. The reported restoration rates are
formation. As the radial distance from the significantly higher than the pore pressure
injection well increases, such values become depletion rates measured in the field by some
smaller. Note, too, that pore pressure can be researchers (Ovando et al., 2003). However,
raised safely by maintaining the same injection it should be noted that the present analysis
rate of 0.002 m3s-1, but increasing the injection is conducted in the absence of any pumping
period. The corresponding values achieved by well into the deeper production aquifer. Thus,
injecting a higher amount of water into the lower pore pressure restoration rates than
HL, for instance 0.004 m3s-1, indicates more those reported here may be expected in the
appealing results, yet such injection rates field. This is particularly true in the area of the
should not be considered in pore pressure shallow aquifer-aquitard system that remains
restitution projects within the lacustrine confined, which according to Carrera and
semiconfined aquifer of Mexico City unless the Gaskin (2007) is located toward the central
integrity of the UC formation can be confirmed. part of the lacustrine plain.
Table 2. Percentages of pore pressure restituted in the aquifer-aquitard system after 1000 d of
injection.
r=250 m r=500 m r=750 m
Qw Unit z u0 Du0 DuI DuI/Du0 DuI DuI/Du0 DuI DuI/Du0
[m s ] [m]
3 -1
[kPa] [kPa] [kPa] [%] [kPa] [%] [kPa] [%]
UC 23.5 182.8 26.4 4.99 18.90 1.66 6.29 0.60 2.27
0.002 HL 31.5 224.8 60.8 15.69 25.80 6.00 9.87 2.48 4.08
LC 38.0 282.4 62.4 4.48 7.18 1.58 2.53 0.62 0.99
UC 23.5 182.8 26.4 9.97 37.76 3.33 12.61 1.20 4.54
0.004 HL 31.5 224.8 60.8 31.38 51.61 12.02 19.77 4.96 8.16
LC 38.0 282.4 62.4 8.96 14.36 3.16 5.06 1.24 1.99
Table 3. Computed pore pressure restoration rates.
r=250 m r=500 m r=750 m
Qw Unit z ru ru ru
[m3s-1] [m] [kPa/year] [kPa/year] [kPa/year]
0.002 UC 23.5 1.82 0.61 0.22
HL 31.5 5.73 2.19 0.91
LC 38.0 1.64 0.58 0.23
0.004 UC 23.5 3.64 1.21 0.44
HL 31.5 11.45 4.39 1.81
LC 38.0 3.27 1.15 0.45
January - March 2019 93F. Vázquez-Guillén and G. Auvinet-Guichard
Head buildup in aquifers increase and leakage rates that cross the lower
boundary decrease because the UC formation
Head buildup in aquifers at a distance of 15 has greater storage capacity. Note that such
m from the injection well center is plotted in decrement in leakage rates is associated with
Figure 9 as a function of time for an injection a decrement in the leakage rates within the DD
rate of 0.004 m3s-1. As expected, higher head (Figure 11) because of flow continuity. As the
buildup is induced in the injection aquifer injection period becomes longer, comparatively
(HL, triangles) than in the deep deposits (DD, large amounts of water seep through the UC
diamonds). A steady state condition in the formation. Leakage rates crossing the bottom
injection aquifer is not reached before 10000 d boundary of the injection aquifer are lower than
of injection. Thus, a steady state flow condition 0.001 m3s-1 even for long injection periods.
through the hard layer is not as easily reached
as some authors (e.g. Zeevaert, 1982) Figure 11 presents the behavior of leakage
indicate. After 100 d of injection, head buildup rates crossing the top boundary of the DD as
starts developing in the DD (diamonds), but a function of time. Again, the injection rate is
the increments are very small. After 10000 d equal to 0.004 m3s-1. A quite short period of
of injection, the head buildup is lower than 1 time (100 d) is needed for the injection of the
m. Therefore, for injection periods shorter than HL to influence the DD because the thickness
10000 d, it seems sufficient to measure head of the LC formation is quite small (only 8 m).
buildup in the injection aquifer only during From 100 d to 1000 d of injection, leakage
underground injection tasks, since negligible rates increase. However, a rather small leakage
changes in head buildup within the DD should rate (lower than 0.000008 m3s-1), reaches the
be expected. DD after 1000 d of injection. As the injection
period increases, this leakage rate tends to
Leakage rates through aquitards a very small value. This is in agreement with
Figure 9 for DD results. At time t=10000 d,
Figure 10 plots leakage rates crossing the head buildup seems constant. Note that the
bottom (squares) and top (triangles) boundaries decrement in leakage rates for longer periods of
of the HL as a function of time for an injection time corresponds to the steady state condition
rate of 0.004 m3s-1. From a short period of that is reached in the UC formation, as the
time after the beginning of injection to 1000 leakage rate in the upper aquitard tends to the
d, the rate of water crossing both boundaries injection rate value. Considering the leakage
increases. Higher leakage rates cross the top rate crossing the LC formation, an insignificant
boundary of the injection aquifer during this influence is expected of the injected water
period of time because the UC formation is on the physical-chemistry composition of the
more permeable. After 1000 d of injection native water in the DD, provided the injected
leakage rates that cross the upper boundary and native water are compatible in quality.
Figure 9. Estimated head
buildup versus time for the
injection aquifer (HL) and the
Deep Deposits (DD).
94 Volume 58 Number 1Geofísica Internacional
Figure 10. Leakage rates
crossing the bottom (squares)
and top (triangles) boundaries
of the injection aquifer as a
function of time.
Figure 11. Leakage rates
crossing the top boundary of
the deep deposits (DD) as a
function of time.
Conclusions conducted under transient flow conditions on
the basis of analytical solutions and typical
In this paper, a purpose-specific strategy for hydraulic parameters for the shallow aquifer-
the land subsidence mitigation of Mexico City aquitard system beneath Mexico City subject
was suggested. This strategy consists of rising to one injection well. The results of the analysis
depleted pore pressure in the shallow aquifer comprise pore pressure responses in the entire
beneath Mexico City to induce a diffusion process system, head buildup in aquifers and leakage
through the upper and lower aquitards. This rates through aquitards. The main results of
diffusion process then generates increments this analysis can be summarized as follows:
of pore pressure in the system to counteract
current pore pressure declines associated 1. The transmissivity of the injection
to groundwater withdrawals from the main formation dominates the amount of pore
aquifer unit. The analysis of this strategy was pressure that is generated at the interface
January - March 2019 95F. Vázquez-Guillén and G. Auvinet-Guichard
between the injection aquifer and the upper that in practice the hydraulic responses of the
and lower clay formations near the injection system may be influenced by any pumping well
well center. into the production aquifer near the test site,
specifically in those locations of the shallow
2. For a give transmissivity of the injection aquifer-aquitard system that remain confined
aquifer, injection rate and injection period (Carrera and Gaskin, 2007). Therefore, it is
determine the distance at which pore pressure recommended to improve the results of the
is propagated through the system. The greater present contribution by accounting for the
the injection rate and the longer the injection influence of pumping wells in further analysis.
period, the longer the distances pore pressure
is propagated through the system in both Acknowledgements
directions. Considering average values for the
hydraulic parameters of the shallow aquifer- The authors thank Dr. Abdullah Cihan, at
aquitard system beneath Mexico City and an Lawrence Berkeley National Laboratory, for
injection rate of 0.002 m3s-1, pore pressure provide us with the FORTRAN code ASLMA. We
increments are observed 800 m away from the specially thank the two anonymous reviewers
injection well center after 1000 d of injection for the constructive comments, suggestions
and well beyond 1000 m after 5000 d of and improvements done to the original version
injection. of the manuscript.
3. Computed pore pressure restoration rates References
are significantly higher than the pore pressure
depletion rates measured in the field by some Amelung, F., Galloway, D. L., Bell, J. W., Zebker,
research (Ovando et al., 2003). Our results are H. A. and Laczniak, R. J. (1999). Sensing the
representative of one injection well outside the ups and downs of Las Vegas: InSAR reveals
influence range of any pumping well into the structural control of land subsidence and
deeper production aquifer. aquifer-system deformation. Geology, 27(6),
pp. 483–486.
4. The injection into the shallow aquifer
has a minor influence on the head buildup of Auvinet, G., Méndez, E. and Juárez, M. (2013).
the deep deposits. After 10000 d of injection, Soil fracturing induced by land subsidence
head buildup is lower than 1 m. Furthermore, in Mexico City, Proceedings of the 18th
contrary to some authors’ suggestions International Conference on Soil Mechanics
(Zeevaert, 1982), a steady state condition in and Geotechnical Engineering, Paris, pp.
the injection aquifer is not easily reached in the 2921-2924.
short-term. This may take more than 10000 d
of injection. Auvinet, G., Méndez, E. and Juárez, M. (2017).
El subsuelo de la Ciudad de México, Vol. 3,
5. The amount of water that is transferred Supplement to the Third Edition of the book
from the injection aquifer to the deep deposits by R.J. Marsal y M. Mazari, Instituto de
through the lower clay formation is very small. Ingeniería, UNAM.
As the injection period increases, this rate
tends to zero because the leakage rate in the Bell, J. W., Amelung, F. Ferretti, A., Bianchi, M.
upper clay formation tends to the injection and Novali, F. (2008). Permanent scatterer
rate value. Thus, most of the injected water is InSAR reveals seasonal and long-term
transferred to the upper clay formation as the aquifer-system response to groundwater
injection period increases. pumping and artificial recharge, Water
Resources Research, 44, W02407.
The strategy for land subsidence mitigation
advanced here is strongly based on well- Carrera-Hernández, J. J. and Gaskin, S. J.
established theoretical principles and has been (2007). The Basin of Mexico aquifer system:
implemented in several cities around the world regional groundwater level dynamics and
with success. The benefits of controlling land database development, Hydrogeology
subsidence in Mexico City are so immense that Journal, 15, pp. 1577–1590.
our strategy is worthy of further exploration.
A first estimate of its benefits was provided Carrera-Hernández, J. J. and Gaskin, S. J.
here. Furthermore, the results reported in this (2009). Water management in the Basin
paper are central in designing a field injection of Mexico: current state and alternative
test into the shallow aquifer-aquitard system scenarios, Hydrogeology Journal, 17, pp.
beneath Mexico City. However, it is recognized 1483–1494.
96 Volume 58 Number 1Geofísica Internacional
Cheng, A. H.-D., and Morohunfola, O. K. (1993). Downs, T. J., Mazari-Hiriart, M., Dominguez-Mora,
Multilayered leaky aquifer systems: Pumping R. and Suffet, I. H. (2000). Sustainability of
well solutions, Water Resources Research, least cost policies for meeting Mexico City’s
29(8), pp. 2787–2800. future water demand, Water Resources
Research, 36(8), pp. 2321-2339.
Churchill, R. V. (1966). Operational mathematics,
2nd Edition, McGraw-Hill. Durazo, J. and Farvolden, R. N. (1989). The
groundwater regime of the Valley of Mexico
Cihan, A., Zhou, Q. and Birkholzer, J. T. (2011a). from historic evidence and field observations,
Analytical solutions for pressure perturbation Journal of Hydrology, 112, pp. 171-190.
and fluid leakage through aquitards and
wells in multilayered-aquifer systems, Water Enciso-de la Vega, S. (1992). Propuesta de
Resources Research, 47, W10504. nomenclatura estratigráfica para la cuenca
de México, Universidad Nacional Autónoma
Cihan, A., Zhou, Q. and Birkholzer, J. T. de México. Instituto de Geología, Revista,
(2011b). User Guide for Analytical Solution 10(1), pp. 26–36.
of Hydraulic Head Changes, Focused and
Diffuse Leakage in Multilayered Aquifers Fries, C. (1960). Geologia del estado de Morelos
(ASLMA), Ernest Orlando Lawrence Berkeley y de partes adyacente de Mexico y Guerrero,
National Laboratory, Earth Sciences Division, region central meridional de Mexico: Instituto
pp. 72. de Geologia, UNAM, Boletin 60, pp. 236.
Conagua, (2006). Hacia una estrategia de Gambolati, G., and Teatini, P. (2014). Venice
manejo sustentable de agua en el Valle de Shall Rise Again—Engineered Uplift of
México y su zona metropolitana, Gerencia Venice Through Seawater Injection, Elsevier
regional XIII, Aguas del Valle de México y Insights, 100 pp., Elsevier, Amsterdam,
Sistema Cutzamala, Comisión Nacional del Netherlands.
Agua, México, D.F.
González-Nicolás, A., Baù, D., Cody, B. M., and
Conagua (2009). Actualización de la disponibilidad Alzraiee, A. (2015). Stochastic and global
media anual de agua subterránea: Acuífero sensitivity analyses of uncertain parameters
(0901) Zona Zetropolitana de la Cd. de affecting the safety of geological carbon
México, Diario oficial de la Federación. storage in saline aquifers of the Michigan
Basin, International Journal of Greenhouse
Cruickshank, G. G. (1998). Proyecto Lago de Gas Control, 37, pp. 99-114.
Texcoco: Rescate hidrogeológico, Comisión
Federal de Electricidad, CFE, México, D.F. Herrera, I. and Figueroa, G. E. (1969). A
correspondence principle for the theory of
De Cserna, Z., Aranda-Gómez, J.J., Mitre- leaky aquifers, Water Resources Research,
Salazar, L.M. (1988). Estructura geológica, 5, pp. 900-904.
gravimetría, sismicidad y relaciones
neotectónicas regionales de la cuenca de Herrera, I. (1970). Theory of multiple leaky
México: Boletín del Instituto de Geología, aquifers, Water Resources Research, 6, pp.
UNAM, México, 104, 1–71. 185-193.
DGCOH (1997). Estudio de factibilidad para el Herrera, I. (1976). A review of the
reúso de las aguas residuales y pluviales del integrodifferential equations approach to
Valle de México para satisfacer la demanda leaky aquifer mechanics, In: Advaces in
de agua potable a mediano plazo, a través groundwater hydrology, Ed. Z Saleem, Am.
de la recarga de acuíferos, Instituto de Water Resources Association, pp. 29-47.
Ingeniería, UNAM.
Herrera, I., Martínez, R. and Hernández, G.
DGCOH and Lesser (1991). Recarga artificial de (1989). Contribución para la Administración
agua residual tratada al acuıfero del Valle Científica del Agua Subterránea de la Cuenca
de Mexico, Ingeniería Hidráulica en México, de México, Geofísica Internacional, 28, pp.
pp. 65–70. 297-334.
Domenico, P. A. and Mifflin, M.D. (1965). Water Huizar-Álvarez, R., Ouysse, S., Espinoza-
from low-permeability sediments and land Jaramillo, M. M., Carrillo-Rivera, J. J. and
subsidence, Water Resources Research, 1(4), Mendoza-Archundia, E. (2016). The effects
pp. 563-576. of water use on Tothian flow systems in the
January - March 2019 97You can also read