Relative efficacy of three approaches to mitigate Crown of Thorns Starfish outbreaks on Australia's Great Barrier Reef - Nature
←
→
Page content transcription
If your browser does not render page correctly, please read the page content below
www.nature.com/scientificreports
OPEN Relative efficacy of three
approaches to mitigate
Crown‑of‑Thorns Starfish
outbreaks on Australia’s Great
Barrier Reef
David A. Westcott1*, Cameron S. Fletcher1, Frederieke J. Kroon2, Russell C. Babcock3,
Eva E. Plagányi3, Morgan S. Pratchett4 & Mary C. Bonin5
Population outbreaks of Crown-of-Thorns Starfish (COTS; Acanthaster spp.) are a major contributor to
loss of hard coral throughout the Indo-Pacific. On Australia’s Great Barrier Reef (GBR), management
interventions have evolved over four COTS outbreaks to include: (1) manual COTS control, (2)
Marine Protected Area (MPA) zoning, and, (3) water quality improvement. Here we evaluate the
contribution of these three approaches to managing population outbreaks of COTS to minimize coral
loss. Strategic manual control at sites reduced COTS numbers, including larger, more fecund and
damaging individuals. Sustained reduction in COTS densities and improvements in hard coral cover
at a site were achieved through repeated control visits. MPAs influenced initial COTS densities but
only marginally influenced final hard coral cover following COTS control. Water quality improvement
programs have achieved only marginal reductions in river nutrient loads delivered to the GBR and the
study region. This, a subsequent COTS outbreak, and declining coral cover across the region suggest
their contributions are negligible. These findings support manual control as the most direct, and only
effective, means of reducing COTS densities and improving hard coral cover currently available at a
site. We provide recommendations for improving control program effectiveness with application to
supporting reef resilience across the Indo-Pacific.
Crown-of-Thorns Starfish (COTS; Acanthaster spp.) are among the largest and most efficient coral predators,
and COTS population irruptions (often termed ‘outbreaks’) are a major contributor to coral loss throughout the
Indo-Pacific region1. To address increasing and elevated densities of COTS, manual control programs, mainly
involving lethal injections in situ2 or hand collections and disposal on s hore3, have been implemented since the
1960s. By 2014 some 84 manual control programs had been conducted across the Indo-Pacific, killing or remov-
ing at least 17 million starfish at an estimated cost of US$15–44 m illion1. Such programs have generally had
limited success in either suppressing COTS densities or preventing coral l oss3–5. Several authors have suggested
that successful manual control is unlikely with large scale or severe COTS population o utbreaks6–9. Given that
single-injection methods for culling individual COTS are now close to 100% e ffective10, significant improvements
in manual control programs are likely to be found in the strategic and effective deployment of in-water resources
to manage COTS impacts on coral reefs11,12. Despite this, there is little information available on the efficacy of
manual COTS control programs nor on their performance relative to other measures implemented to manage
population outbreaks of COTS to minimize coral loss.
The Great Barrier Reef Marine Park (GBR) is one of the world’s largest coral reef ecosystems and a glob-
ally recognized world heritage area. Despite its iconic status, the GBR is subject to a range of anthropogenic
threats, and, like tropical coral reefs around the world13,14, it has experienced significant degradation in recent
1
CSIRO, Land and Water, Atherton, QLD 4883, Australia. 2Australian Institute of Marine Sciences, Townsville,
QLD 4810, Australia. 3CSIRO, Oceans and Atmosphere, P.O. Box 2538, Brisbane, QLD 4072, Australia. 4ARC Centre
of Excellence for Coral Reef Studies, James Cook University, Townsville, QLD 4810, Australia. 5Great Barrier Reef
Marine Park Authority, Townsville, QLD 4883, Australia. *email: david.westcott@csiro.au
Scientific Reports | (2020) 10:12594 | https://doi.org/10.1038/s41598-020-69466-1 1
Vol.:(0123456789)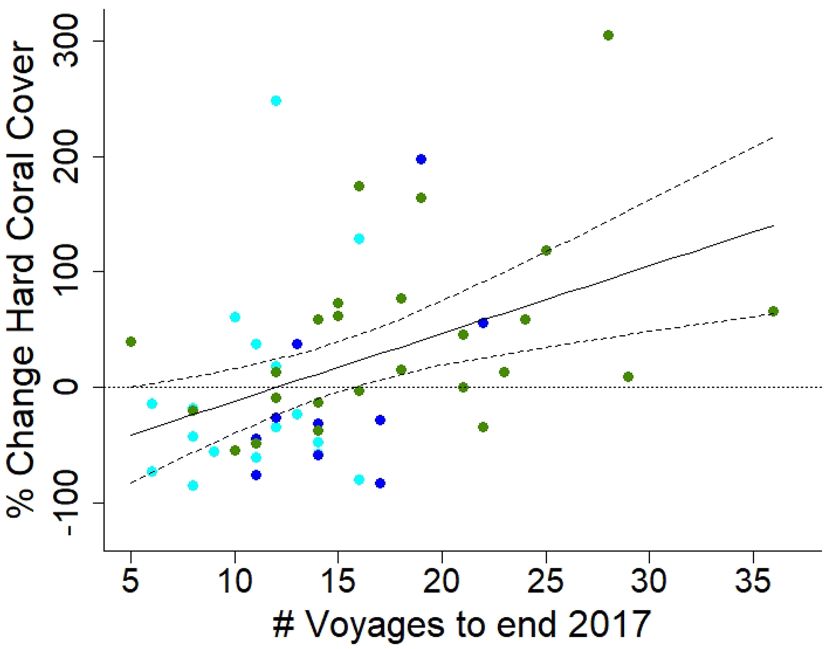
www.nature.com/scientificreports/
decades15–18. During the period 1985–2012, average hard coral cover across the GBR halved, which was in large
part attributed to recurrent population outbreaks of the Pacific Crown-of-Thorns Starfish, Acanthaster cf. sola-
ris15. Climate change, and specifically ocean warming has since emerged as the major cause of coral loss and reef
degradation on the GBR, causing extensive mass-bleaching and mass-mortality of corals in the far-northern
and northern GBR during 2016 and 2 01714. Simultaneously, however, the GBR has been experiencing renewed
outbreaks of COTS which started in 2008–2010 in the northern G BR1, and are currently concentrated on reefs
in the central and southern GBR. Notably, high densities of adult COTS are now occurring between Townsville
and Mackay19, causing greatest coral loss in areas that were mostly unaffected by recent mass-bleaching17. The
persistence of these outbreaks directly undermines reef resilience by adding to coral mortality, suppressing
coral recruitment and recovery20, and interfering in the capacity of corals to acclimate and adapt to changing
environmental conditions.
Sustained and ongoing degradation of coral reefs globally13,14 necessitates new and renewed consideration
of management effectiveness in supporting reef resilience21. To this end, we evaluate the contribution of three
management approaches to mitigating, if not preventing, COTS population outbreaks, with a view to minimizing
ongoing coral loss. Specifically, we assess the relative efficacy of (1) manual control, (2) marine protected areas
(MPAs), and (3) water quality improvement in influencing COTS numbers and coral cover during the current
outbreaks in the Cairns Sector of the GBR from 2013 to 2017 (Fig. 1; Supplementary Text S1, S2, S3). While
manual control programs have been implemented on the GBR since the 1 960s22, the program examined here
combines single-injection methods10 with improvements in how manual control is deployed (Supplementary
Text S1)11,12. The identification of hypothesized drivers of COTS population outbreaks, namely the loss of natural
predators that would limit COTS abundance and the increase in nutrient levels enhancing larval r ecruitment1,
has informed management action around these issues prior to and during the current outbreak (Supplementary
Text S2, S3)23,24. In contrast to manual control, both the use of MPAs to enhance predation and water quality
improvement to reduce larval survival represent indirect management interventions, working to protect predator
communities or to lower COTS recruitment by reducing phytoplankton biomass. Assessment of the relative effec-
tiveness of these three different approaches to COTS management is now possible given that MPAs (i.e. zoning)
have been in place since 1981 and were further expanded in 2 00425, water quality improvement programs have
been implemented since the early 2000s26, and strategic manual control has been undertaken since July 201311.
Here we ask whether these three management approaches: (1) reduce COTS densities, (2) are effective in
keeping densities low, and critically, (3) improve hard coral cover? Direct comparison of these three approaches is
not straightforward, however, given the very different temporal and spatial scales on which they are implemented,
measured, and on which they operate on COTS population dynamics. Hence, to assess the relative efficacy of
zoning and manual control, we use data on COTS abundance from the current COTS Control Program, and
coral cover from the Great Barrier Reef Marine Park Authority’s (GBRMPA) Reef Health Impact Surveys (RHIS),
collected at 52 sites at 21 reefs located in three different types of spatial zoning in the Cairns Sector from July
2013 to December 2017 (Fig. 1; see “Methods” for more detail). We compare these results with the achievements
in water quality improvement and concurrent changes in coral cover at unculled sites in the Cairns Sector up
until December 2017, by using publicly available and refereed scientific reports produced by the Queensland
and Australian Government, and the Australian Institute of Marine Science (AIMS). Finally, we consider the
implications of our results for how COTS Control Programs are designed at a variety of scales. While our work
is focused specifically on the GBR, COTS population outbreaks are commonly experienced elsewhere in the
Indo-Pacific and our results will have implications for control efforts across the range of Acanthaster spp. and
other coral predators, e.g. Drupella spp.
Results and discussion
Does manual control reduce COTS densities?. We first asked whether manual control could control
COTS densities at a site. To do this, we examined COTS control data from 52 sites with permanently marked
coral monitoring (RHIS) sampling points, where repeated manual control of COTS took place from July 2013 to
December 2017. These 52 sites were located at 21 reefs and were distributed across three different management
zones (Fig. 1).
Over the 4.5 year period, individual sites were visited on average 15 ± 6.2 (s.d.) times (range 5–36), with the
number of voyages to a site in a year ranging from 0 to 11 (mean 3.2 ± 2.3 s.d. voyages y r−1). At the start of the
Control Program, COTS densities at the 52 sites averaged 40 ± 54 s.d. individuals h a−1 (range 0–237) and were
−1
above an ecologically sustainable density threshold of 3 ha at 45 sites. We use this threshold as a benchmark
since coral growth is outpaced by predation by an ‘average’ COTS population at sites with low coral cover (esti-
mated as 5 ha−1 for just the three largest size categories)27, and COTS fertilization (and thus reproductive) suc-
cess increases substantially at densities of ≥ 3 ha−1 due to Allee effects 28. Manual control was effective in rapidly
reducing COTS densities with the median density of COTS encountered being significantly lower on the second
and subsequent voyages to a site than on the first voyage (Fig. 2; Friedman’s chi-squared = 9.31, df = 1, P = 0.0023;
Table S1). This decline was initially rapid with one voyage sufficient to bring the median COTS density to below
the ecologically sustainable threshold. The 75th percentile of sites reached this threshold following five culling
voyages and fluctuated around the threshold until the number of sites in the analysis dropped to below 5 sites
at 23 voyages and two and one site at voyages 27 and 29 respectively. Over the period of the study an average of
126 COTS h a−1 (range 5–723) were removed from each site.
The second and subsequent voyages to a site resulted in additional COTS being culled indicating the need
for repeated visits. This appears to be largely due to the fact that not all COTS present at a site are visible and
available to be culled at any one time29 and, to a lesser extent, to immigration into controlled sites from adjacent
Scientific Reports | (2020) 10:12594 | https://doi.org/10.1038/s41598-020-69466-1 2
Vol:.(1234567890)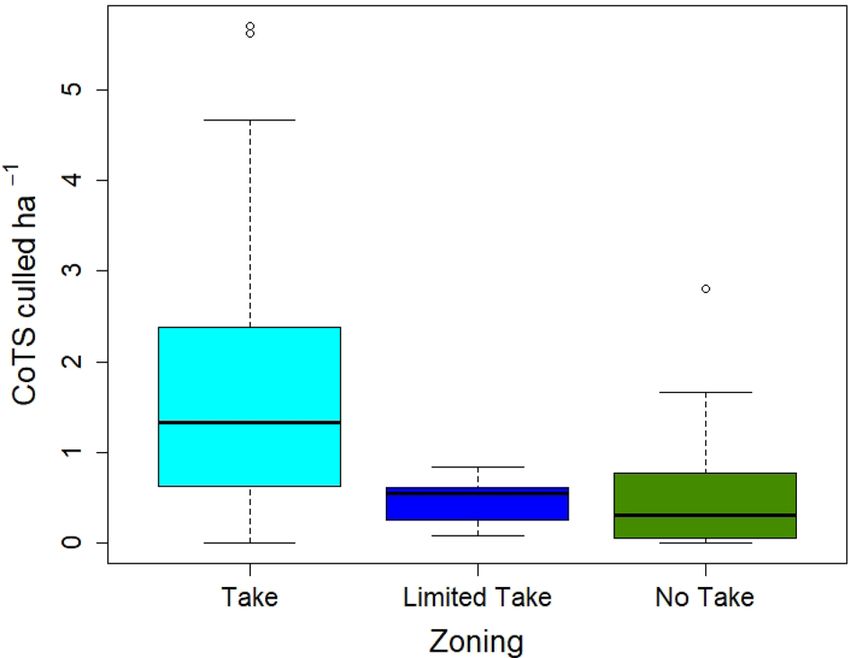
www.nature.com/scientificreports/
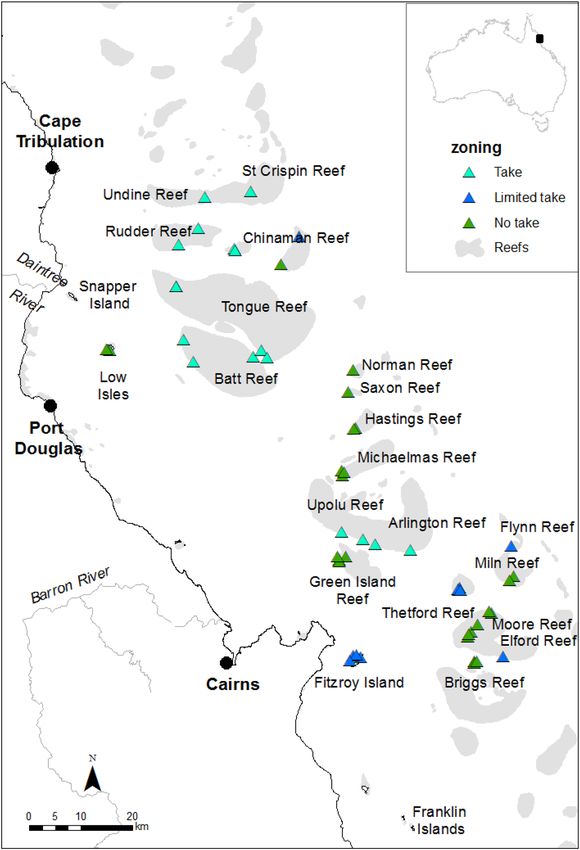
Figure 1. Site locations for manual control of the Pacific Crown-of-Thorns Starfish (COTS), Acanthaster cf.
solaris. Manual control of COTS took place at a total of 52 sites at 21 reefs in three different types of spatial
zoning in the Cairns sector of the Great Barrier Reef from July 2013 to December 2017 (light blue = take zones,
dark blue = limited take, green = no take). Data on COTS abundance from the COTS control program, and coral
cover from the Great Barrier Reef Marine Park Authority’s Reef Health Impact Surveys, were collected at each
of the 52 sites during this period. Insert shows location of study area in Australia. The spatial layers to create the
map were obtained from the Great Barrier Reef Marine Park Authority under a Creative Commons Attribution
4.0 licence (CC BY) (https://www.gbrmpa.gov.au/about-us/resources-and-publications/spatial-data-informatio
n-services).
Scientific Reports | (2020) 10:12594 | https://doi.org/10.1038/s41598-020-69466-1 3
Vol.:(0123456789)www.nature.com/scientificreports/
Figure 2. The effect of number of control voyages on the density of Pacific Crown-of-Thorns Starfish (COTS),
Acanthaster cf. solaris. Manual control of COTS took place at a total of 52 sites at 21 reefs in three different types
of spatial zoning in the Cairns sector of the Great Barrier Reef from July 2013 to December 2017. The density of
COTS encountered during a voyage at a site declined as a function of the number of voyages that had previously
visited that site. This decline was initially rapid and after roughly five voyages COTS densities fluctuated while
remaining low. Note, beyond 22 visits, sample sizes decline substantially with just six sites visited 23 or more
times; variation in COTS densities increases dramatically as a result. Dashed line = the ecologically sustainable
threshold for COTS outbreaks27, i.e. the density of COTS that can be sustained before coral cover is lost, Solid
bar = median, box = quartiles, whiskers = extremes, circles = outliers. Sample sizes given above the x-axis.
areas (see below). This result emphasizes the need for repeat voyages to a site in order to achieve sustained, reli-
able reductions to below the ecological threshold.
The impact of manual control was not consistent across the four COTS size categories (Fig. 3). The median
densities of the largest size classes (> 15–25 cm, > 25–40 cm, and > 40 cm diameter) were significantly lower on
the second and subsequent voyages than on the first voyage (Friedman’s chi-squared = 27, df = 1, P < 0.0000003)
and reduced to levels below the ecological threshold (Fig. 3). While the densities of the smallest size class (< 15 cm
diameter) also declined after the first voyage, this was to a smaller extent (Fig. 3, lower panel; Friedman’s chi-
squared = 9.0, df = 1, P < 0.0027; Table S1). This might be due to smaller individuals being (1) harder to find,
as reported by divers, (2) more likely to emerge in the absence of a dults30, or (3) more nocturnal and thus less
exposed to culling31. These results suggest two things. First, manual control effectively targets the most damag-
ing individuals. Because an individual’s coral consumption32 and fecundity33,34, and therefore its contribution
to population dynamics and the potential for irruptions28, increases with its size, removing larger individuals
from the population is important. The sooner these larger individuals are removed, the greater the reduction in
coral loss at the site will be, and, the greater the reduction in the site’s contribution to downstream dynamics and
impact will be. Second, the fact that, after just a small number of voyages, larger individuals had been removed
from a site and that, thereafter, most individuals culled were from the smaller and harder to find size classes,
points to generally low levels of immigration to sites post-control.
Combined, these findings indicate that strategic manual control at specific management locations removed
disproportionate numbers of the larger, more fecund, and more damaging COTS, and was effective in keeping
COTS densities below the ecologically sustainable level after five or more voyages to a site. This differential pat-
tern of removal of COTS of different sizes suggests that rapid re-visitation in the initial phases of control is key
to minimizing damage caused by these larger animals. Over the longer term, less frequent but regular visitation
would be required to remove recruiting and immigrant individuals. Realizing these benefits will be most effi-
ciently achieved by balancing re-visitation intervals to the minimum period that optimizes balance between the
availability COTS and the economics of re-visitation. The fact that no COTS are available at a site at the end of a
voyage but are available on subsequent voyages (an interval of ≥ 7 days) suggests that it is cycles in COTS behav-
iour, e.g. phases of active foraging and r esting31, that is influencing their availability at short and long timeframes.
Manual control improves hard coral cover. The ultimate objective of COTS control is not to kill star-
fish but rather, to protect live hard coral. Consequently, an important measure of the effectiveness of a control
program is the response of hard coral to control efforts. Our results indicate that manual control of COTS was
effective in achieving this goal. At the start of the Control Program in July 2013, average hard coral cover at the
52 sites was 26.8% ± 12 s.d. During the 4.5 years period, average coral cover increased by 17.6% ± 85 s.d., with
hard coral cover increasing at 25 sites (range: 0.35% to 305%) and decreasing at 27 sites (range: -85% to -3.2%).
Specifically, hard coral cover in the last voyage that a site was visited was significantly and positively related to the
number of control voyages to have visited that site previously (linear regression; R 2 = 0.17, F1, 50 = 10.08, P < 0.003,
Table S2). This response in hard coral cover is not explained by sites with higher initial hard coral cover being
visited more frequently by the Control Program (P = 0.73). In contrast, percent hard coral cover at fixed sites
not receiving control (surveyed as part of the AIMS’ Long-Term Monitoring Program) decreased to “historical
Scientific Reports | (2020) 10:12594 | https://doi.org/10.1038/s41598-020-69466-1 4
Vol:.(1234567890)www.nature.com/scientificreports/
Figure 3. The effect of number of control voyages on the density of Pacific Crown-of-Thorns Starfish (COTS),
Acanthaster cf. solaris, within four size classes. Manual control of COTS took place at a total of 52 sites at 21
reefs in three different types of spatial zoning in the Cairns sector of the Great Barrier Reef from July 2013 to
December 2017. The densities of the three largest size classes (> 15–25 cm, > 25–40 cm, and > 40 cm diameter)
show a sharp decline during the first four voyages, while densities of the smallest size class (< 15 cm diameter)
show a slight and longer-term reduction but remain relatively high. Dashed line = the ecologically sustainable
threshold for COTS outbreaks27, i.e. the density of COTS that can be sustained before coral cover is lost, Solid
bar = median, box = quartiles, whiskers = extremes, circles = outliers. Sample sizes can be found in Fig. 2.
Scientific Reports | (2020) 10:12594 | https://doi.org/10.1038/s41598-020-69466-1 5
Vol.:(0123456789)www.nature.com/scientificreports/
Figure 4. The effect of number of control voyages on the percentage change in hard coral cover to the end of
2017. Manual control of COTS took place at a total of 52 sites at 21 reefs in three different types of spatial zoning
in the Cairns sector of the Great Barrier Reef from July 2013 to December 2017. The proportional change in
hard coral cover at these 52 sites over the 4.5 year control period was significantly and positively related to the
number of voyages that visited these sites. That is, coral cover was not just maintained but actually increased as
the number of voyages increased. The horizontal dotted line represents no change in coral cover, the solid line
the regression equation (R2 = 0.19, F1, 50 = 11.99, P < 0.0011) and the dashed lines are the 95% confidence limits.
Colours indicate zoning: light blue = take zones, dark blue = limited take, green = no take.
lows”35 (see also Figure a) Benthic cover from fixed survey sites, Hard coral i n35) in the same period, with these
declines being at least in part attributed to the current COTS population outbreaks36. Interestingly, in reporting
on inshore coral reef surveys, Thompson, et al.37 noted that ongoing manual control of COTS at the Frankland
Islands between January 2017 and March 2018 had contributed to mitigating their impacts on coral loss.
Not only was the final absolute hard coral cover related to the effort invested in manual control at a site but the
proportional change in hard coral cover at a site relative to its initial cover across the 52 sites over the 4.5 years
period was significantly and positively related to the number of voyages that visited these sites (linear regres-
sion: R2 = 0.19, F1, 50 = 11.99, P < 0.0011; Fig. 4, Table S2). That is, coral cover was not just maintained but actually
improved as the number of control voyages increased. These findings indicate that strategic manual control at
specific management locations resulted in an average improvement in hard coral cover, with the proportional
change in hard coral cover increasing with the number of control visits to a site.
Though the effect of repeated manual control on live hard coral cover was significant, the amount of varia-
tion in the change in hard coral cover relative to initial cover it explained, ~ 20%, could be considered relatively
low. That it is of this order of magnitude, however, is not surprising as a multitude of factors, in addition to and
independent of COTS predation, influence coral cover dynamics at a site on the G BR15,38. De’ath, et al.15 estimated
that coral predation by COTS was responsible for 42% of the 50% decline in coral cover across the GBR over a
27-year period. This provides us with an initial upper estimate of the magnitude of the effect we might expect
from manual control. During this study, two mass bleaching events occurred in 2016 and 2 01716,39 with severe,
though spatially uneven impacts on coral cover in the Cairns Sector of the GBR18. It is reasonable to expect that
these additional, non-COTS related mortality factors would have had a significant influence on coral cover at
the 52 sites during our 4.5 year study and would have limited the amount of variation available to be explained
by manual control. Despite the operation of significant non-COTS drivers of hard coral cover during this study,
the signal of the effect of manual control of COTS control persisted. This indicates that its effect is strong with
manual control significantly improving outcomes for hard coral during a COTS population outbreak and mul-
tiple mass bleaching events.
Zoning influences initial COTS densities. The 52 sites at which manual control of COTS took place
were located in three different management zones, namely in Marine National Park (i.e. ‘no-take’) zones where
extractive use is prohibited (n = 26 sites); in Conservation Park (i.e. ‘limited-take’) zones where limited fish-
ing (excluding gill netting and trawling) and collecting are permitted (n = 10); and in Habitat Protection (i.e.
‘take’) zones where fishing and other harvest activities are permitted with the exception of trawling (n = 17) (see
“Methods—effect of marine protected areas” for more detail). Our initial analysis showed that at the start of the
Control Program in July 2013, hard coral cover did not differ among differently zoned sites (Welch one-way test,
F2,23.78 = 0.99, P = 0.383). In contrast, zoning did influence the density of COTS culled on the first voyage to a site
(Welch one-way test, F 2,29.6 = 5.95, P < 0.007, Fig. 5), with a higher COTS density in ‘take’ zones than in ‘limited-
take’ or ‘no-take’ zones (Games Howell post-hoc comparisons, P = 0.008 and P = 0.008, respectively). In addi-
tion, the number of control voyages to a site was not independent of zoning (Welch one-way test, F 2,28.92 = 8.65,
P = 0.0011), with sites located in ‘take’ zones tending to be visited less frequently than sites located in ‘limited-
take’ or ‘no-take’ zones (Games Howell post-hoc comparisons, P = 0.012 and P = 0.001, respectively). Given this
effect of zoning on the initial COTS densities encountered at a site (a dependent variable in our analyses) and
on frequency of visitation to a site (an independent variable in our analyses), further analyses examining the
Scientific Reports | (2020) 10:12594 | https://doi.org/10.1038/s41598-020-69466-1 6
Vol:.(1234567890)www.nature.com/scientificreports/
Figure 5. Median densities of COTS culled ha−1 when control began at site zoned with different levels of
protection. Colours indicate zoning: light blue = take zones, dark blue = limited take, green = no take. Solid
bar = median, box = quartiles, whiskers = extremes, circles = outliers.
combined effects of manual control and of zoning on changes in COTS densities and in hard coral cover was
conducted.
Combined effects of manual control and zoning on hard coral cover. The combined effects of
manual control and zoning on hard coral cover were examined for both the final coral cover at a site and for the
proportional change in hard coral cover at a site (i.e. final hard coral cover as a proportion of the initial hard
coral cover). First, absolute hard coral cover in the last voyage that a site was visited during the 4.5 year period
was influenced by initial hard coral cover (β = 0.04, P = 0.005) and the number of voyages to visit the site (β = 0.08,
P = 0.029), while the influence of increased protection through zoning reached only a trend (β = 0.45, P = 0.063)
(fixed effects model: R2 = 0.37, F3,48 = 9.455, P < 0.0005; Table S3). Second, proportional change in hard coral
cover over the 4.5 year period was not influenced by the zoning of a site (β = 0.06, P = 0.32), but did increase with
the number of voyages to visit the site (β = 0.022, P = 0.015) (fixed effects model: R2 = 0.21, F2,50 = 6.49, P = 0.003;
Table S3).
Zoning has been linked to a range of ecosystem benefits on the GBR40–42, as well as to the potential of a reef to
experience a COTS outbreak43–45. Our results provide some support for this conclusion: sites zoned with greater
protection, i.e. Marine National Parks and Conservation Park zones, had lower COTS densities than sites zoned
Habitat Protection at the start of the manual control. Zoning showed a near-significant and positive effect on
hard coral cover at the end of the study but was not a significant predictor of the proportional change in hard
coral cover. In short, while zoning contributed to the initial conditions at a site, its contribution over the period
of the Control Program was small relative to that of manual control. These results, and those of previous studies,
suggest that current zoning arrangements act a means of moderating the impact of an active COTS outbreak,
and that its role in a COTS Control Program will be as a complementary action used to support manual control
or where manual control cannot be employed. The management utility of observed zoning effects on COTS
populations is also compromised by the current lack of a mechanistic understanding of how such effects actually
occur; whether directly through predation by targeted fish s pecies46 or indirectly through cascading trophic or
behavioural effects, and whether the main effects are on the pelagic or settled phase or both34,47. Determining the
role of MPAs, and, in particular, the level of take of various fisheries on the GBR, on COTS densities and popula-
tion outbreaks is a focus of current work. Finally, it should be remembered that current zoning arrangements
were not designed with consideration of any influence of the spatial configuration of MPAs on COTS population
outbreaks. Hence, effects of MPAs may well be much larger if designed with COTS outbreaks in mind, e.g. by
protecting reefs that are identified as key nodes in COTS outbreak and spread p rocesses48, 49.
Efficacy of water quality improvement on COTS and hard coral cover. Finally, we compare our
results against the relative efficacy of water quality improvement in controlling CoTS population outbreaks across
the GBR and on reefs in the Cairns Sector up until December 2017. We first examine the scientific evidence for
improvements in the quality of water flowing from the catchments adjacent to the GBR as a whole because
water quality in the Cairns Sector is influenced by discharge from catchments well outside its boundaries50.
Progress towards improving GBR water quality, based on scientific monitoring and modelling published in peer-
reviewed technical reports51, has been reported upon annually since 2011 (Table S4a,b, S5)52–58. The most recent
GBR Report Card 201958 reports that none of the main agricultural land uses (sugar cane, grazing, horticulture,
grain) have achieved their 2018 target to manage 90% of land under best management practice (Table S4a). The
reported improvements in agricultural best management practice systems were used to model estimates of the
long-term annual river load reductions from 2009 to 201858. These estimates showed that the 2018 water quality
Scientific Reports | (2020) 10:12594 | https://doi.org/10.1038/s41598-020-69466-1 7
Vol.:(0123456789)www.nature.com/scientificreports/
targets for each of the key pollutants of concern, including those thought to influence COTS outbreaks (fine sed-
iment, dissolved inorganic nitrogen, particulate nitrogen, particulate phosphorus) have also not been achieved
(Table S4b). The marginal reductions in river pollutant loads are reflected in the lack of improvements, and in
some cases further decline, in measured water quality along the Wet Tropics coast (adjacent to the Cairns Sector)
since 2005 (see Sect. 5.2 and Fig. 5–31, 5,35, and 5–41 i n59). In particular, trends in chlorophyll-a concentrations
have been relatively stable and are currently at, or slightly exceeding, the current water quality guideline values60.
Finally, since 2009 the overall score for water quality on the GBR given in the seven annual report cards (based
on eReefs coupled hydrodynamic-biogeochemical model in the most recent report cards; see Supplementary
Material Text S3), has fluctuated between ‘poor’ and ‘moderate’ (Table S6)52–58. Combined, these measured and
modelled results point to slow, if any, progress having been made in achieving GBR water quality improvement,
including in the Cairns Sector26,61.
The lack of meaningful improvement, and in some cases further decline in measured GBR water quality since
the implementation of various Reef Plans starting in 200358,59, mean that the efficacy of water quality improve-
ments in reducing COTS population outbreaks and their impacts on hard coral cover are likely to be negligible.
This is borne out for the Cairns Sector and the GBR generally by the fact that the current COTS population
outbreak began in 2 0101, well after implementation of water quality improvement programs commenced in 2003,
and has since moved from further north, through the Cairns (this study) and adjacent Sectors, southward along
the GBR36,37. Not only did water quality improvement not prevent a COTS outbreak but hard coral cover in the
study region showed no improvement after its implementation. The AIMS Long Term Monitoring Program
reports that the trend in hard coral cover in the Cairns Sector at sites not receiving COTS control was a decline
to “historical lows” (Figure a) Benthic cover from fixed survey sites, Hard coral 35) in the period of this study.
Moreover, predation by COTS had contributed to reductions in coral cover on some inshore reefs in the Wet
Tropics region from 2012 to 2 01737.
These findings indicate there is little reason to expect that water quality improvement efforts have acted to
suppress COTS population dynamics, or that any such influence would be detected at this point in time. The
reductions in river pollutant loads (Table S4b) are sufficiently marginal to suggest that recent efforts to reduce
land-based pollution (Table S4a) are unlikely to protect GBR ecosystems from declining water quality26,62, includ-
ing lowering phytoplankton biomass and associated recruitment of COTS larvae1. This becomes particularly
evident when compared with the magnitude of change in land use and management required to obtain substantial
reductions in river pollutant loads to coastal receiving waters from international examples where measurable
improvements in coastal water quality have been achieved63. Hence, while water quality improvement may ulti-
mately prove efficacious in influencing COTS population dynamics and outbreaks, it cannot yet be solely relied
upon for COTS control in the GBR. Finally, further field observations linking larval abundance using eDNA64
and environmental factors, combined with laboratory experiments on the effects of different nutrient and feed-
ing regimes on juvenile COTS c ondition65, are needed to elucidate the role of catchment-derived nutrients in
driving COTS population outbreaks.
Conclusion
In the face of increasing and elevated COTS densities on reefs on the GBR, and the Indo-Pacific more generally,
the effectiveness of different management approaches in mitigating COTS population outbreaks needs to be
assessed, particularly in the context of enhancing reef resilience given the sustained and ongoing degradation of
coral reefs g lobally13,14. Our comparison of the three management approaches to COTS control used on the GBR
to date suggests the following three conclusions. First, there is little evidence that the water quality improvement
efforts have resulted in detectable changes in water quality on the GBR to date. While sustained action to improve
water quality will likely have important and far reaching benefits for the condition and resilience of the GBR, the
failure of efforts to date in achieving measurable improvements means that water quality interventions cannot
currently be solely relied upon for reducing COTS densities or population outbreaks. Second, the initial condi-
tions reported from a site were influenced by the extent to which it was protected from fishing; sites afforded the
greatest protection (i.e. zoned Marine National Park and Conservation Park) had fewer COTS at the outset than
did less protected sites (i.e. those zoned Habitat Protection). The influence of zoning on COTS densities, however,
was not significant at the end of the Control Program. Third, not only was strategic and repeated manual control
effective in reducing overall COTS densities and in skewing the population size structure towards smaller, less
damaging individuals, but in doing so it allowed recovery of hard coral cover, thereby directly achieving the
ultimate goal of COTS control.
Given the outcomes for hard coral cover reported here, the Control Program must be viewed as an important
tool in the context of managing the resilience of the GBR in the face of global environmental change, and, will
likely remain so for some time. As such, it stands alongside and supports other local management measures con-
sidered essential to reduce hard coral loss and conserve coral reef functionality in the hope that global warming
can eventually be contained. For example, recent modelling suggests that without COTS control management
interventions such as coral restoration using transplanted and engineered corals are unlikely to be successful66.
Until the effects of global environmental change can be stemmed and reversed, the GBR is likely to continue to
experience frequent bleaching, such as the episodes in 2016 and 2 01714 and predation of corals by COTS under
such conditions is certain to further reduce the system’s overall resilience. Hence, manual control currently
represents the only demonstrably effective means of addressing the threat posed by COTS and will continue to
be a key tool in supporting reef resilience into the future.
Scientific Reports | (2020) 10:12594 | https://doi.org/10.1038/s41598-020-69466-1 8
Vol:.(1234567890)www.nature.com/scientificreports/
Methods
Study area. The GBR extends over 2,000 km along the northeast coast of Australia, covering an area
of ~ 348,000 km2 including ~ 20,000 km2 of coral r eefs67. This study focuses on reefs in the Cairns Sector and in
particular on 52 sites at 21 reefs where both strategic manual control and Reef Health Impact Surveys (RHIS)
were conducted from July 2013 to December 2017 (Fig. 1). These sites and reefs were considered to be either
economically or ecologically important (see “Effect of manual control” below) and, were subjected to three dif-
ferent levels of protection (see “Effect of marine protected areas” below). The catchments discharging into and
influencing water quality in the Cairns Sector, including the Barron, Mulgrave-Russell, Johnstone, Tully, Herbert
and Burdekin rivers, have been the focus of long-term and extensive water quality improvement efforts68 (see
“Effect of water quality improvement”).
Effect of manual control. Data on COTS densities at the 52 control sites came from the COTS Control
Program. Funded by the Australian Government through the GBRMPA (Supplementary Text S1), the program’s
on water operations were conducted by the Association of Marine Park Tourism Operators (AMPTO) using
dedicated control vessels crewed by specially trained and experienced COTS control divers. Sites selected for
manual control were either sites that were economically important for tourism, or located on reefs that oceano-
graphic modelling suggested were highly connected to other reefs and, therefore, potentially significant in the
pattern of coral and COTS larval spread48. During the period covered by this study, sites and the pattern of
visitation were chosen by operators and the GBRMPA based on factors such as operational considerations, time
since last visit, and reports of COTS. Decisions were made annually with some modification during the year.
The sites included in this study were a sub-set of the total number of sites and included all sites which had a
permanent survey marker. This enabled accurate relocation of RHIS survey sites for repeated measures of coral
cover throughout the study period.
COTS control vessels undertook 10-day control voyages, during which selected reefs and specific sites on
those reefs, were dived. Each of the 52 sites included in this analysis were GPS mapped polygons with an average
size of 14 ha (± 13.6 s.d.). Each site was thoroughly searched on SCUBA and COTS were culled until no more
were available. When densities were high this required multiple dives, by multiple divers, during a single voyage.
Divers kept a tally of the number of COTS killed during each dive and the total number of COTS removed from
each site during a voyage was calculated as the sum of these tallies across dives and divers at a site.
In our analysis, we use the number of voyages to visit a site as our metric for control effort. We do this because,
during a voyage, dives continued at a site until COTS were no longer available to cull. Thus, the voyage represents
a standardized unit of management outcome at a site.
We used a COTS density of 3 ha−1 as our success threshold as this value was conservative estimate of a density
above which hard coral growth is estimated to be outpaced by predation (which based on the three largest size
classes is 5 COTS h a−1 at 20% coral cover)27 and the density at which fertilization, and therefore reproductive,
success is maximized (3 COTS h a−1)28. Sites where manual control reduced and maintained COTS densities to
below this threshold were sites where control was considered successful.
Reef health impact surveys. RHIS surveys are the standardized survey protocol used by the GBRMPA
for monitoring coral condition on the GBR67,69. RHIS surveys plots are circular with a radius of 5 m. Within
these plots observers estimate a range of coral health indicators including hard coral cover and the presence and
extent of a range of impacts, including COTS numbers. The method has been shown to be robust and an effective
means of assessing coral health69.
In this study data on coral cover at the 52 control sites came from RHIS surveys conducted by trained and
experienced observers who were either employees of the COTS Control Program or of the GBRMPA’s Joint Field
Management Program. At each site, three RHIS survey locations were distributed at roughly equal distances
across the site resulting in a total survey area per cull site of 2 35m2. Each RHIS point was permanently marked
with a steel picket to ensure the same area was surveyed in each survey. Percentage hard coral cover was visually
estimated and the percentage hard coral cover for each site was calculated as the mean percent hard coral cover
of the three RHIS plots at the site.
Effect of marine protected areas. The zoning, or degree of protection, for each of the sites (see “Effect
of manual control” below) was determined by reference to the GBRMPA’s zoning maps (Supplementary Text
S2)70. Twenty-six of the 52 sites were classified as Marine National Park or ‘no-take’ zones where extractive use is
prohibited, ten were classified as Conservation Park where limited fishing (excluding gill netting and trawling)
and collecting are permitted, and the remaining 17 were zoned as Habitat Protection where fishing and other
harvest activities are permitted with the exception of trawling25. For the purposes of this study we refer to these
three zoning categories as ‘no-take’, ‘limited-take’ and ‘take’ zones, respectively. To examine the effect of zoning
type on COTS numbers and coral cover at the 52 sites in the Cairns Sector, we included zoning category as a
co-variable in our analyses (see “Data analyses” below).
Data analyses. Our data analyses focused on determining whether the strategic manual control program
could have influenced COTS densities and coral cover at individual sites, alone and in combination with zoning.
We used ANOVA and linear mixed models to assess the influence on COTS densities of both zoning and manual
control. Mean hard coral cover at a site and change in hard coral cover between the first and last year a site was
visited expressed as a percentage of the initial hard coral cover, were the dependent variables. A site’s zoning and
the total number of voyages received were included as independent variables.
Scientific Reports | (2020) 10:12594 | https://doi.org/10.1038/s41598-020-69466-1 9
Vol.:(0123456789)www.nature.com/scientificreports/
Analyses were conducted using the R statistical software71. Assumptions for each analysis were tested as
appropriate. Normal Q-Q plots were used to assess normality and the dependent variable was square-root
transformed when necessary to meet this assumption. Visual inspection of the distribution of residuals relative
to fitted values and their leverage was used to assess assumptions of skewness, kurtosis, homoscedasticity and
the performance of the link function. These assessments were then confirmed using the gvlma package72 in R.
In the linear mixed models, potential spatial dependence between sites at the same reef was accounted for by
including the variable ‘reef ’ as a random effect with the other dependent variables included as fixed effects. The
lme4 package73 was used for linear mixed models, and the lmerTest package74 was used to test the significance
of random and fixed effects. The random effect ‘reef ’ was not significant in any of the models and fixed effect
models were ultimately used.
Effect of water quality improvement. To examine the effectiveness of management actions around
water quality improvement (Supplementary Text S3) to reduce COTS recruitment and population outbreaks,
we have relied on the annual report cards published by the Queensland and Australian governments since
201152–58, and the associated publicly-available scientific and technical publications on which they are based,
e.g.,37,59. These annual report cards measure progress towards the goals and associated water quality targets and
land management and catchment targets set for 2018 and 2020, as outlined in the two Reef Plans that have been
implemented to improve GBR water quality since 2009 (Table S4a,b, S5)26. To examine potential associated
changes in coastal water quality, in COTS densities and population outbreaks on coastal reefs, and in coral cover
on coastal reefs in the Cairns Sector, we have relied on reports from the Marine Monitoring Program Inshore
Water Quality Monitoring59 and Inshore Coral Reef Monitoring37.
Data availability
All data needed to evaluate the conclusions in the paper are present in the paper and/or the Supplementary
Information. Additional data related to this paper may be requested from the corresponding author.
Received: 24 February 2020; Accepted: 13 July 2020
References
1. Pratchett, M. S., Caballes, C. F., Rivera-Posada, J. A. & Sweatman, H. P. A. Limits to understanding and managing outbreaks
of crown-of-thorns starfish (Acanthaster spp.). Oceanogr. Mar. Biol. Annual Rev. 52, 133–200. https://doi.org/10.1201/b1714
3-410.1201/b17143-4 (2014).
2. Johnson, D. B., Moran, P. J. & Driml, S. Evaluation of a crown-of-thorns starfish (Acanthaster planci) control program at Grub
Reef (central Great Barrier Reef). Coral Reefs 9, 167–171. https://doi.org/10.1007/BF00258231 (1990).
3. Yamaguchi, M. Acanthaster planci infestations of reefs and coral assemblages in Japan: a retrospective analysis of control efforts.
Coral Reefs 5, 23–30. https://doi.org/10.1007/bf00302168 (1986).
4. Endean, R. Report on Investigations Made into Aspects of the Current Acanthaster planci (Crown of Thorns) Infestations of Certain
Reefs of the Great Barrier Reef (Queensland Department of Primary Industries (Fisheries Branch), Brisbane, 1969).
5. Pratchett, M. S. & Cumming, G. S. Managing cross-scale dynamics in marine conservation: pest irruptions and lessons from culling
of crown-of-thorns starfish (Acanthaster spp.). Biological Conservation (in review).
6. Zann, L. & Weaver, K. in Proceedings of the 6th International Coral Reef Symposium Vol. Vol. 2: Contributed Papers (eds J.H. Choat
et al.) (International Coral Reef Society, 1988).
7. Birkeland, C. & Lucas, J. S. Acanthaster planci: Major Management Problem of Coral Reefs (CRC Press, London, 1990).
8. Kenchington, R. & Kelleher, G. Crown-of-thorns starfish management conundrums. Coral Reefs 11, 53–56. https: //doi.org/10.1007/
bf00357422 (1992).
9. Walsh, R. et al. Report of the Committee on the problem of the crown-of-thorns starfish (Acanthaster planci L.). 45 (Common-
wealth Government Printing Office, Canberra, Australia, 1971).
10. Rivera-Posada, J., Pratchett, M. S., Aguilar, C., Grand, A. & Caballes, C. F. Bile salts and the single-shot lethal injection method
for killing crown-of-thorns sea stars (Acanthaster planci). Ocean Coast. Manag. 102, 383–390. https://doi.org/10.1016/j.oceco
aman.2014.08.014 (2014).
11. Westcott, D. A., Fletcher, C. S., Babcock, R. & Plaganyi-Lloyd, E. A Strategy to Link Research and Management of Crown-of-Thorns
Starfish on the Great Barrier Reef: An Integrated Pest Management Approach. Report to the National Environmental Science
Programme. 77 (Cairns, 2016).
12. Fletcher, C. S. & Westcott, D. A. Strategies for Surveillance and Control: Using Crown-of-Thorns Starfish management program
data to optimally distribute management resources between surveillance and control. Report to the National Environmental Sci-
ence Programme. 22 (Cairns, 2016).
13. Claar, D. C., Szostek, L., McDevitt-Irwin, J. M., Schanze, J. J. & Baum, J. K. Global patterns and impacts of El Nino events on coral
reefs: a meta-analysis. PLoS ONE 13, 22. https://doi.org/10.1371/journal.pone.0190957 (2018).
14. Hughes, T. P. et al. Spatial and temporal patterns of mass bleaching of corals in the Anthropocene. Science 359, 80. https://doi.
org/10.1126/science.aan8048 (2018).
15. De’ath, G., Fabricius, K. E., Sweatman, H. & Puotinen, M. The 27-year decline of coral cover on the Great Barrier Reef and its
causes. Proc. Natl. Acad. Sci. 109, 17995–17999. https://doi.org/10.1073/pnas.1208909109 (2012).
16. Hughes, T. P. et al. Global warming transforms coral reef assemblages. Nature 556, 492. https: //doi.org/10.1038/s41586 -018-0041-2
(2018).
17. Hughes, T. P. et al. Global warming and recurrent mass bleaching of corals. Nature 543, 373. https://doi.org/10.1038/nature2170
7 (2017).
18. Stuart-Smith, R. D., Brown, C. J., Ceccarelli, D. M. & Edgar, G. J. Ecosystem restructuring along the Great Barrier Reef following
mass coral bleaching. Nature 560, 92. https://doi.org/10.1038/s41586-018-0359-9 (2018).
19. Pratchett, M. S., Lang, B. J. & Matthews, S. Culling crown-of-thorns starfish (Acanthaster cf. solaris) on Australia’s Great Barrier
Reef: rationale and effectiveness. Aust. Zool. 40, 13–24 (2019).
20. Haywood, M. D. E. et al. Crown-of-thorns starfish impede the recovery potential of coral reefs following bleaching. Mar. Biol. 166,
15. https://doi.org/10.1007/s00227-019-3543-z (2019).
21. Bellwood, D. R. et al. Coral reef conservation in the Anthropocene: confronting spatial mismatches and prioritizing functions.
Biol. Cons. 236, 604–615 (2019).
Scientific Reports | (2020) 10:12594 | https://doi.org/10.1038/s41598-020-69466-1 10
Vol:.(1234567890)www.nature.com/scientificreports/
22. Kenchington, R. A. The Crown-of-thorns Crisis in Australia: a retrospective analysis. Environ. Conserv. 5, 11–20. https://doi.
org/10.1017/S0376892900005191 (1978).
23. Brodie, J. et al. 2013 Scientific Consensus Statement: Land use impacts on Great Barrier Reef water quality and ecosystem condition
(Reef Water Quality Protection Plan Secretariat, The State of Queensland, Brisbane, 2013).
24. Commonwealth of Australia. Reef 2050 Long-Term Sustainability Plan. (2015).
25. McCook, L. J. et al. Adaptive management of the Great Barrier Reef: a globally significant demonstration of the benefits of networks
of marine reserves. Proc. Natl. Acad. Sci. 107, 18278–18285. https://doi.org/10.1073/pnas.0909335107 (2010).
26. Kroon, F. J., Thorburn, P., Schaffelke, B. & Whitten, S. Towards protecting the Great Barrier Reef from land-based pollution. Glob.
Change Biol. 22, 1985–2002. https://doi.org/10.1111/gcb.13262 (2016).
27. Babcock, R., Plaganyi, E., Morello, E. B. & Rochester, W. What are the important thresholds and relationships to inform the man-
agement of COTS? Draft report, 30 June 2014. (CSIRO, Australia, 2014).
28. Rogers, J. G. D., Pláganyi É, E. & Babcock, R. C. Aggregation, Allee effects and critical thresholds for the management of the
crown-of-thorns starfish Acanthaster planci. Mar. Ecol. Progress Ser. 578, 99–114 (2017).
29. MacNeil, M. A. et al. Joint estimation of crown of thorns (Acanthaster planci) densities on the Great Barrier Reef. PeerJ 4, e2310.
https://doi.org/10.7717/peerj.2310 (2016).
30. Deaker, D. J. et al. The hidden army: corallivorous crown-of-thorns seastars can spend years as herbivorous juveniles. Biol. Lett.
https://doi.org/10.1098/rsbl.2019.0849 (2020).
31. Burn, D., Matthews, S., Caballes, C. F., Chandler, J. F. & Pratchett, M. S. Biogeographical variation in diurnal behaviour of Acan-
thaster planci versus Acanthaster cf. solaris. PLoS ONE 15, e0228796 (2020).
32. Keesing, J. K. Feeding Biology of the Crown-of-Thorns Starfish, Acanthaster planci (James Cook University, Linnaeus, 1990).
33. Kettle, B. T. & Lucas, J. S. Biometric relationships between organ indices, fecundity, oxygen consumption and body size in Acan-
thaster planci (L.) (Echinodermata; Asteroidea). Bull. Mar. Sci. 41, 541–551 (1987).
34. Babcock, R. C. et al. Assessing different causes of Crown-of-Thorns Starfish outbreaks and appropriate responses for management
on the great barrier reef. PLoS ONE 11, e0169048. https://doi.org/10.1371/journal.pone.0169048 (2016).
35. Australian Institute of Marine Science. Preliminary report on surveys of the Cairns sector of the Great Barrier Reef, (2019).
36. Australian Institute of Marine Sciences. Long-term Monitoring Program survey reports, (2019).
37. Thompson, A., Costello, P., Davidson, J., Logan, M. & Coleman, G. Marine Monitoring Program. Annual Report for inshore coral
reef monitoring: 2017 to 2018. 132 (Australian Institute of Marine Science, Townsville, 2019).
38. De’ath, G. & Fabricius, K. Water quality as a regional driver of coral biodiversity and macroalgae on the Great Barrier Reef. Ecol.
Appl. 20, 840–850. https://doi.org/10.1890/08-2023.1 (2010).
39. Hughes, T. P., Kerry, J. T. & Simpson, T. Large-scale bleaching of corals on the Great Barrier Reef. Ecology 99, 501–501. https://doi.
org/10.1002/ecy.2092 (2018).
40. Mellin, C., MacNeil, M. A., Cheal, A. J., Emslie, M. J. & Caley, M. J. Marine protected areas increase resilience among coral reef
communities. Ecol. Lett. 19, 629–637. https://doi.org/10.1111/ele.12598 (2016).
41. Yates, P. M., Tobin, A. J., Heupel, M. R. & Simpfendorfer, C. A. Benefits of marine protected areas for tropical coastal sharks. Aquat.
Conserv.-Mar. Freshw. Ecosyst. 26, 1063–1080. https://doi.org/10.1002/aqc.2616 (2016).
42. Castro-Sanguino, C. et al. Detecting conservation benefits of marine reserves on remote reefs of the northern GBR. PLoS ONE
12, 24. https://doi.org/10.1371/journal.pone.0186146 (2017).
43. Sweatman, H. No-take reserves protect coral reefs from predatory starfish. Curr. Biol. 18, R598–R599. https://doi.org/10.1016/j.
cub.2008.05.033 (2008).
44. Sweatman, H. & Cappo, M. Do no-take zones reduce the likelihood of outbreaks of the crown-of-thorns starfish? Report to The
NESP TWQ Hub. (2018).
45. Vanhatalo, J., Hosack, G. R. & Sweatman, H. Spatiotemporal modelling of crown-of-thorns starfish outbreaks on the Great Barrier
Reef to inform control strategies. J. Appl. Ecol. https://doi.org/10.1111/1365-2664.12710 (2016).
46. Kroon, F. J. et al. DNA-based identification of predators of the corallivorous Crown-of-Thorns Starfish (Acanthaster cf. solaris)
from fish faeces and gut contents. Sci Rep 10, 8184. https://doi.org/10.1038/s41598-020-65136-4 (2020).
47. Cowan, Z.-L., Pratchett, M., Messmer, V. & Ling, S. Known Predators of Crown-of-Thorns Starfish (Acanthaster spp.) and Their
Role in Mitigating, If Not Preventing, Population Outbreaks. Diversity 9, 7 (2017).
48. Hock, K. et al. Connectivity and systemic resilience of the Great Barrier Reef. PLoS Biol. 15, 23. https://doi.org/10.1371/journ
al.pbio.2003355 (2017).
49. Hock, K. et al. Controlling range expansion in habitat networks by adaptively targeting source populations. Conserv. Biol. https://
doi.org/10.1111/cobi.12665(2015).
50. Brinkman, R., Tonin, H., Furnas, M., Schaffelke, B. & Fabricius, K. Targeted analysis of the linkages between river runoff and risks
for crown-of-thorns starfish outbreaks in the Northern GBR. 47 (Australian Institute of Marine Science, Townsville, Australia,
2014).
51. Queensland Department of Environment and Science. Reef 2050 Water Quality Improvement Plan. Methods to create report card,
(2019).
52. Reef Water Quality Protection Plan Secretariat. Great Barrier Reef. First Report Card 2009 Baseline (Reef Water Quality Protection
Plan Secretariat, Brisbane, 2011).
53. Reef Water Quality Protection Plan Secretariat. Great Barrier Reef Report Card 2011. Reef Water Quality Protection Plan. 6 (Reef
Water Quality Protection Plan Secretariat, Brisbane, Australia, 2011).
54. Reef Water Quality Protection Plan Secretariat. Great Barrier Reef Report Card 2012 and 2013. Reef Water Quality Protection
Plan. 6 (Reef Water Quality Protection Plan Secretariat, Brisbane, Australia 2014).
55. Reef Water Quality Protection Plan Secretariat. Great Barrier Reef Report Card 2015. Reef Water Quality Protection Plan. 4 (Reef
Water Quality Protection Plan Secretariat, Brisbane, Australia, 2016).
56. Office of the Great Barrier Reef. Results Great Barrier Reef Report Card 2016. Reef Water Quality Protection Plan. 155 (2017).
57. Queensland Government. Great Barrier Reef Report Card 2014. Reef Water Quality Protection Plan, 8 (Queensland Government,
Brisbane, Australia, 2015).
58. Office of the Great Barrier Reef. Results Reef Water Quality Report Card 2017 and 2018. Reef 2050 Water Quality Improvement
Plan. 413 (2019).
59. Gruber, R. et al. Marine Monitoring Program: Annual Report for inshore water quality monitoring 2017–18. Report for the Great
Barrier Reef Marine Park Authority., 294 (Great Barrier Reef Marine Park Authority, Townsville, Australia, 2019).
60. Great Barrier Reef Marine Park Authority. Water quality guidelines for the Great Barrier Reef Marine Park. 109 (Townsville, 2010).
61. Waterhouse, J. et al. 2017 Scientific Consensus Statement: Land use impacts on Great Barrier Reef water quality and ecosystem
condition. Summary. 18 (Reef Water Quality Protection Plan Secretariat, Brisbane, Australia, 2017).
62. Queensland Audit Office. Follow-up of Managing water quality in Great Barrier Reef catchments (Report 16: 2017–18). 64 (Bris-
bane, Queensland., 2018).
63. Kroon, F., Schaffelke, B. & Bartley, R. Informing policy to protect coastal coral reefs: Insight from a global review of reducing
agricultural pollution to coastal ecosystems. Mar. Pollut. Bull. 85, 33–41 (2014).
Scientific Reports | (2020) 10:12594 | https://doi.org/10.1038/s41598-020-69466-1 11
Vol.:(0123456789)www.nature.com/scientificreports/
64. Doyle, J. R., McKinnon, A. D. & Uthicke, S. Quantifying larvae of the coralivorous seastar Acanthaster cf. solaris on the Great
Barrier Reef using qPCR. Mar. Biol. 164, 12. https://doi.org/10.1007/s00227-017-3206-x (2017).
65. Uthicke, S. et al. Effects of larvae density and food concentration on Crown-of-Thorns seastar (Acanthaster cf solaris) development
in an automated flow-through system (vol 8, 2018). Sci. Rep. 8, 2. https://doi.org/10.1038/s41598-018-27937-6 (2018).
66. Anthony, K. R. N. et al. Ecological modelling methods and findings - Reef Restoration and Adaptation Program. A report provided
to the Australian Government by the Reef Restoration and Adaptation Program. 124 (Townsville, Australia, 2019).
67. Great Barrier Reef Marine Park Authority. Great Barrier Reef Outlook Report 2014. (GBRMPA, Townsville, 2014)
68. The Great Barrier Reef Water Science Taskforce. Great Barrier Reef Water Science Taskforce, Final Report, Clean water for a healthy
reef. 94 (The Office of the Great Barrier Reef Department of Environment and Heritage Protection, Brisbane, Australia, 2016).
69. Beeden, R. J. et al. Rapid survey protocol that provides dynamic information on reef condition to managers of the Great Barrier
Reef. Environ. Monit. Assess. 186, 8527–8540. https://doi.org/10.1007/s10661-014-4022-0 (2014).
70. Great Barrier Reef Marine Park Authority. Great Barrier Reef Marine Park Zoning 2003 (GBRMPA), (2019).
71. R: A language and environment for statistical computing (R Foundation for Statistical Computing, Vienna, Austria, 2018).
72. Pena, E. & Slate, E. Global validation of linear model assumptions. J. Am. Stat. Assoc. 101, 341–354 (2006).
73. Bates, D., Maechler, M., Bolker, B. & Walker, S. Fitting linear mixed-effects models using lme4. J. Stat. Softw. 67, 1–48. https://doi.
org/10.18637/jss.v067.i01 (2015).
74. Kuznetsova, A., Brockhoff, P. B. & Runne, H. B. C. lmerTest package: tests in linear mixed effects models. J. Stat. Softw. 82, 1–26.
https://doi.org/10.18637/jss.v082.i13 (2017).
Acknowledgements
The Association of Marine Park Tourism Operators and the Great Barrier Reef Marine Park Authority provided
access to data and important contextual information about the field operations of the Control Program. The
work presented here developed from discussions with a broad range of researchers, reef managers and on-water
manual control operators, especially the contributors to the Crown-of-Thorns Working Group of the National
Environmental Science Program Tropical Water Quality Hub’s Crown-of-Thorns Integrated Pest Management
Program. This research was funded by Australian Government’s National Environmental Science Program
through its Tropical Water Quality Hub. We thank Dan Gladish for helpful critiques of previous versions of this
report and Adam McKeown for producing the map.
Author contributions
D.A.W. conceived and designed the study, conducted the analysis and wrote the paper. C.S.F. and F.J.K. contrib-
uted to the design, analysis and writing. R.C.B. and M.C.B. contributed to the analysis and writing. E.E.P. and
M.S.P. contributed to the writing.
Competing interests
The authors declare no competing interests.
Additional information
Supplementary information is available for this paper at https://doi.org/10.1038/s41598-020-69466-1.
Correspondence and requests for materials should be addressed to D.A.W.
Reprints and permissions information is available at www.nature.com/reprints.
Publisher’s note Springer Nature remains neutral with regard to jurisdictional claims in published maps and
institutional affiliations.
Open Access This article is licensed under a Creative Commons Attribution 4.0 International
License, which permits use, sharing, adaptation, distribution and reproduction in any medium or
format, as long as you give appropriate credit to the original author(s) and the source, provide a link to the
Creative Commons license, and indicate if changes were made. The images or other third party material in this
article are included in the article’s Creative Commons license, unless indicated otherwise in a credit line to the
material. If material is not included in the article’s Creative Commons license and your intended use is not
permitted by statutory regulation or exceeds the permitted use, you will need to obtain permission directly from
the copyright holder. To view a copy of this license, visit http://creativecommons.org/licenses/by/4.0/.
© The Author(s) 2020
Scientific Reports | (2020) 10:12594 | https://doi.org/10.1038/s41598-020-69466-1 12
Vol:.(1234567890)You can also read