The Role of Dietary Fibre in Modulating Gut Microbiota Dysbiosis in Patients with Type 2 Diabetes: A Systematic Review and Meta-Analysis of ...

Page created by Lester Watkins
 
CONTINUE READING
The Role of Dietary Fibre in Modulating Gut Microbiota Dysbiosis in Patients with Type 2 Diabetes: A Systematic Review and Meta-Analysis of ...
nutrients
Review
The Role of Dietary Fibre in Modulating Gut
Microbiota Dysbiosis in Patients with Type 2
Diabetes: A Systematic Review and Meta-Analysis of
Randomised Controlled Trials
Omorogieva Ojo 1, * , Qian-Qian Feng 2 , Osarhumwese Osaretin Ojo 3 and Xiao-Hua Wang 2
 1   School of Health Sciences, Faculty of Education, Health and Human Sciences, University of Greenwich,
     Avery Hill Campus, Avery Hill Road, London SE9 2UG, UK
 2   The School of Nursing, Soochow University, Suzhou 215006, China; 20195231027@stu.suda.edu.cn (Q.-Q.F.);
     wangxiaohua@suda.edu.cn (X.-H.W.)
 3   South London and Maudsley NHS Foundation Trust, University Hospital, Lewisham High Street,
     London SE13 6LH, UK; Osarhumwese.Ojo@slam.nhs.uk
 *   Correspondence: o.ojo@greenwich.ac.uk; Tel.: +44-20-8331-8626; Fax: +44-20-8331-8060
                                                                                                    
 Received: 24 September 2020; Accepted: 21 October 2020; Published: 23 October 2020                 

 Abstract: Background: The prevalence of type 2 diabetes is on the increase worldwide, and it
 represents about 90% of adults who are diagnosed with diabetes. Overweight and obesity, lifestyle,
 genetic predisposition and gut microbiota dysbiosis have been implicated as possible risk factors in
 the development of type 2 diabetes. In particular, low intake of dietary fibre and consumption of
 foods high in fat and sugar, which are common in western lifestyle, have been reported to contribute
 to the depletion of specific bacterial taxa. Therefore, it is possible that intake of high dietary fibre
 may alter the environment in the gut and provide the needed substrate for microbial bloom. Aim:
 The current review is a systematic review and meta-analysis which evaluated the role of dietary fibre
 in modulating gut microbiota dysbiosis in patients with type 2 diabetes. Methods: This is a systematic
 review and meta-analysis of randomised controlled trials which relied on the Preferred Reporting
 Items for Systematic Reviews and Meta-Analyses (PRISMA) framework. Electronic searches were
 conducted using EBSCOHost with links to Health Sciences Research Databases, EMBASE and Google
 Scholar. The reference lists of articles were also searched for relevant studies. Searches were conducted
 from date of commencement of the database to 5 August 2020. The search strategy was based on
 the Population, Intervention, Comparator, Outcomes, Studies (PICOS) framework and involved the
 use of synonyms and medical subject headings (MesH). Search terms were combined with Boolean
 operators (OR/AND). Results: Nine studies which met the inclusion criteria were selected for the
 systematic review and meta-analysis, and four distinct areas were identified: the effect of dietary fibre
 on gut microbiota; the role of dietary fibre on short-chain fatty acids (SCFAs); glycaemic control; and
 adverse events. There was significant difference (p < 0.01) in the relative abundance of Bifidobacterium
 with a mean difference of 0.72 (95% CI, 0.56, 0.89) between the dietary fibre group compared with
 placebo. In relation to the meta-analysis for SCFAs, while there was significant difference (p = 0.02)
 between the dietary fibre group and placebo with a standardised mean difference of 0.5 (95% CI,
 0.08, 0.91) regarding total SCFAs, the differences were not significant (p > 0.05) in relation to acetic
 acid, propionic acid and butyric acid. There was only significant improvement (p = 0.002) with
 respect to glycated haemoglobin with a mean difference of −0.18 (95% CI, −0.29, −0.06) between the
 dietary fibre group and placebo group. Differences between the two groups were not significant
 (p > 0.05) in relation to fasting blood glucose and homeostatic model assessment of insulin resistance
 (HOMA-IR). Furthermore, there were no significant differences between the two groups in subjects
 who reported adverse events. It is possible that the promotion of SCFA producers in greater diversity
 and abundance by dietary fibre in this review led to improvement in glycated haemoglobin, partly

Nutrients 2020, 12, 3239; doi:10.3390/nu12113239                              www.mdpi.com/journal/nutrients
Nutrients 2020, 12, 3239                                                                            2 of 21

 due to increased glucagon-like peptide-1 (GLP-1) production. In addition, Bifidobacterium lactis has
 been reported to increase glycogen synthesis, decrease expression of hepatic gluconeogenesis genes,
 improve translocation of glucose transport-4 and promote glucose uptake. It is also possible that the
 reduction in body weight of participants in the intervention group compared with control may have
 contributed to the observed improvement in glycated haemoglobin. Conclusion: This systematic
 review and meta-analysis have demonstrated that dietary fibre can significantly improve (p < 0.05)
 the relative abundance of Bifidobacterium, total SCFAs and glycated haemoglobin. However, dietary
 fibre did not appear to have significant effect (p > 0.05) on fasting blood glucose, HOMA-IR, acetic
 acid, propionic acid, butyric acid and adverse events.

 Keywords: type 2 diabetes; dietary fibre; gut microbiota; dysbiosis; short-chain fatty acids; glycated
 haemoglobin; fasting blood glucose; adverse events

1. Introduction
       The prevalence of type 2 diabetes is on the increase globally, and it represents about 90% of
adults who are diagnosed with diabetes [1,2]. The World Health Organisation [3] has reported an
increase from an estimated 108 million in 1980 to 422 million adults living with type 2 diabetes in 2014.
The prevalence of type 2 diabetes is predicted to reach 642 million by the year 2040 [4]. Diabetes as
a condition can have significant impact on mortality and morbidity including acute and long-term
complications [5]. There is evidence that diabetes is a major risk factor in the development of kidney
dysfunction, retinopathy, neuropathy and cardiovascular diseases [6]. Overweight and obesity, lifestyle,
genetic predisposition and gut microbiota dysbiosis have been implicated as possible risk factors in
the development of type 2 diabetes [6]. For example, low intake of dietary fibres and intake of foods
high in fat and sugar, which are common in western lifestyle, have been reported to contribute to the
depletion in the abundance of specific bacterial taxa and the diversity of gut microbial community [7].
It is possible that gut microbiota dysbiosis may influence the metabolic and functional pathways in the
gut which are involved in the development of type 2 diabetes [6].

2. Description of the Intervention
     An understanding of the pathophysiology of type 2 diabetes and the various management
approaches is crucial in reducing the risks of diabetes and its complications. In particular, the use
of dietary interventions including dietary fibre has been promoted by researchers and practitioners
involved in diabetes care and management. However, there appears to be inconsistencies in what is
considered to be a dietary fibre [8]. In 2008, the Scientific Advisory Committee on Nutrition (SACN) [9]
defined dietary fibre as non-starch polysaccharides (NSP). The definition of dietary fibre was revised
in 2015 to include all carbohydrates that are neither digested nor absorbed in the small intestine and
have some degree of polymerisation of three or more monomeric units and lignin [10]. Thus, the
components of dietary fibre include total fibre, NSP, fibre components from cereal, fruits and vegetables,
polydextrose, oligosaccharides (including fructo-oligosaccharides, galacto-oligosaccharides and inulin),
lignin and soluble fibres (including pectin and guar gum) [8–10]. According to Makki et al. [7], dietary
fibre can be subdivided into polysaccharides (NSP), resistant starch, and resistant oligosaccharides.
The subdivision can also be in the form of insoluble and soluble fibres [7].

3. How the Intervention Might Work
     There is evidence that diets play a significant role in modulating gut microbiota in terms of its
composition and in the production of short-chain fatty acids (SCFAs) [11]. However, our current
understanding of the exact relationships between the human gut microbiome and disease remains
limited [12]. It has been reported that the carbohydrates that are not digested and absorbed in the
Nutrients 2020, 12, 3239                                                                                3 of 21

small intestine undergo fermentation by the community of commensal bacteria in the colon, which
results in the formation of SCFAs, some of which are absorbed into the blood and used as sources
of energy [10,13]. The SCFAs are mainly acetic acid, propionic acid and butyric acid, and they also
regulate the host metabolism and inflammation [14]. SCFAs stimulate the secretion of gastric inhibitory
polypeptide (GIP), glucagon-like peptide-1 (GLP-1) and peptide YY (PYY) in adipocytes, leading to
reduced fat accumulation [14]. In addition, the micro-organisms that reside in the gastrointestinal
tract have been implicated in health and disease [11]. In relation to bacterial taxonomy of the human
gut microbiota, the four main phyla are Actinobacteria, Bacteroidetes, Firmicutes and Proteobacteria,
and these are essential for the host metabolism and physiological regulation [2,6,15]. The healthy
balance of the microbes in the gut (eubiosis) may be disrupted, leading to imbalance or impaired gut
microbiota distribution (dysbiosis), which have been shown to contribute to insulin resistance in type
2 diabetes [6,7]. For example, many factors such as diet, lifestyle, gut permeability have been known to
affect the composition of the gut microbiota [6].
      Poor dietary habits can lead to intestinal dysbiosis, such as alterations in the balance of the different
bacterial phyla, including overgrowth of Proteobacteria and/or reduction in Bacteroidetes [16]. There is
evidence that the proliferation of some bacteria species of the Proteobacteria phylum may lead to
energy disequilibrium among the different bacteria species, suppression of the growth of other bacteria
species and the development of diseases, including type 2 diabetes [16]. Therefore, the consumption of
high dietary fibre may alter the environment in the gut and provide the needed substrate for microbial
growth and proliferation, and the production of SCFAs [7]. SCFAs are essential sources of energy and
are involved in regulating host metabolism, immune system and the proliferation of cells [7]. SCFAs
can be used as sources of energy in the colonocytes, but can also be transported to the peripheral
circulation through the portal vein to the liver and peripheral tissues. Therefore, poor dietary fibre
consumption may not only reduce bacteria diversity in the gut, but also reduces SCFA production and
a shift towards the utilisation of less favourable substrates, such as dietary and endogenous protein
sources, by the gut microbiota [7]. The fermentation of proteins and amino acids by the microorganisms
in the gut can lead to reduced production of total SCFAs and butyrate as well as increased production
of cytotoxic and proinflammatory metabolites that contribute to the development of chronic diseases,
including type 2 diabetes [7].

4. Why It Is Important to Do This Review
     Although an association between higher intake of dietary fibre and reduced incidence of type 2
diabetes has been indicated, the results from different studies are not consistent [10]. Furthermore,
studies have revealed that non-digestible oligosaccharides may affect the community of bacteria that
make up the gut microflora, and their effect on health is an evolving area of research [10]. Previous
systematic reviews on gut microbiota and type 2 diabetes have focused on the broad subjects of
dietary and/or lifestyle interventions [17] or probiotics and faecal microbial transplantation [6] and not
primarily on dietary fibre. To our knowledge, we have not found any meta-analysis on the effect of
dietary fibre on gut microbiota in patients with type 2 diabetes.

4.1. Aim
     The current review is a systematic review and meta-analysis which evaluated the role of dietary
fibre in modulating gut microbiota dysbiosis in patients with type 2 diabetes.

4.2. Methods
     This is a systematic review and meta-analysis of randomised controlled trials which relied on the
Preferred Reporting Items for Systematic Reviews and Meta-Analyses (PRISMA) framework [18].

4.3. Types of Studies
      Only randomised controlled studies were included in this review.
Nutrients 2020, 12, 3239                                                                                4 of 21

4.4. Types of Participants
    The participants were people with type 2 diabetes, or in some studies, the control subjects did not
have type 2 diabetes.

4.5. Types of Interventions
      The interventions were dietary fibre including a macrobiotic diet.

4.6. Types of Outcome Measures
     The following were the outcome measures of interest:
     Relative abundance of gut microbiota (genera only): Bifidobacterium, Lactobacillus, Roseburia,
Bacteroides, Ruminococcus, and Clostridium.
     Short-chain fatty acids (SCFAs): total SCFA, acetic acid, propionic acid, butyric acid.
     Glycaemic parameters: glycated haemoglobin (HbA1c), fasting blood glucose (FBG), homeostatic
model assessment of insulin resistance (HOMA-IR).
     Adverse events: total adverse events, diarrhoea, bloating, constipation, abdominal pain.

4.7. Search Methods for Identification of Studies
     Electronic searches were conducted using EBSCOHost with links to Health Sciences Research
Databases (encompassing Academic Search Premier, MEDLINE, Psychology and Behavioral
Sciences Collection, APA PsycInfo, CINAHL Plus with Full Text and APA PsycArticles databases).
Other electronic databases searched were EMBASE and Google Scholar. The reference lists of articles
were also searched for relevant studies. Searches were conducted from date of commencement of
database to 5 August 2020. The search strategy was based on the Population, Intervention, Comparator,
Outcomes, Studies (PICOS) framework [19] involving the use of synonyms and medical subject headings
(MesH) (Table 1). Search terms were combined with Boolean operators (OR/AND). The searches were
conducted independently by two researchers (OO; OOO) and cross checked by the fourth researcher
(X.W.). Differences were resolved through consensus. Articles retrieved through the electronic database
searches were exported to EndNote (Analytics, Philadelphia, PA, USA) to remove the duplicates.

                                    Table 1. Search Terms and Search Strategy.

                                                    Outcome                                 Combining Search
 Patient/Population          Intervention                              Study Designs
                                                    (Primary)                                   Terms
     Patients with                                                      Randomised
                             Dietary fibre       Gut microbiota
       diabetes                                                        controlled trial
                                                                       #1 Randomised
                              Dietary fibre                          controlled trial OR
     Patients with
                               OR Dietary                             controlled clinical
  diabetes OR type 2
                              supplements                                  trial OR
     diabetes OR                               Microbiota OR Gut
                               OR Dietary                              randomized OR         Column 1 AND
     Diabetes OR                                microbiota OR
                            carbohydrate OR                           placebo OR drug        Column 2 AND
       Diabetes                                 Gastrointestinal
                           Polysaccharide OR                             therapy OR          Column 3 AND
   complications OR                             microbiota OR
                             Wheat bran OR                           randomly OR trial         Column 4
   diabetes mellitus,                             Microbiome
                                Fibre OR                                  OR groups
  type 2 OR diabetes
                             Supplement OR                           #2 “Animals” NOT
       mellitus
                                Prebiotics                                “Humans”
                                                                        #3 #1 NOT #2
Nutrients 2020, 12, 3239                                                                             5 of 21

4.8. Data Collection and Analysis

4.8.1. Selection of Studies
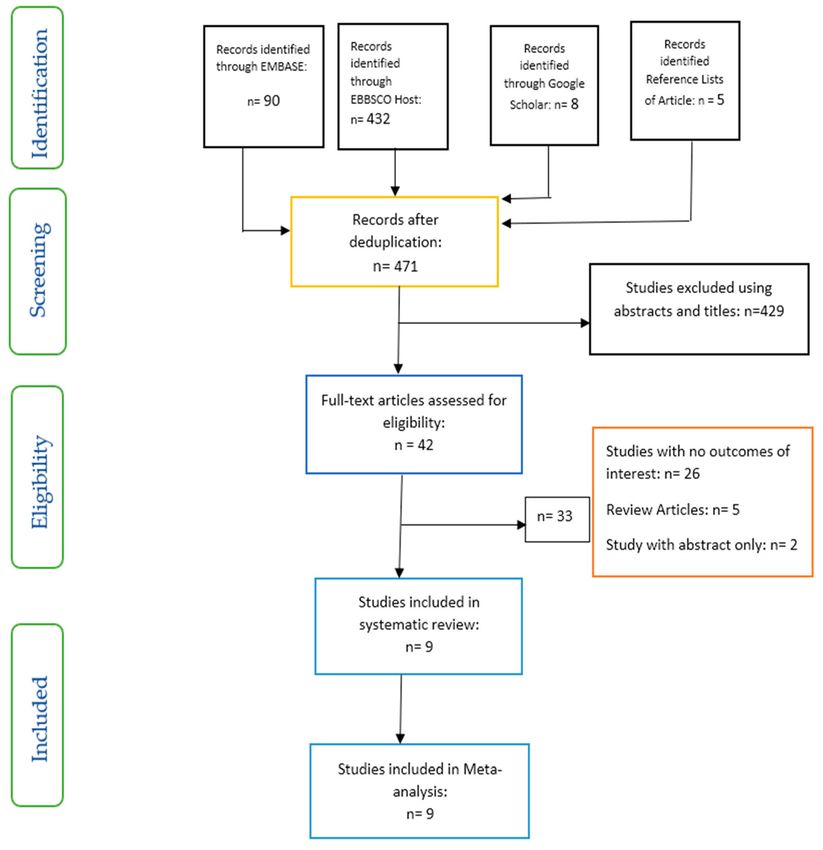
     Studies were included based on a set of inclusion and exclusion criteria and relied on the PRISMA
flow chart (Figure 1).

      Figure 1. Preferred Reporting Items for Systematic Reviews and Meta-Analyses (PRISMA) flow chart
      on selection and inclusion of studies.

     Inclusion criteria: studies selected were those involving patients with type 2 diabetes (in some
studies, patients without type 2 diabetes were used as control, however, the focus in these studies was
on the intervention involving only patients with type 2 diabetes); above 18 years of age; dietary fibre as
intervention; and gut microbiota, glycaemic parameters, short-chain fatty acids and adverse events as
outcomes of interest.
     Exclusion criteria: studies involving participants below 18 years of age, patients with type 1
diabetes, and pre-diabetes or gestational diabetes were excluded. Furthermore, studies involving
animal models and probiotics were also excluded.

4.8.2. Data Extraction and Management
     Data from the selected articles were extracted by two researchers (X.W.; Q-Q.F.) and cross-checked
by the other two researchers (OO; OOO). For the meta-analysis data, the authors of the selected articles
were contacted for the original data where possible. Changes from baseline for the intervention were
compared with the control in all the parameters analysed [20]. The Engauge Digitizer [21] was used to
Nutrients 2020, 12, 3239                                                                             6 of 21

extract data for the genus Bifidobacterium from the graphs in the studies of Medina-vera et al. [22]
and Pedersen et al [23]. Units of measurements were converted to mmol/L for fasting blood
glucose and percentage (%) for glycated haemoglobin and relative abundance of Bifidobacterium,
as necessary. Furthermore, median and 1st–3rd quartiles were converted to means and standard
deviations, respectively.

4.8.3. Assessment of Risk of Bias and Quality of Included Studies
      The risk of bias for the included studies was assessed using a domain based assessment
tool [20]. The domains evaluated included the random sequence generation (selection bias), allocation
concealment (selection bias), blinding of participants and personnel (performance bias), blinding of
outcome assessment (detection bias), incomplete outcome data (attrition bias), selective reporting
(reporting bias), and other bias [20]. The process was carried out using Review Manager 5.3 software [24].
In addition, the Critical Appraisal Skills Programme [25] checklist for randomised controlled trials was
used to assess the quality of the included articles.

4.8.4. Data Analysis
      The meta-analysis was carried out using Review Manager (RevMan) 5.3 software [24]. In addition,
sensitivity analysis was conducted by removing one study at a time from the meta-analysis in order
to assess the level of consistency of the results. The assessment of heterogeneity was by means of I2
statistic [20], and p < 0.10 was taken as the level of statistical significance of heterogeneity. The fixed
effects model and mean difference were used for the meta-analysis. However, for short-chain fatty
acids data, these were converted into standardised mean difference (SMD) due to the use of different
measurement scales in the outcome of interest and the random effects model was used for the analysis.

4.8.5. Effect Size
     The overall effect of the intervention in relation to statistical significance was based on p < 0.05,
and the results of the meta-analysis were presented as forest plots.

5. Results
     Nine studies which met the inclusion criteria were selected for the systematic review and
meta-analysis (Figure 1). The characteristics of the studies included are shown in Table 2. While three of
these studies were conducted in Italy [26–28], one study each was carried out in Norway [29], Japan [30],
Mexico [22], UK [23], Canada [31] and China [13]. All the studies were randomised controlled trials
with parallel design, except one which was a randomised cross-over study [29].
Nutrients 2020, 12, 3239                                                                                                                                                                 7 of 21

                                                         Table 2. The description and characteristics of included studies.

   Citation/Country of Study         Study Type          Sample Details        Mean Age (Years)                   Aim                     Interventions                   Results
                                                                                                                                      Inulin-type fructans
                                                                                                                                                               A daily supplement of
                                                                                                                                      (a mixture of
                                                                                                                                                               inulin-type fructans induced
                                Randomised, placebo                                                  To evaluate the prebiotic        oligofructose and
                                                                                                                                                               a moderate, but significant
   Birkeland et al. [29].       controlled,                                                          effect of inulin-type fructans   inulin) versus placebo
                                                      n = 25                  63.1 (41–73)                                                                     increase in faecal levels of
   Norway                       double-blind,                                                        on faecal microbiota and         (maltodextrin).
                                                                                                                                                               bifidobacteria, total SCFA,
                                cross-over study                                                     SCFA in patients with T2D.       A 4-week washout
                                                                                                                                                               acetic acid and propionic acid
                                                                                                                                      separated the 6 weeks
                                                                                                                                                               in patients with T2D.
                                                                                                                                      of treatment.
                                                                                                     To explore the potential of
                                                                                                     two different
                                                                                                                                                               The Ma-Pi 2 diet was
                                                                                                     energy-restricted dietary
                                                                                                                                                               associated with a greater
                                                                                                     approaches—the fibre-rich        Fibre-rich macrobiotic
                                Open-label                                                                                                                     reduction in FBG.
                                                      Ma-Pi 2 diet: n = 21;                          macrobiotic Ma-Pi 2 diet or a    Ma-Pi 2 diet versus
   Candela et al. [26]. Italy   randomised                                    66                                                                               Body weight changes (mean
                                                      Control diet: n = 19.                          control diet recommended by      control diet.
                                controlled trial                                                                                                               ± SD) kg:
                                                                                                     Italian professional societies   21 days of treatment.
                                                                                                                                                               Ma-Pi 2 diet: −5.6 ± −1.0
                                                                                                     for T2D treatment—to correct
                                                                                                                                                               Control diet: −2.7 ± −0.6
                                                                                                     gut microbiota dysbiosis in
                                                                                                     T2D patients.
                                                                                                                                                              GOS restored the abundance
                                                                                                     To assess the effects of GOS     Galacto-oligosaccharide
                                Randomized                                    GOS: 55 ± 11                                                                    of Bifidobacteriaceae.
                                                      GOS: n = 27;                                   on glycaemic control and gut     (GOS) versus placebo
   Gonai et al. [30]. Japan     controlled,                                   Placebo: 54 ± 12.                                                               However, GOS did not have
                                                      Placebo: n = 25.                               microbiotas and metabolites      (maltodextrin). Four
                                double-blind study                                                                                                            a significant effect on glucose
                                                                                                     in patients with T2D.            weeks of treatment.
                                                                                                                                                              tolerance.
                                                                                                                                                               DP consumption stimulated
                                                                                                                                                               the abundance of
                                                                                                                                                               Bifidobacterium longum
                                                      T2D: n = 81
                                                                                                                                                               shown to improve insulin
                                                      (randomised: 9
                                                                                                     To study the effects of a                                 sensitivity.
                                                      subjects from each
                                Single-centre,                                                       functional food-based dietary    A dietary portfolio      There were no significant
                                                      group discontinued
   Medina-Vera et al. [22].     placebo-controlled,                           DP: 50.4 ± 8.7         intervention on faecal           (DP) versus placebo.     differences in the levels of
                                                      study)
   Mexico                       randomised                                    Placebo: 49.8 ± 10.6   microbiota and biochemical       A 3-month treatment      glucose between groups.
                                                      final group numbers
                                double-blind                                                         parameters in patients with      period.                  Patients with T2D following
                                                      analysed:
                                                                                                     T2D.                                                      the DP showed significant
                                                      DF: n = 28
                                                                                                                                                               reductions in specific
                                                      Placebo: n = 25
                                                                                                                                                               biochemical parameters
                                                                                                                                                               compared with the placebo
                                                                                                                                                               group: AUCs for glucose.
Nutrients 2020, 12, 3239                                                                                                                                                                      8 of 21

                                                                                         Table 2. Cont.

   Citation/Country of Study        Study Type             Sample Details        Mean Age (Years)                     Aim                     Interventions                   Results
                                                                                                                                                                  Prebiotic fibre
                                                                                                          To compare the effects of
                                                                                                                                                                  supplementation had no
                                                                                                          prebiotic supplementation
                                                                                                                                                                  significant effects on clinical
                                                                                                          with placebo treatment for 12
                               Randomised,                                                                                                Galacto-oligosaccharide outcomes or bacterial
                                                                                                          weeks on glucose control,
   Pedersen et al. [23].       double-blind,            GOS: n = 14; Placebo:   GOS: 56.7 ± 1.6;                                          (GOS) versus placebo abundances compared with
                                                                                                          intestinal permeability,
   UK                          placebo-controlled       n = 15.                 Placebo: 58.1 ± 1.7.                                      (maltodextrin):         placebo.
                                                                                                          intestinal bacterial
                               parallel study                                                                                             12 weeks of treatment. Body weight changes (mean
                                                                                                          composition, and
                                                                                                                                                                  ± SEM) kg:
                                                                                                          endotoxaemia in patients
                                                                                                                                                                  GOS: 0.6 ± 0.1
                                                                                                          with T2D.
                                                                                                                                                                  Placebo: 0.1 ± 0
                                                                                                                                                                   The butyrate producer
                                                                                                                                                                   (Roseburia) was significantly
                                                                                                                                                                   increased in the PGX® group.
                                                                                                                                                                   Adding PGX® to a weight
                                                                                                          To examine the adjunct effect                            management program for
                               Placebo-controlled,
                                                                                                          of the soluble viscous fibre    PGX® versus              individuals with T2D
   Reimer et al. [31].         double-blind,            PGX® : n = 147          PGX® : 56.2 ± 8.6
                                                                                                          PolyGlycopleX® (PGX® ) on       placebo                  provides a sustained
   Canada                      randomised               Placebo: n = 143.       Placebo: 53.4 ± 9.9.
                                                                                                          glycaemic control in adults     52 weeks of treatment.   reduction in HbA1c
                               controlled study
                                                                                                          with T2D.                                                compared to placebo.
                                                                                                                                                                   Body weight changes: mean
                                                                                                                                                                   (95% CI) kg
                                                                                                                                                                   PGX® : −3.87 (−1.75 to −6.0)
                                                                                                                                                                   Placebo: −1.62 (0.56 to −3.80)
                                                                                                                                                                   There was significantly
                                                                                                                                                                   greater reduction in fasting
                                                                                                                                                                   blood glucose, HbA1c, and
                                                                                                          To evaluate the effect of
                                                                                                                                                                   insulin resistance in those
                                                                                Ma-Pi 2 diet: 67 ±        different dietary               Fibre-rich macrobiotic
                               Randomized                                                                                                                          patients receiving the Ma-Pi 2
   Soare et al. [27].                                   Ma-Pi 2 diet: n = 25;   8.163                     approaches—the macrobiotic      Ma-Pi 2 diet versus
                               controlled, open-label                                                                                                              diet compared with those in
   Italy                                                Control diet: n = 26    Control diet: 65 ±        Ma-Pi 2 diet compared with      control diet:
                               trial                                                                                                                               the control diet group.
                                                                                7.284                     standard diets recommended      21 days of treatment.
                                                                                                                                                                   Body weight changes (mean
                                                                                                          for patients with T2D.
                                                                                                                                                                   ± SD) kg
                                                                                                                                                                   Ma-Pi 2 diet: −4.9 ± 0.4
                                                                                                                                                                   Control diet: −3.97 ± 0.08
Nutrients 2020, 12, 3239                                                                                                                                                                        9 of 21

                                                                                       Table 2. Cont.

   Citation/Country of Study        Study Type             Sample Details        Mean Age (Years)                      Aim                      Interventions                   Results
                                                                                                                                                                     The Ma-Pi diet was
                                                                                                                                                                     associated with a higher
                                                                                                                                                                     percentage reduction in
                                                                                                          To investigate whether the
                                                                                                                                                                     HbA1c.
                               Randomized                                                                 benefits of the original 21-day   Fibre-rich macrobiotic
                                                                                                                                                                     The Ma-Pi diet resulted in
                               controlled, open-label                                                     intensive dietary                 Ma-Pi 2 diet versus
   Soare et al. [28].                                   Ma-Pi 2 diet: n = 17    Ma-Pi 2 diet: 65 ± 8.89                                                              greater improvement in
                               trial.                                                                     interventions extended            control diet:
   Italy                                                Control diet: n = 23.   Control diet: 64 ± 8.15                                                              glycaemic control.
                               6-month follow-up                                                          beyond the original MADIAB        6 months of
                                                                                                                                                                     Body weight changes:
                               study                                                                      trial duration and into           treatment.
                                                                                                                                                                     median (1st–3rd quartile) kg
                                                                                                          everyday life.
                                                                                                                                                                     Ma-Pi 2 diet: −1.46 (−4.59;
                                                                                                                                                                     0.78)
                                                                                                                                                                     Control diet: 0.72 (−2.4; 3.26)
                                                                                                                                                                     A select group of
                                                                                                                                                                     SCFA-producing strains was
                                                                                                                                                                     promoted by dietary fibres,
                                                                                                                                                                     and most other potential
                                                                                                          To characterise the dynamics
                               Randomized                                                                                                                            producers were either
                                                        High dietary fibre:     High dietary fibre:       of the gut microbiota and its     High dietary fibre
   Zhao et al. [13].           controlled trial,                                                                                                                     diminished or unchanged in
                                                        n = 27,                 58.4 ± 6.2.               impact on glucose                 versus control (usual
   China                       open-label,                                                                                                                           patients with T2D.
                                                        Control: n = 16.        Control: 59.7 ± 6.0;      homeostasis in patients with      care)
                               parallel-group study                                                                                                                  Body weight changes (mean
                                                                                                          T2D.
                                                                                                                                                                     ± SEM) kg:
                                                                                                                                                                     High dietary fibre: −2.99 ±
                                                                                                                                                                     −0.16
                                                                                                                                                                     Control: −1.09 ± −0.13
      Abbreviations: AUCs—areas under the curve; DP—dietary portfolio; FBG—fasting blood glucose; GOS—galacto-oligosaccharide; HbA1c—glycated haemoglobin; kg—kilogram;
      Ma-Pi 2—macrobiotic diet; PGX® —PolyGlycopleX® ; T2D—type 2 diabetes; SCFAs—short-chain fatty acids.
Nutrients 2020, 12, 3239                                                                                         10 of 21
Nutrients 2020, 12, x FOR PEER REVIEW                                                                         10 of 22

5.1. Risk of Bias in Included Studies
      The risks of bias in the included studies are shown in Figure 2a,b. Of the studies, 100% showed a
      Theof
low risk   risks
             biasofinbias in thetoincluded
                      relation     blindingstudies are shown
                                            of participants   inpersonnel,
                                                            and  Figure 2a,b. Of the studies,
                                                                           incomplete         100%
                                                                                        outcome    showed
                                                                                                 data,      a
                                                                                                       selective
low risk of bias in relation to blinding of participants and personnel, incomplete outcome data, selective
reporting and other potential sources of bias (Figure 2a). On the other hand, less than 75% of the
reporting and other potential sources of bias (Figure 2a). On the other hand, less than 75% of the studies
studies showed a low risk of bias in respect of blinding of outcome assessment, while less than 25% of
showed a low risk of bias in respect of blinding of outcome assessment, while less than 25% of the
the studies had a low risk of bias in terms of random sequence generation and allocation concealment.
studies had a low risk of bias in terms of random sequence generation and allocation concealment. All
All the studies included in this review demonstrated either a low risk of bias or an unclear risk of bias
the studies included in this review demonstrated either a low risk of bias or an unclear risk of bias in
in all the domains of assessment (Figure 2b).
all the domains of assessment (Figure 2b).

                                                         (a)

                                                        (b)

     Figure
     Figure 2.2. (a)(a)
                     Risk of bias
                        Risk      graph
                             of bias    for the
                                      graph  forincluded  studies.studies.
                                                  the included      (b) Risk of
                                                                             (b)bias
                                                                                 Risksummary
                                                                                       of bias for the included
                                                                                                summary     for the
     studies.
     included studies.
Nutrients 2020, 12, 3239                                                                                                  11 of 21

5.2. Effects
  Nutrients   of Interventions
            2020, 12, x FOR PEER REVIEW                                                                                  11 of 22

  5.2.Based
      Effectson  the systematic review and meta-analysis, four distinct areas were identified: the effect of
             of Interventions
dietary fibre on gut microbiota; the role of dietary fibre on short-chain fatty acids; glycaemic control;
       Based on
and adverse       the systematic review and meta-analysis, four distinct areas were identified: the effect of
              events.
  dietary fibre on gut microbiota; the role of dietary fibre on short-chain fatty acids; glycaemic control;
  andThe
5.3.   adverse
         Effect events.
                of Dietary Fibre on Gut Microbiota

  5.3.The
       The effects
            Effect ofofDietary
                         dietary  fibre
                                Fibre  ononGutgut  microbiota at the genus level are outlined in Table 3. According
                                                Microbiota
to Zhao et al. [13], the acetate-producing Bifidobacterium pseudocatenulatum was one of the most
        The effects of dietary fibre on gut microbiota at the genus level are outlined in Table 3. According
significantly promoted SCFA producers, and the enhancement of these positive responders reduced
  to Zhao et al. [13], the acetate-producing Bifidobacterium pseudocatenulatum was one of the most
the producers of compounds, such as indole and hydrogen sulphide, which could be metabolically
  significantly promoted SCFA producers, and the enhancement of these positive responders reduced
detrimental. There is evidence that patients with type 2 diabetes demonstrated intestinal dysbiosis based
  the producers of compounds, such as indole and hydrogen sulphide, which could be metabolically
on the presence of increased levels of Prevotella copri [22]. However, following dietary intervention
  detrimental. There is evidence that patients with type 2 diabetes demonstrated intestinal dysbiosis
with
  basedfunctional    foods, there
           on the presence             was a significant
                                  of increased       levels ofmodification      of the[22].
                                                                 Prevotella copri       faecal  microbiota
                                                                                              However,          compared
                                                                                                            following         with
                                                                                                                         dietary
control  diet  through     the  promotion      of  alpha   diversity   and   an increased    abundance
  intervention with functional foods, there was a significant modification of the faecal microbiota         of specific   bacteria,
independently
  compared withofcontrolantidiabetic     drugs [22].
                                diet through      the promotion of alpha diversity and an increased abundance of
      However,
  specific          Reimer
            bacteria,          et al. [31]offound
                        independently                 that the
                                               antidiabetic     abundance
                                                              drugs   [22].     of Lactobacillus spp. was greater in the
controlHowever,
         group, and      although
                     Reimer     et al.Faecalibacterium
                                        [31] found that prausnitzii
                                                            the abundance  increased   in both thespp.
                                                                                of Lactobacillus     dietary
                                                                                                           wasfibre   and in
                                                                                                                 greater   control
                                                                                                                              the
groups,   it was   more   profound      in the  control  group   (p =  0.038).  Furthermore,      there  was
  control group, and although Faecalibacterium prausnitzii increased in both the dietary fibre and control     a higher   level for
Collinsella
  groups, it spp.    in theprofound
               was more       dietary fibre    group
                                          in the        compared
                                                   control  group (pwith    control.
                                                                        = 0.038).      However, there
                                                                                  Furthermore,      there was
                                                                                                           werea no    significant
                                                                                                                    higher  level
  for Collinsella
differences   in alphaspp.orin   thediversity
                              beta     dietary [31].
                                                  fibre According
                                                         group compared         with et
                                                                      to Birkeland     control.
                                                                                         al. [29],However,      therefibre
                                                                                                   in the dietary       were   no
                                                                                                                            group,
there was moderate changes in the faecal microbiota composition (1.5%, p = 0.045), and the effect was
  significant   differences    in alpha    or beta   diversity  [31].  According    to Birkeland    et al. [29],  in the dietary
  fibreprominent
most    group, there  onwas    moderatetaxonomic
                          operational       changes inunits
                                                          the faecal
                                                                (OTUs)microbiota    compositionadolescentis,
                                                                          of Bifidobacterium        (1.5%, p = 0.045),   and theby
                                                                                                                     followed
  effectofwas
OTUs            most prominent on operational taxonomic units (OTUs) of Bifidobacterium adolescentis,
            Bacteroides.
  followed   by
      There was  OTUsno of   Bacteroides.
                          significant     effect on total bacteria, Lactobacillus, Roseburia, Enteroacteriaceae,
        There   was     no  significant
Clostridium leptum or Clostridium          effect   on totalgroups
                                                coccoides      bacteria,   Lactobacillus,
                                                                       following    prebioticRoseburia,     Enteroacteriaceae,
                                                                                                fibre treatment      in the study
  Clostridium     leptum    or  Clostridium
conducted by Pedersen et al. [23].               coccoides   groups    following   prebiotic   fibre  treatment     in the study
  conducted by Pedersen et al. [23].
      The meta-analysis of Bifidobacterium, which was the only genus we were able to extract data for,
        The meta-analysis of Bifidobacterium, which was the only genus we were able to extract data for,
involved two studies and 80 participants. There was significant difference (p < 0.01) in the relative
  involved two studies and 80 participants. There was significant difference (p < 0.01) in the relative
abundance of Bifidobacterium with a mean difference of 0.72 (95% CI, 0.56, 0.89) between the dietary
  abundance of Bifidobacterium with a mean difference of 0.72 (95% CI, 0.56, 0.89) between the dietary
fibre group compared with placebo (Figure 3).
  fibre group compared with placebo (Figure 3).

                               Figure3.3.The
                              Figure      Theeffect
                                              effect of
                                                     of dietary fibre on
                                                        dietary fibre on Bifidobacterium
                                                                         Bifidobacterium(%).
                                                                                         (%).
Nutrients 2020, 12, 3239                                                                                                                                                                      12 of 21

                                                         Table 3. The effect of dietary fibre on gut microbiota at the genus level.

              Citations               Bacteroides              Clostridium               Lactobacillus             Ruminococcus               Roseburia                 Bifidobacterium
                                    There was also a                                                                                                              A bifidogenic effect was most
                                    positive effect on                                                                                                            prominent, with the highest
        Birkeland et al. [29].        operational             Not Applicable            Not Applicable             Not Applicable           Not Applicable        positive effect on operational
                                   taxonomic units of                                                                                                              taxonomic units (OTUs) of
                                      Bacteroides.                                                                                                                Bifidobacterium adolescentis
                                  Both diets increased                                                               Both diets               Both diets
                                   the abundance of                                                                consolidated a           consolidated a
         Candela et al. [26].       propionate and            Not Applicable            Not Applicable              healthy-like             healthy-like                Not Applicable
                                  butyrate producers                                                               abundance of             abundance of
                                   (i.e., Bacteroides)                                                             Ruminococcus               Roseburia
                                                                                                                      Levels of
                                                                                                                  Ruminococcaceae                                       Bifidobacteriaceae
                                                                                                                  were significantly                              abundance was considerably
          Gonai et al. [30].        Not Applicable            Not Applicable            Not Applicable                                      Not Applicable
                                                                                                                 lower after intake of                             increased by intake of GOS
                                                                                                                 GOS compared with                                compared with the baseline.
                                                                                                                    the baseline
                                                                                                                                                                  DP consumption stimulated
       Medina-Vera et al. [22].     Not Applicable            Not Applicable            Not Applicable             Not Applicable           Not Applicable             the abundance of
                                                                                                                                                                   Bifidobacterium longum
                                                          Prebiotic treatment had
                                                                                      Prebiotic treatment                                                          Prebiotic treatment had no
                                                          no significant effect on                                                        Prebiotic treatment
                                                                                       had no significant                                                              significant effect on
         Pedersen et al. [23].      Not Applicable        Clostridium leptum or                                    Not Applicable          had no significant
                                                                                     effect on total bacteria,                                                    Bifidobacterium or any of the
                                                          Clostridium coccoides                                                           effect on Roseburia
                                                                                          Lactobacillus                                                              other bacteria measured
                                                                  groups.
                                                                                                                                          PGX® significantly
                                                                                                                                         increased the relative
          Reimer et al. [31].       Not Applicable            Not Applicable            Not Applicable             Not Applicable                                        Not Applicable
                                                                                                                                             abundance of
                                                                                                                                               Roseburia
           Soare et al. [27].       Not Applicable            Not Applicable            Not Applicable             Not Applicable           Not Applicable               Not Applicable
           Soare et al. [28].       Not Applicable            Not Applicable            Not Applicable             Not Applicable           Not Applicable               Not Applicable
                                                                                                                                                                        Bifidobacterium
                                                                                                                                                                  pseudocatenulatum was one
           Zhao et al. [13].        Not Applicable            Not Applicable            Not Applicable             Not Applicable           Not Applicable
                                                                                                                                                                    of the most significantly
                                                                                                                                                                   promoted SCFA producers
                                  Abbreviations: DP—dietary portfolio; GOS—galacto-oligosaccharide; PGX® —PolyGlycopleX® ; SCFA—short-chain fatty acid.
Nutrients 2020, 12, 3239                                                                                                       13 of 21
Nutrients 2020, 12, x FOR PEER REVIEW                                                                                          15 of 22

5.4.
5.4. The
     The Role
         Role of
              of Dietary
                 Dietary Fibre
                         Fibre on
                               on Short-Chain Fatty Acids
                                  Short-chain Fatty Acids
     In
      In the
          the study
               study by by Birkeland
                            Birkeland et  et al.
                                              al. [29],
                                                   [29], while
                                                          while the
                                                                  the intervention
                                                                        intervention (dietary
                                                                                            (dietary fibre)
                                                                                                         fibre) group
                                                                                                                  group showed
                                                                                                                           showed aa
significant  increase   in faecal   concentrations      of total SCFA     (p  = 0.04),   acetic
significant increase in faecal concentrations of total SCFA (p = 0.04), acetic acid (p = 0.02), acid   (p  =  0.02), and   propionicand
acid (p = 0.04)
propionic    acidas(pcompared       to control group,
                      = 0.04) as compared        to controlthere  was no
                                                              group,     theresignificant    difference difference
                                                                                 was no significant         in relation in to relation
                                                                                                                               butyric
acid between
to butyric   acidthe  treatments
                   between           (p = 0.19) or
                               the treatments      (pon   the overall
                                                       = 0.19) or on the microbial
                                                                              overall diversity
                                                                                        microbial[29]. diversity [29].
     In
      In terms of the relationship between microbiota and the SCFA (acetic,
         terms    of the  relationship     between      microbiota     and     the  SCFA      (acetic, propionic,
                                                                                                          propionic, butyric
                                                                                                                        butyric and and
valeric
valeric acid),
         acid),aageneral
                    generaltrend
                               trend was
                                       wasthat  acetic
                                             that        acidacid
                                                     acetic   waswas positively     related
                                                                           positively         to operational
                                                                                          related    to operationaltaxonomic      units
                                                                                                                          taxonomic
(OTUs)   that increased
units (OTUs)                with the
                  that increased        prebiotic
                                      with           fibre (Birkeland
                                            the prebiotic                  et al., 2020).
                                                              fibre (Birkeland        et al.,On2020).
                                                                                                 the other
                                                                                                         On thehand,   thehand,
                                                                                                                    other    oppositethe
trend  was   observed    for the   OTUs    that declined     with   the  prebiotic     treatment,
opposite trend was observed for the OTUs that declined with the prebiotic treatment, and              and   the  prebiotic    affected
                                                                                                                                     the
OTUs   of Bifidobacterium
prebiotic   affected OTUs ofadolescentis
                                   Bifidobacteriumwere negatively
                                                          adolescentis  related
                                                                           were to     butyric acid
                                                                                   negatively            [29].to butyric acid [29].
                                                                                                   related
     In  relation    to  the  meta-analysis        for  total  SCFAs,       two    studies
      In relation to the meta-analysis for total SCFAs, two studies were included and         were     included      and    involved
                                                                                                                        involved      95
95 participants
participants       (Figure
                (Figure     4a).
                          4a).  InIn  contrast,
                                    contrast,  3 3studies
                                                     studieseach
                                                              eachandand145 145participants,
                                                                                 participants,respectively,
                                                                                                   respectively, werewere included
                                                                                                                             included
in
in the
   the meta-analysis
        meta-analysis for for acetic
                               acetic acid,
                                       acid, propionic
                                              propionic acidacid and
                                                                  and butyric
                                                                         butyric acid
                                                                                    acid (Figure
                                                                                           (Figure 4b–d).
                                                                                                      4b–d). While
                                                                                                                While there
                                                                                                                         there was
                                                                                                                                 was aa
significant  difference   (p =   0.02) between      the  dietary  fibre   group    and    placebo   with
significant difference (p = 0.02) between the dietary fibre group and placebo with a standardised mean      a  standardised      mean
difference
difference ofof 0.5
                 0.5 (95%
                     (95% CI,
                            CI, 0.08,
                                 0.08, 0.91)
                                        0.91) with
                                              with respect
                                                       respect to
                                                                to total
                                                                    total SCFAs
                                                                            SCFAs (Figure
                                                                                      (Figure 4a),
                                                                                                4a), the
                                                                                                       the differences
                                                                                                             differences werewere notnot
significant   (p >  0.05) in relation    to acetic   acid  (Figure   4b),    propionic     acid  (Figure
significant (p > 0.05) in relation to acetic acid (Figure 4b), propionic acid (Figure 4c) and butyric acid   4c)  and  butyric     acid
(Figure
(Figure 4d).
          4d). Following
                Following sensitivity
                             sensitivity analysis,
                                            analysis, differences
                                                         differences between
                                                                         between the  the dietary
                                                                                            dietary fibre
                                                                                                       fibre group
                                                                                                               group and
                                                                                                                       and placebo
                                                                                                                              placebo
were
were only
       only significant
             significant(p (p == 0.04)
                                  0.04) for
                                        for propionic
                                             propionic acidacid and
                                                                 and butyric
                                                                       butyric acidacid when
                                                                                          when thethe study
                                                                                                        study of of Gona
                                                                                                                    Gona et et al.
                                                                                                                                al. [30]
                                                                                                                                    [30]
was  removed,     respectively,    from   the  meta-analysis      for
was removed, respectively, from the meta-analysis for each metabolite. each    metabolite.

                                                                  (a)

                                                                  (b)

                                                                  (c)

                                                                  (d)

      Figure
      Figure 4.4. (a)
                  (a) The
                      The effect
                           effectofofdietary
                                      dietaryfibre
                                               fibreonontotal short-chain
                                                          total short-chainfatty acids.
                                                                             fatty      (b)(b)
                                                                                   acids.    The effect
                                                                                               The      of dietary
                                                                                                    effect         fibre
                                                                                                           of dietary    on
                                                                                                                       fibre
      acetic acid.  (c) The effect of dietary  fibre on  propionic  acid. (d) The  effect of dietary fibre on butyric
      on acetic acid. (c) The effect of dietary fibre on propionic acid. (d) The effect of dietary fibre on butyric   acid.
       acid.
Nutrients 2020, 12, 3239                                                                                                          14 of 21
Nutrients 2020, 12, x FOR PEER REVIEW                                                                                             16 of 22

5.5. Glycaemic Control
      According
      According to  to Candela
                        Candela et   et al.
                                        al. [26],
                                            [26], when
                                                   when patients
                                                            patients with
                                                                        with type
                                                                               type 22 diabetes
                                                                                         diabetes werewere randomised
                                                                                                              randomised to    to follow
                                                                                                                                  follow
the
the high-fibre diet or the control diet, there was significant reduction of fasting blood glucose and
    high-fibre    diet   or  the  control    diet,   there   was   significant      reduction      of  fasting    blood   glucose     and
postprandial    blood      glucose    in  both    diet  groups.      However,       the   difference
postprandial blood glucose in both diet groups. However, the difference was significantly higher for      was    significantly    higher
for patients
patients      following
          following           the high-fibre
                        the high-fibre      diet diet   compared
                                                  compared       withwith
                                                                        thosethose    following
                                                                                following             the control
                                                                                              the control             dietIn
                                                                                                                diet [26].  [26].
                                                                                                                               the In  the
                                                                                                                                    study
study   by Soare   et  al. [27],  the  dietary    fibre  group    showed      a significantly
by Soare et al. [27], the dietary fibre group showed a significantly greater reduction in glycated greater     reduction    in  glycated
haemoglobin
haemoglobin (p   (p =    0.002) levels
                     = 0.002)      levels than
                                            than thethe control
                                                         control group.         Furthermore, Soare
                                                                     group. Furthermore,             Soare et et al.
                                                                                                                  al. [28]
                                                                                                                      [28] found
                                                                                                                            found thatthat
although   both   the   dietary    fibre and    control    diet  groups     maintained       their
although both the dietary fibre and control diet groups maintained their benefits beyond the 21     benefits     beyond    the   21 days,
                                                                                                                                     days,
the
the dietary
     dietary fibre
              fibre group
                       group resulted
                                 resulted in in greater
                                                  greater improvement
                                                             improvement in      in glycaemic
                                                                                     glycaemic control
                                                                                                     control following
                                                                                                                 following intensive
                                                                                                                               intensive
monitoring    over   a  6-month
monitoring over a 6-month period.    period.
      However,
      However,differences
                    differencesbetweenbetween  the the
                                                    intervention
                                                         intervention and control     groupsgroups
                                                                             and control          were not     significantly
                                                                                                             were               different
                                                                                                                    not significantly
with   respect
different   withtorespect
                     glucosetovariables
                                    glucose in      the study
                                                variables          conducted
                                                               in the               by Medina-Vera
                                                                          study conducted                     et al. [22]. etSimilarly,
                                                                                                   by Medina-Vera                al. [22].
at
Similarly, at 52 weeks, while patients with type 2 diabetes on intervention diet hadrelative
   52  weeks,  while    patients     with   type   2  diabetes    on  intervention       diet  had    a  greater    a greater reduction
                                                                                                                                 relative
in glycatedinhaemoglobin
reduction                         from baseline
                glycated haemoglobin             from(–3.19%)
                                                         baselinecompared          to control to
                                                                     (–3.19%) compared            group     (–0.57%)
                                                                                                      control               = 0.02); (p
                                                                                                                 group(p(–0.57%)       the=
differences  between the
0.02); the differences          groupsthe
                            between       were    not statistically
                                              groups                     significantsignificant
                                                         were not statistically         [31].          [31].
      In
      In terms of the meta-analysis, while 6 studies were included forfor
         terms   of   the   meta-analysis,        while    6  studies    were    included            fasting
                                                                                                 fasting    bloodblood   glucose
                                                                                                                    glucose     withwith
                                                                                                                                       508
508  participants    (Figure     5a),  glycated     haemoglobin         had   8 studies     with
participants (Figure 5a), glycated haemoglobin had 8 studies with 599 participants (Figure 5b), and 599   participants     (Figure    5b),
and  HOMA-IR
HOMA-IR       had had      5 studies
                     5 studies      withwith216216   participants
                                                  participants         (Figure5c).
                                                                    (Figure       5c).However,
                                                                                        However,there   there was
                                                                                                                was only
                                                                                                                      only significant
                                                                                                                             significant
difference  (p  =
difference (p = 0.002) with respect to glycated haemoglobin with a mean difference of −0.18
                   0.002)   with    respect   to  glycated     haemoglobin        with    a mean     difference     of          (95% CI,
                                                                                                                        −0.18 (95%      CI,
−0.29,  −0.06)between
−0.29, −0.06)    betweenthe    thedietary
                                    dietaryfibre
                                               fibregroup
                                                       group    and
                                                              and     placebo
                                                                   placebo        group
                                                                               group        (Figure
                                                                                         (Figure    5b).5b).    Differences
                                                                                                           Differences          between
                                                                                                                           between     the
the two   groups    were     not   significant     (p  >  0.05)  in  relation    to  fasting    blood
two groups were not significant (p > 0.05) in relation to fasting blood glucose (Figure 5a) and HOMA      glucose     (Figure    5a)  and
HOMA      -IR 5c).
-IR (Figure   (Figure      5c). Following
                    Following       a sensitivitya sensitivity
                                                      analysis, theanalysis,
                                                                        resultstheforresults
                                                                                       fastingfor bloodfasting    blood
                                                                                                            glucose    andglucose
                                                                                                                             HOMA-IR  and
HOMA-IR      did not However,
did not change.         change. However,          a difference
                                       a difference       between between      the dietary
                                                                        the dietary       fibrefibre
                                                                                                  groupgroup andandplacebo
                                                                                                                      placebowas was not
                                                                                                                                       not
significant     =
significant (p = 0.19) for glycated haemoglobin when the study of Soare et al. [27] was removed from
             (p    0.19)   for  glycated     haemoglobin        when     the  study   of   Soare   et   al. [27]  was   removed      from
the
the meta-analysis.
    meta-analysis.

                                                                   (a)

                                                                   (b)

                                                            Figure 5. Cont.
Nutrients 2020, 12, x3239
                      FOR PEER REVIEW                                                                                    15 of 22
                                                                                                                         17    21

                                                               (c)

      Figure 5. (a)
                 (a) The
                     The effect
                         effect of
                                of dietary
                                   dietary fibre
                                           fibre on fasting
                                                     fasting blood
                                                              blood glucose
                                                                      glucose (mmols/L).
                                                                               (mmols/L). (b)
                                                                                          (b) The
                                                                                              The effect
                                                                                                  effect of dietary
                                                                                                            dietary
      fibre on glycated haemoglobin (%). (c) (c) The
                                                 The effect
                                                      effect of
                                                             of dietary
                                                                dietary fibre
                                                                        fibre on homeostatic model assessment of
      insulin resistance (HOMA-IR).

5.6. Adverse
5.6. Adverse Events
              Events
      There were
      There were nonoadverse
                      adverseside
                                sideeffects
                                     effectsreported
                                              reportedbyby
                                                         thethe
                                                              participants in the
                                                                 participants     study
                                                                              in the     by Pedersen
                                                                                     study              et al.et[23].
                                                                                              by Pedersen         al.
Furthermore,    Gonai  et al. [30] observed    that  galacto-oligosaccharides    were  well-tolerated,
[23]. Furthermore, Gonai et al. [30] observed that galacto-oligosaccharides were well-tolerated,          andand no
participant
no           reported
    participant        anyany
                 reported    severe  adverse
                                severe  adverse events.
                                                  events.InInthe
                                                              thestudy
                                                                  studybybyReimer
                                                                            Reimer etet al.
                                                                                        al. [31],
                                                                                            [31], there
                                                                                                  there were
                                                                                                         were no no
significant  differences (p >  0.05) between     the two  groups   in subjects  who  reported
significant differences (p > 0.05) between the two groups in subjects who reported adverse eventsadverse   events
(Table 4).
(Table  4).
      Table 4. The most common adverse events reported over 52 weeks in participants allocated to PGX®
      Table 4. The most common adverse events reported over 52 weeks in participants allocated to PGX®
      or placebo.
      or placebo.
                                                                 ®(n ==103)
                                                           PGX ® (n    103)           Placebo (n = 104)
                                                           PGX                    Placebo (n = 104)
                      Total adverse
                         Total        events
                                 adverse   events               580
                                                                580                     525 525
                      Most common events:
                        Most common events:
                      Diarrhoea/loose stool                          150                         61
                        Diarrhoea/loose
                     Cold/flu-like symptoms  stool          150
                                                             56                    61 71
                       Cold/flu-like
                      Abdominal         symptoms
                                    bloating                 56
                                                             35                    71 29
                         Abdominal
                     Abdominal          bloating
                                  pain/cramps                35
                                                             35                    29 37
                          Constipation
                       Abdominal pain/cramps                 17
                                                             35                    37 48
                      Headache/sinus pain                    27                           45
                              Constipation                   17                    48
                           Abbreviations: PGX® —PolyGlycopleX® . Data from Reimer et al. [31].
                           Headache/sinus pain               27                    45
                        Abbreviations: PGX®—PolyGlycopleX®. Data from Reimer et al. [31].
6. Discussion
6. Discussion
     The results of this systematic review and meta-analysis have shown that there were significant
improvements
     The results (p  of <  0.05)
                        this       in glycated
                             systematic       review haemoglobin,      total SCFAs
                                                       and meta-analysis        have shownand the
                                                                                                thatrelative
                                                                                                       there wereabundance      of
                                                                                                                      significant
Bifidobacterium      in  the dietary    fibre   group   compared     with   the   control
improvements (p < 0.05) in glycated haemoglobin, total SCFAs and the relative abundance of  group.    In  contrast,  differences
between the two in
Bifidobacterium      groups    were not
                        the dietary     fibrestatistically significant
                                                group compared       with   > 0.05)
                                                                         (p the       in relation
                                                                                  control   group.to  Infasting  blood
                                                                                                         contrast,        glucose,
                                                                                                                     differences
HOMA-IR,      acetic  acid,  propionic       acid, butyric  acid   and  adverse     events.
between the two groups were not statistically significant (p > 0.05) in relation to fasting blood glucose,
     Some of
HOMA-IR,        the findings
              acetic             of this review
                      acid, propionic                wouldacid
                                             acid, butyric    appear
                                                                   andto   confirm
                                                                        adverse       the results of an earlier systematic
                                                                                    events.
review
     Someby of
             Houghton
                the findings et al.   [17]review
                                 of this     which would
                                                      assessed    the effectiveness
                                                              appear   to confirm theofresults
                                                                                             dietary     intervention
                                                                                                     of an                 on gut
                                                                                                             earlier systematic
microbiota   in   adults   with  type    2  diabetes.    Houghton     et al.  [17]  also  found
review by Houghton et al. [17] which assessed the effectiveness of dietary intervention on gut     significant   improvement
in glycatedinhaemoglobin
microbiota       adults with typein the     intervention
                                        2 diabetes.         group et
                                                       Houghton      compared
                                                                       al. [17] alsoto found
                                                                                        control,   but found
                                                                                               significant       no significant
                                                                                                              improvement      in
differences   (p  >  0.05)  between      the   two   groups   in  relation   to  fasting   blood
glycated haemoglobin in the intervention group compared to control, but found no significant        glucose,   HOMA-IR        and
in the relative
differences  (p >abundance
                    0.05) between  of Bifidobacterium.
                                       the two groups inThe         difference
                                                                relation           between
                                                                          to fasting    bloodthis    current
                                                                                                glucose,       review and
                                                                                                            HOMA-IR        andthe
                                                                                                                               in
review   by Houghton        et al.  [17]  with    respect  to  Bifidobacterium       may    be  due
the relative abundance of Bifidobacterium. The difference between this current review and the review   to  the type    of dietary
intervention,
by Houghtonwhich          waswith
                et al. [17]    primarily
                                     respectdietary    fibre in our review.
                                               to Bifidobacterium     may beHoughton
                                                                                  due to theet   al. [17]
                                                                                              type         observed
                                                                                                     of dietary        that there
                                                                                                                  intervention,
which was primarily dietary fibre in our review. Houghton et al. [17] observed that therefamily,
were  significant   changes    in   the gut   microbiota    at the  other  taxonomic      levels  including    phylum,       were
genus  and  species.    Fallucca    et al. [32]  have  also reported   that   the  Ma-Pi   2 diet
significant changes in the gut microbiota at the other taxonomic levels including phylum, family,  has  resulted   in significant
improvements
genus              in metabolic
        and species.      Falluccacontrol,
                                       et al. including
                                                [32] have fasting    blood glucose
                                                             also reported      that the andMa-Pi
                                                                                              glycosylated     haemoglobin
                                                                                                      2 diet has    resulted in in
patients with
significant      type 2 diabetes
             improvements          in in  different control,
                                       metabolic      continents.
                                                                including fasting blood glucose and glycosylated
haemoglobin in patients with type 2 diabetes in different continents.
Nutrients 2020, 12, 3239                                                                           16 of 21

      Although several studies have reported the association between dysbiosis and type 2 diabetes,
the results are often varied and inconsistent [6,33]. Dysbiosis has been reported to be positively
associated with plasma glucose levels and the occurrence of type 2 diabetes [34]. It has been found
that dysbiosis in the gut microbiota in patients with type 2 diabetes is characterised by a reduction
in biodiversity [15,17]. Ebrahimzadeh Leylabadlo et al. [6] have also noted the findings of previous
studies and demonstrated that type 2 diabetes was found to be associated with a reduction in the
proportion of Firmicutes. Furthermore, the microbiome is characterized by the reduction of several
butyrate-producing bacterial species including Clostridium, Eubacterium rectale, Faecalibacterium
prausnitzii, Roseburia intestinalis, Roseburia inulinivorans and an enrichment of opportunistic
pathogens [6]. The genera of Bifidobacterium, Bacteroides, Faecalibacterium, Akkermansia and
Roseburia have been negatively associated with type 2 diabetes, while the genera of Ruminococcus,
Fusobacterium, and Blautia have been positively associated with type 2 diabetes [35].
      The mechanism by which changes in the community of gut microbiota modulates metabolic
control is still evolving. However, a number of possible mechanisms have been documented including
altering levels of glucagon-like peptide-1, lipopolysaccharides, inflammation and SCFAs [17]. The role
of gut microbiota in type 2 diabetes involves microbial dysbiosis which harms the integrity of the
intestinal wall and allows the translocation of bacteria, lipopolysaccharides, a metabolic endotoxemia
from the gut lumen to the systemic circulation [2,36]. Furthermore, the endotoxemia causes low-grade
inflammation, autoimmunity, and oxidative stress, which may lead to beta cell destruction or insulin
resistance [2]. In other words, changes in the profile of gut microbiota cause gut permeability and
loss of energy homeostasis, which leads to endotoxemia, low-grade inflammation, hyperglycaemia,
hyperlipidaemia, obesity and insulin resistance [2,36]. Factors such as ethnicity, environment and
socio-economic variables may influence the community of gut microbiota in terms of their abundance
and diversity [15]. Other factors such as the use of broad spectrum antibiotics and changes in the
quality of the diet including reduction in dietary fibre consumption could lead to disequilibrium in the
community of gut microbiota [36]. Therefore, dysbiosis can elicit increased inflammatory activation
through an increase in immune response to lipopolysaccharides, and this process contributes to the
development of insulin resistance and type 2 diabetes [36].
      The gut microbiota has been reported to influence energy levels, blood glucose and the effectiveness
of pharmacological interventions [17]. While most of the insoluble fibres (e.g., cellulose and
hemicellulose) are not fully digested by the gut bacteria and thus have a faecal bulking effect,
most soluble fibres are fermented by the gut bacteria to produce metabolites, including SCFAs [7].
However, resistant oligosaccharides and most soluble NSPs are viscous and are able to form a gel
structure in the intestinal tract, which can delay absorption of glucose and lipids, thus regulating
post-prandial metabolism [7]. The gut microbiota and diet are two very useful components that keep
the integrity of the gut intact and the production of intestinal mucus [7]. Thus, reduced intake of
dietary fibre can lead to a reduction in the mucus layer and increase the risk of infection and the
development of chronic inflammatory disease [7].
      In the study by Candela et al. [26], which highlighted microbiota dysbiosis in patients with
type 2 diabetes in contrast to healthy subjects, both diets were found to be effective in modulating
gut microbiome dysbiosis in patients with type 2, leading to a bloom in ecosystem diversity in
health-promoting SCFA producers, such as Faecalibacterium, Roseburia, Lachnospira, Bacteroides
and Akkermansia. However, it was the high-fibre diet and not the control diet that was effective in
counteracting the increase in possible pro-inflammatory groups, such as Collinsella and Streptococcus
in the gut ecosystem and showing the potential to reverse pro-inflammatory dysbiosis in patients with
type 2 diabetes, and possibly explaining the greater efficacy in improving the metabolic control [26].
      In the current review, Gonai et al. [30] found that galacto-oligosaccharides (GOS) can ameliorate
dysbiosis in patients with type 2 diabetes, and the long-term use of GOS may be an effective strategy
for managing this condition. For example, while the abundance of Bifidobacteriaceae and the diversity
of intestinal microbiota were significantly lower in patients with diabetes than in healthy subjects,
Nutrients 2020, 12, 3239                                                                            17 of 21

Bifidobacteriaceae was significantly restored in patients with diabetes after consumption of GOS,
although glucose tolerance did not improve during the period [30]. With respect to the dietary fibre,
there was significant relationship between changes in gut microbiota components and changes in
biochemical parameters [26]. It is possible that the promotion of SCFA producers in greater diversity
and abundance by dietary fibre in this review led to improvement in glycated haemoglobin, partly due
to increased glucagon-like peptide-1 (GLP-1) production [13]. In addition, Bifidobacterium lactis has
been reported to increase glycogen synthesis, decrease expression of hepatic gluconeogenesis genes,
improve translocation of glucose transport-4 and promote glucose uptake [35]. It is also possible that
the reduction in body weight of participants in the intervention group due to the higher dietary fibre
content of the diet [28] compared with control may have contributed to the observed improvement
in glycated haemoglobin [31]. For example, in the study by Reimer et al. [31], at 52 weeks, only
the high-fibre group had a significant decrease in body weight. In addition, Zhao et al. [13] and
Soare et al. [27,28], found that the high-fibre group showed greater reduction in body weight than the
control group. Weight loss ranging from 5–10% has been reported to improve glycated haemoglobin
and obesity-related metabolic risk factors [31,37,38], while weight gain leads to deterioration in glycated
haemoglobin levels [31,39]. A number of studies have also demonstrated that the consumption of a
soluble, viscous fibre supplement can improve glycaemic control, including glycated haemoglobin in
patients with type 2 diabetes [40–42].
      The physico-chemical properties of dietary fibre are significant in influencing the function of the
gastrointestinal (GI) tract including digestion, nutrient bio-accessibility, microbial fermentation and
glycaemic control [43]. In addition, dietary fibre can have effect on the GI transit time and increased
digesta viscosity, which can affect the flow of food [40,43]. The relative amounts and proportions
of the components of dietary fibre such as cellulose, hemicellulose, pectin, lignin and water vary
depending on the botanical source and the maturity of the plant tissue [43]. These properties have a
significant effect on the physiology of digestion and gut function, including nutrient bio-accessibility,
rate of gastric emptying and transit time, inhibition of flow, mixing efficiency of digesta, effects of gut
microbiota and glycaemic control [43–45].
      It would appear that a number of mechanisms are involved in the physiological effects of dietary
fibre on macronutrient digestion, and the mechanism that predominates may be determined by a range
of factors, including polysaccharide composition, the physical state of the fibre source, whether the
fibre has been processed and the presence of other variables in foods such as lipids, which can also
influence gut function [43].
      Dietary fibres that are water soluble have been shown to reduce fasting plasma cholesterol in
human subjects by modifying bile salt metabolism [43,46]. Soluble fibres have also been reported to
lower plasma cholesterol levels by direct binding of polysaccharides to bile salts [43,47]. Another process
of improving glycaemic control with a soluble fibre supplement is by significantly increasing the
viscosity of chyme [40,48]. The increase in viscosity slows the interaction of enzymes and the nutrients,
and this slows the breakdown of complex nutrients into absorbable forms and slows the absorption of
glucose [40,47].
      However, a major mechanism that has been identified in the control of blood glucose in patients
with type 2 diabetes is the role of dietary fibre in physically encapsulating/entrapping nutrients,
thus slowing the rate of digestion of plant tissues and reducing the rise in blood glucose [43,49].
The structural integrity of plant tissue can also be affected by food processing, and this can influence
bio-accessibility and digestion [43]. For example, it has been reported that starch that is encapsulated
with a leguminous cell is protected from digestion in the small intestine and produces a low glucose
response compared to non-encapsulated starch [43].
      The ranking of different carbohydrate foods can also be based on their glycaemic index [50,51].
Therefore, foods that have low glycaemic index, such as lentils, beans and oat, provide gradual supply
of glucose to the blood and thus ensure a more sustained insulin release [50]. Soluble fibre is closely
You can also read