The Health and Behavioural Effects of Individual versus Pair Housing of Calves at Different Ages on a UK Commercial Dairy Farm - MDPI
←
→
Page content transcription
If your browser does not render page correctly, please read the page content below
animals
Article
The Health and Behavioural Effects of Individual versus Pair
Housing of Calves at Different Ages on a UK Commercial
Dairy Farm
Sophie A. Mahendran * , D. Claire Wathes                       , Richard E. Booth and Nicola Blackie

                                          Royal Veterinary College, Pathobiology and Population Sciences, Hawkshead Lane, Hatfield,
                                          Hertfordshire AL9 7TA, UK; dcwathes@rvc.ac.uk (D.C.W.); rbooth@rvc.ac.uk (R.E.B.); nblackie@rvc.ac.uk (N.B.)
                                          * Correspondence: smahendran@rvc.ac.uk; Tel.: +44-7784137841

                                          Simple Summary: The way in which dairy calves are housed can have a significant impact on
                                          their health and productivity. This study compared three different housing groups from birth to
                                          weaning; individual housing, pair housing from birth, and pair housing from three weeks of age.
                                          Newborn Holstein heifer calves (n = 100) were recruited over a six-month summer period from
                                          a single commercial dairy farm in the UK. Each calf had a weekly visit by the researcher over a
                                          10-week period, where they were weighed and assessed for the presence of disease, along with
                                          measuring solid feed intake and the time to approach a novel object. Other management aspects
                                          including milk allocation were the same across groups. There was no effect of the housing group on
                                          average daily liveweight gain (ADLG), the presence of disease or the time taken to approach a novel
                                          object. The housing group did impact solid feed intake, with calves pair housed at either time period

                                   ingesting significantly more than individually housed calves. This study demonstrated that there
Citation: Mahendran, S.A.; Wathes,
                                          were no detrimental effects on the health or growth of calves housed in pairs, with the added benefit
D.C.; Booth, R.E.; Blackie, N. The        of increased solid feed intake for pair housed calves, which is important for a smooth transition over
Health and Behavioural Effects of         the weaning period.
Individual versus Pair Housing of
Calves at Different Ages on a UK          Abstract: Housing management of dairy calves is one of the factors that contributes to a successful
Commercial Dairy Farm. Animals            rearing outcome. Individual housing of pre-weaned calves is thought to provide enhanced biose-
2021, 11, 612. https://doi.org/           curity and easier monitoring of the individual, and so remains prevalent in the UK. Behavioural
10.3390/ani11030612                       studies have, however, found that pair housing is important for social learning, with positive
                                          impacts on health and welfare. This study utilised a single UK commercial dairy farm to establish if
Academic Editor: Ingrid Lorenz
                                          individual housing, pair housing from birth, or pair housing from three weeks of age affected health
                                          and behavioural parameters. Calves were housed in these allocated groups from birth to eight weeks
Received: 29 January 2021
                                          of age, when they were moved into group pens of five calves for weaning at 10 weeks of age. All man-
Accepted: 20 February 2021
Published: 26 February 2021
                                          agement routines other than the housing group were the same for enrolled calves. One hundred
                                          Holstein calves were recruited over a six-month period, and systematically allocated to a housing
Publisher’s Note: MDPI stays neutral
                                          group. Weekly visits were conducted up to 10 weeks of age (weaning) for each calf, with weight, solid
with regard to jurisdictional claims in   feed intake, and presence of clinical disease measured. In addition, a novel object approach test
published maps and institutional affil-   was carried out at six weeks, and a thoracic ultrasound was performed at seven weeks. Housing
iations.                                  group had no effect on the average daily liveweight gain (ADLG) (p = 0.74), with an average
                                          of 0.66 kg/day over the pre-weaning period. However, on group housing at 8–10 weeks of age,
                                          there was a numerical increase in ADLG in the pair housed calves compared to the individually
                                          housed calves over the weaning period. Housing group had no significant effect on disease preva-
Copyright: © 2021 by the authors.         lence (p = 0.98) or the time taken to approach the novel object (p = 0.29). However, pair housed
Licensee MDPI, Basel, Switzerland.        calves had increased mean total solid feed intakes from weeks 2–8 (p = 0.011), with 6.2 ± 0.67 kg
This article is an open access article    (standard error of the mean—SEM), 12.7 ± 0.73 kg and 13.6 ± 0.70 kg ingested by individually
distributed under the terms and           housed, pair housed from birth and pair housed from three weeks of age, respectively. The overall
conditions of the Creative Commons        findings of this study indicate that within a UK commercial dairy management system, there is no
Attribution (CC BY) license (https://
                                          detrimental effect of housing calves within pairs (either from birth or three weeks of age) compared
creativecommons.org/licenses/by/
                                          to individual housing.
4.0/).

Animals 2021, 11, 612. https://doi.org/10.3390/ani11030612                                                  https://www.mdpi.com/journal/animals
Animals 2021, 11, 612 2 of 14
Keywords: calf; housing; individual; pair; growth rate; feed intake; novel object
1. Introduction
Rearing dairy heifer calves capable of reaching their genetic potential for milk pro-
duction requires excellent health along with good growth rates in order to achieve target
ages for optimum first service and first calving. Heifers must then be sufficiently robust
to thrive in the milking herd, but at present up to 19% of heifers in the UK leave the herd
during their first lactation [1]. There are many management factors that contribute to
successful rearing outcomes during the crucial pre-weaning period, with the main ones
being colostrum protocols [2], nutritional regimens [3], and housing management [4].
Many calf housing recommendations over the previous two decades have focused on
individual housing during the pre-weaning period, with reports of approximately 60% of
UK herds using individual pens [5]. One of the main reasons for this was the perceived
reduction in risk of transmission of enteric pathogens by faeco-oral transmission [6], and re-
duced risk of aerosol spread of respiratory pathogens [7]. In addition to lower disease
prevalence, there were also perceptions of higher weight gains and reduced problems
from cross-sucking for calves in individual pens [8]. However, these views have not been
supported by more recent studies that have shown no difference in enteric or respiratory
pathogen spread among pair housed calves [9].
Other studies have demonstrated the importance of social facilitation and social
learning, whereby calves initiate specific behaviours (such as eating concentrates) while
observing others engaged in that behaviour [10], and are thus influenced by observation or
interaction with another individual [11]. This is borne out in behavioural studies, with pair
housed calves spending more time at the feeder, visiting the feeder more often, and starting
to ingest concentrate more rapidly than individually housed calves [12]. This then translates
into improved weight gains in pair housed calves [12,13], which continue after the weaning
period [14]. The presence of another calf also has a calming effect on behavioural responses
in stressful situations [15–17], with individually reared calves shown to be more fearful
when introduced to a novel social situation and when isolated in a novel arena [18,19].
On the other hand, pair housed calves have shown higher behavioural flexibility, being
able to modify their behaviour in response to a changing environment such as mixing with
unfamiliar calves [12]. This is thought to have long-term positive benefits that can translate
into improved social skills as an adult cow in the milking herd [20].
The positive impact that pair housing has demonstrated on calf behaviour has shown
varying dependency on the age at which the pairing began. Costa et al. [21] compared
calves that were transferred from individual to pair housing at one week compared to
six weeks of age, and found that the benefits of increased weight gain were only seen in
the early-paired calves (0.89 vs. 0.73 kg/day). Duve and Jensen [22] examined the social
behaviour of calves housed in pairs from birth compared to at three weeks of age, and found
only minor differences in lying down times, with all other monitored behaviours (sniffing,
licking, social contact, and play) demonstrating similar levels. This is also supported by
Jensen et al. [9] who found that there was no difference in behavioural responses to a novel
environment or exposure to a new calf between animals pair housed from birth compared
to two weeks of age [9]. This suggests that social contact in the first few weeks of life are
not essential for development of beneficial behavioural responses later in life [9].
Another area that impacts calf management is the public perception associated with
different types of calf housing. In a survey comparing public opinions, over 75% of
participants found group housing to be the most acceptable way to keep calves (compared
to pair and individual housing), with their main reasons being that they thought it avoided
isolation and provided more space [23]. The survey also found that the participants thought
that pair housed calves had better opportunities for socialization and play interactions
than individually housed calves [23].Animals 2021, 11, 612 3 of 14
Much of the body of evidence supporting the benefits of pair housing calves originates
predominantly from research institutions (not commercial dairy units) that fed larger
volumes of milk (between 10 L to ad-lib) [24] than are typically seen on many UK dairy
farms [25]. They also often utilized bull calves, and calves were housed under different
environmental (weather) conditions to those found in the UK. The aim of this study was to
establish the effect of individual and pair housing at different ages on a commercial dairy
farm, under environmental conditions and management practices more representative of
the UK dairy sector.
2. Materials and Methods
2.1. Animals and Housing
This study was conducted on a single commercial dairy farm in the South-West of
England, milking 550 Holstein dairy cows in an all year round calving pattern. A total
of 100 heifer calves were recruited from March to August 2020, with all work conducted
following social distancing guidelines. Calves were born in a loose housed straw yard,
and were provided with two 3 L colostrum feeds from their own dam within 12 h of birth
via an oesophageal feeding tube (quality was not measured). Calves were then transported
to the rearing area and housed outdoors in commercially available calf hutches (Calf-Tel® ,
Hampel Corporation, Germantown, WI, USA) with internal hutch dimensions of 2.2 m
long × 1.22 m wide × 1.38 m high.
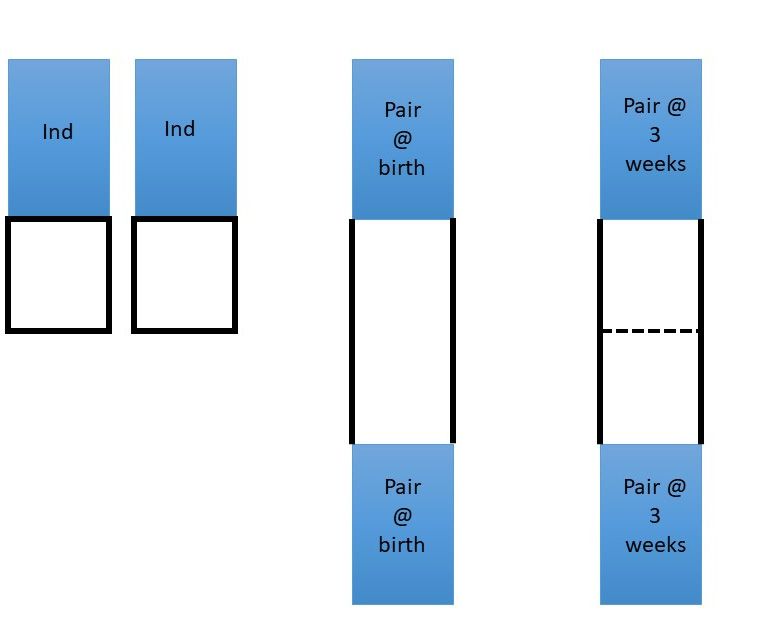
Three different pre-weaning housing systems were compared: (a) individual housing
(n = 20), (b) pair housing from birth (n = 40) or (c) individual housing for the first three
weeks, then subsequent pair housing (n = 40), with the layouts illustrated in Figure 1. (a)
Individually housed calves were placed in a single hutch, with a wire mesh outdoor area
measuring 1.5 m long × 1.22 m wide. These pens were arranged side by side, so that the
calves could only see each other when in the outside area. They could, however, touch
their neighbour if they placed their heads over the wire partitions. (b) Pair housed calves
were provided with two hutches per pair, with the hutches facing each other and two 3 m
gates between them used to make an outdoor area. (c) Calves paired at three weeks of age
were initially housed in individual hutches, arranged as in (b) but with the outdoor area
split by an internal gate. The pair were subsequently combined by removal of this internal
gate (Figure 2). At eight weeks of age, all calves were moved from their allocated housing
type into groups of five calves in group hutches, where they stayed until after weaning (at
10 weeks of age).
Calves born between March and May were systematically allocated at birth into
housing groups (a) or (b). From April to August, all calves were allocated to group (c).
The difference in recruitment time was due to expansion of the original study design,
triggered by a changed management requirement imposed by some UK milk buyers which
stipulated pair housing of calves at three weeks of age. All three groups were, however,
born during the relatively warm spring/summer seasons. The effect of these different
recruitment times was included in all the final models to check for potential confounding,
as described below.
A sample size calculation was carried out during design of the study using published
differences in growth rates between individually and pair housed calves of 0.13 g/day [21].
The variance was calculated as 0.10. Based on a confidence level of 0.95 and a power of 0.8,
using a 2-tailed test, the sample size for detecting a significant difference between three
treatment groups was n = 20/treatment [26].Animals 2021, 11, x FOR PEER REVIEW 4 of 15
Animals 2021, 11, 612 4 of 14
Animals 2021, 11, x FOR PEER REVIEW 4 of 15
Figure 1. Diagram demonstrating the layout of the three different housing groups in the study. ‘Ind’
Figure 1. Diagram demonstrating the layout of the three different housing groups in the study.
identifies the hutches
‘Ind’ identifies forfor
the hutches individual
individualcalves. The blue
calves. The blueboxes
boxes indicate
indicate thethe
calfcalf hutch,
hutch, the black solid
the black
Figure
lines
solid 1. Diagram
indicate
lines indicate demonstrating
the metal the surrounding
partitions
the metal layout
partitions of the three
surrounding thedifferent
the outside housing
outsidearea groups
area of the
the pen,inand
pen, thethe
and study.
theblack
black dashed line
‘Ind’ identifies the hutches for individual calves. The blue boxes indicate the calf hutch, the black
dashed line
indicates indicates
the the smallgate
small internal internal
usedgate
toused to initially
initially separate
separate calvescalves
thatthat became
became pair
pair housed at three
solid lines indicate the metal partitions surrounding the outside area of the pen, and the black
housed at three weeks of age. The individual pens were placed next to each other so calves could
weeks of age. The individual pens were placed next to each other so calves could
dashed line indicates the small internal gate used to initially separate calves that became pair only see each other
only see each other when outside.
housed at
when outside. three weeks of age. The individual pens were placed next to each other so calves could
only see each other when outside.
Figure 2.
Figure 2. Image
Image demonstrating
demonstrating the
thelayout
layoutused
usedfor
forpair
pairhousing.
housing.For calves
For that
calves were
that individually
were individually
Figure
housed2.
housed Image
until
until threedemonstrating
weeks
weeks of
of age the c),
age(group
(group layout used
c),aasmall
small for pair
partition
partitiongate housing.
was
gate For
initially
was calves
placed
initially that were individually
to separate
placed to separate
housed until three weeks of age (group c), a small partition gate was initially placed to separate the
outdoor areas and create two pens. This was removed at three weeks of age. The calves housed
in pairs from birth (group b) did not have the partition gate, therefore always had access to both
hutches and the full outdoor area.Animals 2021, 11, 612 5 of 14
2.2. Calf Nutrition
Each calf was fed a 22.5% whey protein and 25% oil, calf milk replacer (Advanced Op-
tistart 25, Advanced Sourcing, Dunston, Staffordshire, UK) mixed at 13.5% concentration,
fed through a teat feeder. The calves were fed a standardized regime starting at 3 L twice
daily from day one to day fourteen, increasing to 3.5 L twice daily from day 14 to 21, and then
increasing to 4 L twice daily from day 21 to 48. The calves were then step weaned down from
day 49–70 by reducing the milk volume fed by 2 L per week. Each hutch had ad libitum
water from a bucket, with forage provided by straw bedding which was refreshed daily.
Calves were provided with ad libitum pelleted concentrate, with 21% crude protein,
5.1% fats, 30.0% neutral detergent fibre (NDF), 33% starch and 12.5 MJ/kg (Rearer 21 nuts,
Mole Valley, UK). This was provided within a bucket inside the hutch (one per calf). On two
consecutive days each week, between weeks 2 to 8, the weight of the concentrates was
measured to allow intakes to be calculated. In pair hutches, the weight was divided by two
to provide an estimated intake per calf.
2.3. Performance and Health
Each calf underwent a weekly visit for a consecutive period of 10 weeks by the
researcher (SAM). At each visit, the weight was measured using a weigh band (AHDB,
Stoneleigh Park, Warks, UK) placed around the girth behind the forelimb. This method
has previously been validated against actual weigh measurements [21]. Birthweight was
taken as the measurement at the first visit between 0–7 days of age. Actual growth rates
were calculated by subtracting the start from the end weight and dividing by the exact
number of days between the two measurements. An average growth rate over the entire
pre-weaning period was calculated, as well as over three time periods: 2 to 4 weeks, 5 to
7 weeks, and 8 to 10 weeks. This allowed for compatible comparisons between all calves,
regardless of the exact age at each measurement [27].
Measurement of passive transfer was already routinely carried out as a management
procedure on the study farm. Blood was sampled from the jugular vein into a plain
vacutainer from calves between 2–8 days of age. The samples were left to stand for 24 h,
before a sample of serum was placed onto a refractometer to assess serum total protein (TP).
At each visit, the calves underwent a clinical health assessment following a modi-
fied scoring system developed by the University of Wisconsin-Madison [28,29] which was
modified to assess demeanour, nasal and ocular discharge, cough, faecal consistency, rectal
temperature, navel and joint health on a scale of 0 to 3. This was then simplified to a binary
classification of disease being either present (score 1) or absent (score 0) within the same three
periods as for growth rates [30]. When calves were identified as ill during a visit, they were
treated according to current veterinary practices adopted on farms by the farm staff.
Thoracic ultrasonography of all calves was carried out at seven weeks of age. After
application of 70% isopropyl alcohol to each thoracic area of the calf, a 7.5 MHz linear trans-
ducer was used to assess both sides of the thoracic cavity for pathology [31]. A categorical
scoring system was used to record lesions where Score 0 indicated normal aerated lung with
none to few comet-tail (B- line) artefacts, Score 1 indicated diffuse comet tails but without
consolidation and Score 2 indicated lobular or patchy pneumonia with consolidation [32].
2.4. Novel Object Appraoch
An open umbrella was used as a novel object, which was placed into each calf pen
during the sixth visit. Prior to placement, it was ensured that the calves were standing
up within the hutch, and the umbrella was placed into the outside area. The time was
measured from placement of the umbrella until it was touched by the nose of a calf. In pair
pens, the time was stopped when just one of the calves made contact with the umbrella.
The calves were observed for a maximum time limit of 10 min, and if no contact was made,
it was recorded as a non-approach [33].Animals 2021, 11, 612 6 of 14
2.5. Statistical Analysis
All data was stored in Excel (Microsoft Office; Microsoft, Redmond, WA, USA).
All analyses were performed using SPSS (Version 27.0, IBM SPSS Statistics for Windows,
NY: IBM Corp). Significance was declared at p ≤ 0.05, and trends were reported if p ≤ 0.10.
The outcomes of average daily liveweight gain (ADLG) over the three time periods
and feed intake for ages 2 to 8 weeks old were analysed using linear mixed effects models.
The overall fixed effects included were month of enrolment (to check for the effect of
different recruitment times), housing group (individual, pair at birth and pair at three
weeks), birthweight, total protein level, total mean concentrate intake, presence of disease,
and ultrasound score. Pen and calf identification number were included as random
effects. Results are reported as F-values in the format F(treatment df, error df) . For all analyses,
the assumption of normality was assessed through visual inspection of residual plots.
The outcome of disease occurrence was analysed using binary logistic generalised
estimating equations, with the variable pen used to account for repeated measures within a
pair of calves. The dependent variables were month of enrolment, housing group (individual,
pair at birth and pair at three weeks), birthweight, total protein level, and total feed intake.
The outcome of novel object approach time was analysed by generalised linear model,
with pen used as the experimental unit, and the variables of month of enrolment, housing
group and interaction between month of enrolment and housing group. A Chi square
analysis was carried out to compare the number of none approaches to the novel object
between different housing groups.
3. Results
One hundred Holstein heifer calves were recruited into the study over a six-month period.
During the study, two calves died (one individually housed, and one in the pair at three week
group), giving a 2% mortality rate. Cause of death was unknown. Data from both calves and
the associated pair were excluded from analysis, leaving 97 calves in the study analysis.
3.1. Weight Gain
The ADLG of the calves within the three time periods was not affected by the housing
group (F2,274 = 0.30, p = 0.74; Figure 3), with a mean ADLG in weeks 2–4 of 0.46 ± 0.02 kg/day,
in weeks 5–7 of 0.73 ± 0.02 kg/day, and in weeks 8–10 of 0.80 ± 0.02 kg/day. The overall
ADLG across weeks 1–10 was 0.66 ± 0.01 kg/day (standard error of the mean—SEM)
(range 0.35–0.97 kg/day). There was a non-significant numerical difference over the
weaning period (weeks 8 to 10), with housing group (a) achieving 0.72 ± 0.05 kg/day
(SEM), group (b) achieving 0.78 ± 0.03 kg/day, and group (c) achieving 0.86 ± 0.04 kg/day.
This suggested a tendency for pair housed calves to have a greater average increase in
weight gain compared to individually housed calves, even though all calves were group
housed over this period.
The average birthweight of the calves was 42 ± 0.18 kg (SEM) (range 36–48 kg),
and this had a significant effect on the ADLG (F1,274 = 5.00; p = 0.026), with a 1 kg increase
in birthweight resulting in an 0.011 kg increase in ADLG. There was no significant effect
of the month of enrolment (F5,274 = 1.05; p = 0.39), indicating that the different periods of
enrolment for the housing groups had no effect on treatment outcome. There also was no
significant effect of passive transfer (measured as serum TP) (F1,274 = 1.59; p = 0.21), total
concentrate feed intake between weeks 2 to 8 (F1,274 = 0.075; p = 0.79), the occurrence of
disease (F1,274 = 2.46; p = 0.12), or of the thoracic ultrasound score for the calf (F2,274 = 0.84;
p = 0.43).Animals 2021, 11, 612 7 of 14
Animals 2021, 11, x FOR PEER REVIEW 7 of 15
3. ADLG
FigureFigure (kg/day)
3. ADLG over
(kg/day) thethe
over different
differenttime
timeperiods
periods for thethree
for the threedifferent
different housing
housing groups,
groups, withwith the confidence
the 95% 95% confidence
interval. Calf numbers
interval. for each
Calf numbers for group include
each group individually
include housed
individually calves
housed (n =(n19= calves),
calves calves
19 calves), paired
calves pairedat birth
at (n (n
birth
Animals 2021, 11, x FOR = PEER
40 calves),
= 40 REVIEW
and
Animals2021,
2021, calves),
11,calves and
paired calves paired at three weeks of age (n = 38 calves). All calves were housed in groups of five during
at three weeks of age (n = 38 calves). All calves were housed in groups of five during weaning (weeks88–10). weaning
Animals 11, xxFOR
FORPEER
PEERREVIEW
REVIEW 8of
of15
15
(weeks 8–10).
3.2. Concentrate Feed Intake
The average birthweight of the calves was 42 ± 0.18 kg (SEM) (range 36–48 kg), and There w
The
this had housing
ano groupeffect
significant had a significant
on the ADLG effect
(F =on thepamount
5.00; =(F0.026), of1.00;
concentrate
5,566 ==with
feed ingested
There was
There was no significant
significant effect
effect of month
of month of1,274
of enrolment
enrolment (F5,566 1.00;app1 =kg increase
= 0.42),
0.42), in weight (F1,566
birth-
birth-
weightby (F
the calves
birthweight
1,566 == 1.14;
1.14;over weeks
resulting 2 to
in or
an 8 (Fkg
0.011 = of
4.56;
increase
2,566 inp ADLG.
= 0.011, Figure
There was4), nowith anwhich
estimated
significant effect of mean
weight (F1,566 pp == 0.29),
0.29), occurrence
or occurrence disease
of disease (F1,566
(F 1,566 == 1.05;
1.05; pp == 0.31),
0.31), which werewere all included
total
theofmonth
allincluded
included 6.2the
in ±of0.67 kg (SEM),
enrolment
final model. (F5,27412.7 ± 0.73
= 1.05; kg, and
p = 0.39), 13.6 ±that
indicating 0.70thekg ingested
different by individually
periods of en-
all in the final model.
rolment
housed, for housed
pair the housingfromgroups
birth,hadandnopaireffect on treatment
housed from three outcome. weeks There also was
of age, no
respectively.
significant
Most effect of passive
of this difference occurredtransfer (measured
between weeks as5–8
serum TP) (F1,274 = 1.59;
as consumption p = 0.21),over
increased total time.
concentrate feed intake between weeks 2 to 8 (F1,274 = 0.075; p = 0.79), the occurrence of
disease (F1,274 = 2.46; p = 0.12), or of the thoracic ultrasound score for the calf (F2,274 = 0.84; p
= 0.43).
3.2. Concentrate Feed Intake
The housing group had a significant effect on the amount of concentrate feed in-
gested by the calves over weeks 2 to 8 (F2,566 = 4.56; p = 0.011, Figure 4), with an estimated
mean total of 6.2 ± 0.67 kg (SEM), 12.7 ± 0.73 kg, and 13.6 ± 0.70 kg ingested by individually
housed, pair housed from birth, and pair housed from three weeks of age, respectively.
Most of this difference occurred between weeks 5–8 as consumption increased over time.
Figure 4. Mea
Figure
Figure 4.4. Mean
Figure Mean measured
measured
4. Mean concentrate
concentrate
measured feedfeed
feed
concentrate consumption
consumption
consumption between
between visits
visits
between at 22atto
at
visits to288toweeks
weeks
8 weeks of of
of age
age for
for
age forthe
thedifferent h
the different
the different
different housing
housing
housing groups
groups
groups ofof
of calves, with
calves,with
calves, the
withthe 95%
the95% confidence
95%confidence interval
confidenceinterval shown
intervalshown
shownas as error
aserror bars. The
errorbars. The
The line ind
lineindicates
line
line indicatesthe
indicates theindividually
individuallyhoused
individually housed calves
calves (n(n === 19
19 calves),
19 calves), the
calves), the
the linelineindicates
line indicatesthe
indicates thecalves
the calves paired
calvespaired
calves pairedat
paired atbirth
at birth(n
birth (n==40
40calves),
40 and
calves), and lineindicates
line indicatesthe
indicates calvespaired
the calves paired
pairedat at three
atthree weeks
threeweeks
weeksof ofofage
age(n = 38 cal
age (n
age (n(n =
= 3838
= 38calves).
calves).
calves).
3.3. Passive T
3.3.Passive
3.3. PassiveTransfer
Transfer
The we
Theweek
The week11total
totalprotein
proteinlevels
levelsin
inblood
bloodranged
rangedfrom
from3.8–8.2
3.8–8.2g/dL,
g/dL,with
with85%
85%ofofcalves
calves classed as ha
classedas
classed ashaving
havinggood
goodpassive
passivetransfer
transferas
asindicated
indicatedby
byaalevel
levelof
of≥5.2
≥5.2g/dL
g/dL[34].
[34].There
Therewas
was no differenc
nodifference
no differencebetween
betweenthe
thethree
threehousing
housinggroups.
groups.
3.4. Disease OAnimals 2021, 11, 612 8 of 14
There was no significant effect of month of enrolment (F5,566 = 1.00; p = 0.42), birth-
weight (F1,566 = 1.14; p = 0.29), or occurrence of disease (F1,566 = 1.05; p = 0.31), which were
all included in the final model.
3.3. Passive Transfer
The week 1 total protein levels in blood ranged from 3.8–8.2 g/dL, with 85% of calves
classed as having good passive transfer as indicated by a level of ≥5.2 g/dL [34]. There
was no difference between the three housing groups.
3.4. Disease Occurrence
A total of 38 calves (39.1%) experienced disease during the pre-weaning period
(Table 1), with cough and diarrhoea being the most common presenting clinical signs.
There was no significant effect of housing group (p = 0.98), month of enrolment (p = 0.18),
blood total protein level (odds ratio (OR) = 1.01 (0.94–1.08); p = 0.78), birthweight (OR = 0.97
(0.82–1.15); p = 0.72), ADLG (OR = 0.013 (0.004–4.53); p = 0.15), or total concentrate feed
intake (OR = 0.63 (0.33–1.18); p = 0.15) on the occurrence of disease. The data did, however,
demonstrate a tendency for an association between ultrasound score and the concen-
trate feed intake (F2,566 = 2.47; p = 0.085), with an estimated total concentrate intake of
12.8 ± 0.58 kg (SEM), 9.9 ± 1.00 kg and 6.6 ± 1.36 kg for thoracic ultrasound scores of 0,
1, and 2 respectively. This suggested a potential association between lung disease and
reduced feed intakes.
Table 1. Distribution of the disease occurrence and thoracic ultrasound score during the pre-weaning period between the
different housing groups of calves. For a calf to be diagnosed as having Bovine Respiratory Disease (BRD), they must
have had a raised rectal temperature (≥39.5 ◦ C) and either a cough or ocular or nasal discharge. An ultrasound score of
2 indicated lobular or patchy pneumonia with consolidation.
Clinical Sign Individual Pair Housedfrom Birth Pair Housed at 3 Weeks Total
Bovine Respiratory Disease 0 0 4 4 (4.1%)
Cough 5 5 7 17 (17.5%)
Diarrhoea 1 7 4 12 (12.4%)
Diarrhoea and Cough 1 0 1 2 (2.1%)
Diarrhoea and Nasal Discharge 0 0 1 1 (1.0%)
Diphtheria 0 1 0 1 (1.0%)
Nasal Discharge 1 0 0 1 (1.0%)
No Disease 11 27 21 59 (60.9%)
Thoracic ultrasound score 2 2 0 3 5 (5.2%)
3.5. Novel Object Approach
This test was performed during the visit of week 6. Of all the calves observed, 1/19
(5.3%) individual, 3/20 (15.0%) paired at birth and 11/19 (57.9%) paired at three weeks
of age did not approach the novel object within the observation time limit of 10 min.
A χ2 analysis demonstrated a significant difference in no approaches between the groups
(p < 0.01). Of the calves that did approach, there was no significant effect of housing group
(p = 0.29) or any interaction between housing group and month of enrolment (p = 0.31) on
the time taken to approach and touch the umbrella (Figure 5). The mean time to approach
the novel object was 177 ± 23.3 s (SEM). The month of enrolment demonstrated a tendency
towards being associated with the time to approach the novel object (p = 0.066), which was
between 10–35 s less in the calves paired at 3 weeks than groups (a) and (b). This result
needs, however, to be interpreted with caution as only eight calves in this group did
approach the novel object.0.01). Of the calves that did approach, there was no significant effect of housing group (p
= 0.29) or any interaction between housing group and month of enrolment (p = 0.31) on
the time taken to approach and touch the umbrella (Figure 5). The mean time to approach
the novel object was 177 ± 23.3 s (SEM). The month of enrolment demonstrated a tendency
towards being associated with the time to approach the novel object (p = 0.066), which was
Animals 2021, 11, 612 9 of 14
between 10–35 s less in the calves paired at 3 weeks than groups (a) and (b). This result
needs, however, to be interpreted with caution as only eight calves in this group did ap-
proach the novel object.
Figure
Figure 5. 5. A scatter
A scatter graph
graph demonstrating
demonstrating the spreadtheofspread of time
time taken taken the
to approach to approach
novel objectthe
for novel object for
each
eachhousing
housinggroup of calves.
group Each Each
of calves. dot represents either an
dot represents individual
either calf in the calf
an individual individually
in the individually housed
housed calf group, or the time taken for the first calf to touch the novel object in the pair housed
calf group,
groups. or the time
The horizontal takenthe
line shows formedian
the first
time calf
for to touch
that groupthe novel object
to approach in the pair housed groups.
the object.
The horizontal line shows the median time for that group to approach the object.
4. Discussion
This study examined the effects of individual and pair housing of calves at different
ages on a commercial dairy farm to establish if existing research findings were applicable
under commercial management and environmental conditions in the UK.
4.1. Weight Gain
During the pre-weaning period from 1 to 10 weeks of age, the ADLG of the calves was
not affected by the housing group (p = 0.74), with the ADLG being 0.66 ± 0.098 kg/day
(SD) over the entire period. This is in agreement with other reported figures [35]. The lack
of association with housing group size is also in agreement with other studies [8,33–36],
indicating no negative impact on pair housing of calves. However, the ADLG was below
the minimum requirements of 0.7 kg/day growth needed for an age at first calving target
of 24 months [37,38]. The relatively low ADLG may be due to the restricted milk feeding
protocols used, which are relatively common across UK dairy farms [39]. This low milk
feeding level affects concentrations of insulin-like growth factor 1 (IGF-1), which helps
with growth promotion; therefore, low levels from restricted feeding rates are linked to
reduced growth rates in calves [40].
Although the overall ADLG did not differ between housing groups, there was a
numerical tendency towards higher growth rates of around 60 g/day in the calves which
were pair housed at three weeks of age. Although this finding may have been due to
chance, the study was underpowered to find a difference of less than 130 g/day in growth
rates between housing groups [21]. For the difference seen to become significant, a sample
size of 90 calves per housing group would have been required. To achieve this on a single
farm, a recruitment period much longer than the six months used in this study would have
been needed, increasing the likelihood of seasonal effects due to temperature differences.
The ADLG was also assessed separately over three time periods, with poor growth
seen in weeks 2 to 4 of life, reaching only 0.46 ± 0.02 kg/day (SEM), and improving in the
second month of life, reaching a mean 0.80 ± 0.02 kg/day. These relatively low growth
rates early in life have been found in other studies [27,39,41], and represents a large loss in
potential growth efficiency due to the excellent feed conversion that young calves are able
to achieve. There was a numerical difference in ADLG over the weaning period (weeks
8 to 10), with the calves pair housed from three weeks of age having a greater average
increase in weight gain (0.86 ± 0.23 kg/day (SEM)) compared to individually housed calves
(0.72 ± 0.21 kg/day (SEM)), even though all calves were group housed over this period.Animals 2021, 11, 612 10 of 14
Other studies such as Chua et al. [8] have reported significant reductions in growth rate in
response to weaning, potentially caused by the transitioning into group pens being stressful
due to both the physical handling and movement, the introduction to a new environment,
and meeting new calves. Calves that are initially pair housed have been shown to cope
better with stress through the benefits of social support [42], with individually housed
calves being more reactive to unfamiliar calves [43], which can have a negative impact on
feed intakes and therefore growth rates. Calves pair housed at three weeks of age may
benefit from a lack of competition for milk resources in the first few weeks of life, combined
with the ability to interact with a peer once slightly stronger, thus still benefitting from
social learning. Knauer et al. [36] found that pair housed calves had greater weight gain
pre-weaning, and this continued with a small numerical increase in bodyweight up to
16 weeks of age. This indicates that the early benefits associated with pair housing may
continue longer term, and future studies on early life housing should continue to monitor
calves post-weaning to establish if this difference persists in calves that are pair housed at
three weeks of age.
Calf birthweights ranged from 36–48 kg, with a mean value of 41.7 kg and no difference
between the housing groups. However, the average birthweight of the calves did have
a significant effect on the ADLG that the calf was able to achieve (p = 0.026), with a 1 kg
increase in birthweight resulting in a 0.011 kg increase in ADLG. This may be due to larger
calves being stronger and more competitive for feed, which is in agreement with some
literature that larger calves have greater pre-pubertal growth rates compared to smaller
calves [39,44]. However, it is in contrast to another study, which found that calves with
smaller heart-girth circumferences had compensatory increases in ADLG [45]. This may
only be possible when higher milk feeding rates are used. There may also be an effect
of dam parity, with smaller calves born to primiparous dams able to exhibit catch-up
growth [38], whereas small calves born to multiparous dams were not [44].
There was no effect of the month of birth on ADLG (p = 0.39), indicating that the
difference in enrolment periods for the housing groups did not have an effect on the overall
outcomes measured. In addition, the whole study was conducted over the spring/summer
period in the UK, when average temperatures are in the range 12–26 ◦ C. There was no
effect of disease occurrence on ADLG (p = 0.12), which is in contrast to other studies that
typically found that calves with disease had reduced growth [46–49]. The level of disease
on this study farm was relatively low, with recorded clinical signs generally being mild,
which may have limited the impact that disease occurrence had on ADLG. This may also
be related to the season, as warmer weather in the UK was previously associated with a
reduced incidence of BRD [50].
4.2. Concentrate Feed Intake
Calves between two and eight weeks old that were housed in pairs had increased
concentrate feed intake (p = 0.011), consuming almost twice as much concentrate (12.7 ±
0.73 kg (SEM) for those paired at birth and 13.6 ± 0.70 kg for those paired at three weeks of
age) compared to individually housed calves (6.2 ± 0.67 kg). This is similar to other studies
that found increased solid feed intakes in socially housed calves due to social facilitation,
with a calf more likely to approach a feeder when another calf is feeding [19,36,51–53],
spending longer time periods eating [54], and in more frequent meals [55], with these
differences known to continue in the post-weaning period.
Despite the difference in feed intakes between housing groups in this study, there were
no significant differences in growth rates in the pre-weaning period (p = 0.74), although
as mentioned above, there was a numerical trend towards higher growth rates in the pair
housed calves around the time of weaning, which could be explained by the increased solid
feed intakes. This lack of a significant difference in growth rates despite the significant
difference in feed intake may be due to an insufficient sample size, as discussed above.
Alternatively it may suggest differences in feed efficiency between the housing groups.
One potential reason for this is that pair housed calves have been shown to be more active,Animals 2021, 11, 612 11 of 14
so the extra feed intakes may have been used for activity rather than growth [53]. However,
this was not recorded in this study.
In all housing groups, there were very low concentrate intakes up to four weeks of age,
but this continued in the individually housed calves up until the point that weaning began
(eight weeks of age). This may negatively impact on future feed intakes in individually
housed calves, as feeding patterns acquired early in life can persist, potentially impacting
production parameters for reproduction and lactation [55]. It should be noted that the
individual housing style for calves that were paired at three weeks of age was different to
those calves who were individually housed throughout the study (Figure 1). The layout of
the hutches enabled paired calves to see directly inside the other hutch even when initially
separated by a gate. This might have had an influence on development of behaviours in
the first three weeks of life, but this was not assessed in this study.
The study indicated a tendency for an association between thoracic ultrasound scores
and the concentrate feed intakes (p = 0.085), with estimated total concentrate intakes of
12.8 ± 0.58 kg (SEM), 9.9 ± 1.0 kg, and 6.6 ± 1.36 kg during weeks two to eight, for thoracic
ultrasound scores of 0, 1, and 2, respectively. This did not, however, result in a significant
effect on ADLG, although Cramer et al. [56] demonstrated a reduction in growth of calves
with lung consolidation. We were unable to determine whether calves that consumed
less food (for any reason) were more likely to experience respiratory disease or vice
versa. In addition, lung consolidation is not always associated with clinically observable
changes [57], which may explain the relatively low level of clinical respiratory disease
identified in the calves during the scoring process.
4.3. Disease Occurrence
A common perception by farmers is that social housing of calves results in higher
disease rates, but this study indicated no significant effect of pair housing (p = 0.98) on
disease occurrence. This is in agreement with other studies [8,9,42], and confirms there
is no detrimental effect of pair housing on calf health. This may be because contact
between individually housed calves was still possible (in compliance with the EU directive
97/2/EC), allowing both faecal-oral and aerosol transmission of pathogens between pens,
producing little difference to the pair housed calves. There are reports of increased disease
prevalence in larger group sizes, although this is likely to be due to mixing of calves of
different ages and sharing of single teats when automatic calf feeders are used [58–60].
The disease prevalence in the study was 39.1%, with the most prevalent clinical signs
being a cough (17.5%) and diarrhoea (12.4%). This disease prevalence is lower than in
other UK studies [27,61]. The presence of a cough without other clinical signs may have
been indicative of Bovine Respiratory Disease [BRD]. The use of weekly calf health scoring
meant that we were potentially able to identify affected calves either early in the disease
course or with only mild signs [56,62]. However, on this farm, a higher sensitivity to clinical
signs did not translate into an increase in calf treatments. The high relative proportion
of calves with loose faeces is supported by other studies, suggesting this is a common
occurrence in young calves [8,9].
4.4. Novel Object Approach
There were no significant effects of the housing group (p = 0.29) on the time taken
to approach the novel object. However, the number of calves that did not approach the
novel object within 10 min of it being placed in the pen was significantly different between
the housing groups (p < 0.01). Only one individually housed calf (5%) failed to approach
compared with 11 (58%) of the calves paired at three weeks of age. Researcher observations
indicated that a large proportion of the calves paired at three weeks entered a lying down
position and appeared to ignore the novel object. This may suggest that individually housed
calves were more willing to explore their environment, which is supported by the theory
that individually reared animals show enhanced effects of reward-related stimuli [63].
These findings are in contrast to some other studies, which have shown that individuallyAnimals 2021, 11, 612 12 of 14
housed calves are more fearful and reluctant to approach novel objects [9,18], and back off
during exploration, which may be an indicator of heightened anxiety [43]. The individually
housed calves in this study were, however, able to have tactile contact with each other
through the outdoor pen fencing, which has been shown to reduce fearfulness [12].
5. Conclusions
This study aimed to assess different calf housing strategies within a commercial dairy
management system, under typical UK environmental conditions. Overall findings indicate
that there were no detrimental effects of housing calves within pairs (either from birth
or from three weeks of age) compared to individual housing. This was shown by no
significant differences in average daily liveweight gain, disease prevalence, or novel object
approach times between the housing groups. However, we did find increased solid feed
intakes in pair housed calves, which may have long-term benefits on calf development.
Author Contributions: The study was designed by S.A.M., R.E.B., D.C.W., and N.B. The experimental
work and data analysis was conducted by S.A.M. The paper was written by S.A.M., R.E.B., D.C.W.,
and N.B. All authors have read and agreed to the published version of the manuscript.
Funding: This research was funded by the Barham Benevolent Foundation and AHDB Dairy.
Institutional Review Board Statement: The study was conducted according to the guidelines of the
Royal Veterinary College, and approved by the Clinical Research Ethics Committee of the Royal
Veterinary College (protocol code URN SR2019-0369, 27/03/20).
Acknowledgments: Many thanks go to the farm owner and staff who allowed this study to take
place, and to Y. Cheung for statistical advice.
Conflicts of Interest: The authors declare no conflict of interest. The funders had no role in the design
of the study; in the collection, analyses, or interpretation of data; in the writing of the manuscript,
or in the decision to publish the results.
References
1. Brickell, J.S.; Wathes, D.C. A descriptive study of the survival of Holstein-Friesian heifers through to third calving on English
dairy farms. J. Dairy Sci. 2011, 94, 1831–1838. [CrossRef] [PubMed]
2. Godden, S. Colostrum Management for Dairy Calves. Vet. Clin. N. Am. Small Anim. Pract. 2008, 24, 19–39. [CrossRef]
3. Knauer, W.A.; Godden, S.M.; McGuirk, S.M.; Sorg, J. Randomized clinical trial of the effect of a fixed or increasing milk allowance
in the first 2 weeks of life on health and performance of dairy calves. J. Dairy Sci. 2018, 101, 8100–8109. [CrossRef]
4. Lago, A.; McGuirk, S.M.M.; Bennett, T.B.B.; Cook, N.B.B.; Nordlund, K.V.V. Calf Respiratory Disease and Pen Microenvironments
in Naturally Ventilated Calf Barns in Winter. J. Dairy Sci. 2006, 89, 4014–4025. [CrossRef]
5. Marcé, C.; Guatteo, R.; Bareille, N.; Fourichon, C. Dairy calf housing systems across Europe and risk for calf infectious diseases.
Animal 2010, 4, 1588–1596. [CrossRef] [PubMed]
6. Barrington, G.M.; Gay, J.M.; Evermann, J.F. Biosecurity for neonatal gastrointestinal diseases. Vet. Clin. N. Am. Small Anim. Pract.
2002, 18, 7–34. [CrossRef]
7. Callan, R.J.; Garry, F.B. Biosecurity and bovine respiratory disease. Vet. Clin. N. Am. Small Anim. Pract. 2002, 18, 57–77. [CrossRef]
8. Chua, B.; Coenen, E.; Van Delen, J.; Weary, D.M. Effects of Pair Versus Individual Housing on the Behavior and Performance of
Dairy Calves. J. Dairy Sci. 2002, 85, 360–364. [CrossRef]
9. Jensen, M.B.; Larsen, L.E. Effects of level of social contact on dairy calf behavior and health. J. Dairy Sci. 2014, 97, 5035–5044.
[CrossRef]
10. Galef, J.B. Communication of information concerning distant diets in a social, central-place foraging species: Rattus norvegicus.
In Social Learning: Psychological and Biological Perspectives; Zentall, T.R., Galef, B., Eds.; Psychology Press: New York, NY, USA,
1988; pp. 119–139.
11. Keeling, L.J.; Hurnik, J.F. Social facilitation and synchronization of eating between familiar and unfamiliar newly weaned piglets.
Acta Agric. Scand. A Anim. Sci. 1996, 46, 54–60. [CrossRef]
12. De Paula Vieira, A.; von Keyserlingk, M.A.G.; Weary, D.M. Effects of pair versus single housing on performance and behavior of
dairy calves before and after weaning from milk. J. Dairy Sci. 2010, 93, 3079–3085. [CrossRef] [PubMed]
13. Babu, L.K.; Pandey, H.N.; Sahoo, A. Effect of individual versus group rearing on ethological and physiological responses of
crossbred calves. Appl. Anim. Behav. Sci. 2004, 87, 177–191. [CrossRef]
14. Liu, S.; Ma, J.; Li, J.; Alugongo, G.M.; Wu, Z.; Wang, Y. Effects of Pair Versus Individual Housing on Performance, Health,
and Behavior of Dairy Calves. Animals 2019, 10, 50. [CrossRef]Animals 2021, 11, 612 13 of 14
15. Grignard, L.; Boissy, A.; Boivin, X.; Garel, J.P.; Le Neindre, P. The social environment influences the behavioural responses of beef
cattle to handling. Appl. Anim. Behav. Sci. 2000, 68, 1–11. [CrossRef]
16. Takeda, K.I.; Sato, S.; Sugawara, K. Familiarity and group size affect emotional stress in Japanese Black heifers. Appl. Anim. Behav.
Sci. 2003, 82, 1–11. [CrossRef]
17. Færevik, G.; Jensen, M.B.; Bøe, K.E. Dairy calves social preferences and the significance of a companion animal during separation
from the group. Appl. Anim. Behav. Sci. 2006, 99, 205–221. [CrossRef]
18. Jensen, M.B.; Vestergaard, K.S.; Krohn, C.C.; Munksgaard, L. Effect of single versus group housing and space allowance on
responses of calves during open-field tests. Appl. Anim. Behav. Sci. 1997, 54, 109–121. [CrossRef]
19. Whalin, L.; Weary, D.M.; von Keyserlingk, M.A.G. Short communication: Pair housing dairy calves in modified calf hutches. J.
Dairy Sci. 2018, 101, 5428–5433. [CrossRef]
20. Costa, J.H.C.; Daro, R.R.; von Keyserling, M.G.; Weary, D.M. Complex social housing reduces food neophobia in dairy calves. J.
Dairy Sci. 2014, 97, 7804–7810. [CrossRef]
21. Costa, J.H.C.; Meagher, R.K.; von Keyserlingk, M.A.G.; Weary, D.M. Early pair housing increases solid feed intake and weight
gains in dairy calves. J. Dairy Sci. 2015, 98, 6381–6386. [CrossRef] [PubMed]
22. Duve, L.R.; Jensen, M.B. Social behavior of young dairy calves housed with limited or full social contact with a peer. J. Dairy Sci.
2012, 95, 5936–5945. [CrossRef] [PubMed]
23. Perttu, R.K.; Ventura, B.A.; Endres, M.I. Youth and adult public views of dairy calf housing options. J. Dairy Sci. 2020, 103, 8507–8517.
[CrossRef]
24. Wormsbecher, L.; Bergeron, R.; Haley, D.; de Passillé, A.M.; Rushen, J.; Vasseur, E. A method of outdoor housing dairy calves in
pairs using individual calf hutches. J. Dairy Sci. 2017, 100, 7493–7506. [CrossRef] [PubMed]
25. Curtis, G.; McGregor Argo, C.; Jones, D.; Grove-White, D. The impact of early life nutrition and housing on growth and
reproduction in dairy cattle. PLoS ONE 2018, 13, e0191687. [CrossRef]
26. Dupont, W.; Plummer, W. Power and Sample Size Calculations: A Review and Computer Program. Control Clin. Trials. 1990,
11, 116–128. [CrossRef]
27. Johnson, K.F.; Chancellor, N.; Burn, C.C.; Wathes, D.C. Analysis of pre-weaning feeding policies and other risk factors influencing
growth rates in calves on 11 commercial dairy farms. Animal 2018, 12, 1413–1423. [CrossRef] [PubMed]
28. McGuirk, S. Troubleshooting dairy calf pneumonia problems. In Proceedings of the Twenty fifth Annual ACVIM Forum, Seattle,
WA, USA, 6–9 June 2007.
29. Mahendran, S.A.; Booth, R.; Bell, N.J. Randomised control trial of NSAID and antimicrobial treatments for pyrexia caused by
BRD. In Proceedings of the BCVA Congress, Southport, UK, 17–19 October 2017; pp. 259–266.
30. Mahendran, S.A.; Booth, R.; Burge, M.; Bell, N.J. Randomised positive control trial of NSAID and antimicrobial treatment for calf
fever caused by pneumonia. Vet. Rec. 2017, 181, 45. [CrossRef]
31. Pardon, B. A quick scan lung ultrasound method and flow chart as a decision aid for bronchopneumonia diagnosis. In Proceedings
of the XXIV Congreso Internacional ANEMBE de Medicinea Bovina, Seville, Spain, 22–24 May 2019; p. 258.
32. Ollivett, T.L.; Buczinski, S. On-Farm Use of Ultrasonography for Bovine Respiratory Disease. Vet. Clin. N. Am. Food Anim. Pract.
2016, 32, 19–35. [CrossRef]
33. Neave, H.W.; Costa, J.H.C.; Weary, D.M.; von Keyserlingk, M.A.G. Personality is associated with feeding behavior and perfor-
mance in dairy calves. J. Dairy Sci. 2018, 101, 7437–7449. [CrossRef] [PubMed]
34. Godden, S.M.; Lombard, J.E.; Woolums, A.R. Colostrum Management for Dairy Calves. Vet. Clin. N. Am. Food Anim. Pract. 2019,
35, 535–556. [CrossRef] [PubMed]
35. Soberon, F.; Raffrenato, E.; Everett, R.W.; Van Amburgh, M.E. Preweaning milk replacer intake and effects on long-term
productivity of dairy calves. J. Dairy Sci. 2012, 95, 783–793. [CrossRef]
36. Knauer, W.A.; Godden, S.M.; Rendahl, A.K.; Endres, M.I.; Crooker, B.A. The effect of individual versus pair housing of dairy heifer
calves during the preweaning period on measures of health, performance, and behavior up to 16 weeks of age. J. Dairy Sci. 2020.
[CrossRef]
37. Cooke, J.S.; Cheng, Z.; Bourne, N.E.; Wathes, D.C. Association between growth rates, age at first calving and subsequent fertility,
milk production and survival in Holstein-Friesian heifers. Open J. Anim. Sci. 2013, 3, 1–12. [CrossRef]
38. Boulton, A.C.; Rushton, J.; Wathes, D.C. An empirical analysis of the cost of rearing dairy heifers from birth to first calving and
the time taken to repay these costs. Animal 2017, 11, 1372–1380. [CrossRef] [PubMed]
39. Brickell, J.S.; McGowan, M.M.; Wathes, D.C. Effect of management factors and blood metabolites during the rearing period on
growth in dairy heifers on UK farms. Domest. Anim. Endocrinol. 2009, 36, 67–81. [CrossRef]
40. Bazeley, K.J.; Barrett, D.C.; Williams, P.D.; Reyher, K.K. Measuring the growth rate of UK dairy heifers to improve future
productivity. Vet. J. 2016, 212, 9–14. [CrossRef] [PubMed]
41. Morrison, S.; Wicks, H.; Fallon, R.; Twigge, J.; Dawson, L.; Wylie, A.; Carson, A. Effects of feeding level and protein content of
milk replacer on the performance of dairy herd replacements. Animal 2009, 3, 1570–1579. [CrossRef] [PubMed]
42. Bolt, S.L.; Boyland, N.K.; Mlynski, D.T.; James, R.; Croft, D.P. Pair housing of dairy calves and age at pairing: Effects on weaning
stress, health, production and social networks. PLoS ONE 2017, 12, e0166926. [CrossRef] [PubMed]
43. De Paula Vieira, A.; de Passillé, A.M.; Weary, D.M. Effects of the early social environment on behavioral responses of dairy calves
to novel events. J. Dairy Sci. 2012, 95, 5149–5155. [CrossRef] [PubMed]Animals 2021, 11, 612 14 of 14
44. Swali, A.; Wathes, D.C. Influence of the dam and sire on size at birth and subsequent growth, milk production and fertility in
dairy heifers. Theriogenology 2006, 66, 1173–1184. [CrossRef]
45. Lundborg, G.K.; Oltenacu, P.A.; Maizon, D.O.; Svensson, E.C.; Liberg, P.G.A. Dam-related effects on heart girth at birth, morbidity
and growth rate from birth to 90 days of age in Swedish dairy calves. Prev. Vet. Med. 2003, 60, 175–190. [CrossRef]
46. Place, N.T.; Heinrichs, A.J.; Erb, H.N. The Effects of Disease, Management, and Nutrition on Average Daily Gain of Dairy Heifers
from Birth to Four Months. J. Dairy Sci. 1998, 81, 1004–1009. [CrossRef]
47. Ganaba, R.; Bigras-Poulin, M.; Bélanger, D.; Couture, Y. Description of cow-calf productivity in Northwestern Quebec and path
models for calf mortality and growth. Prev. Vet. Med. 1995, 24, 31–42. [CrossRef]
48. Donovan, G.A.; Dohoo, I.R.; Montgomery, D.M.; Bennett, F.L. Calf and disease factors affecting growth in female Holstein calves
in Florida, USA. Prev. Vet. Med. 1998, 33, 1–10. [CrossRef]
49. Virtala, A.M.K.; Mechor, G.D.; Gröhn, Y.T.; Erb, H.N. The Effect of Calfhood Diseases on Growth of Female Dairy Calves During
the First 3 Months of Life in New York State. J. Dairy Sci. 1996, 79, 1040–1049. [CrossRef]
50. Johnson, K.F.; Chancellor, N.; Wathes, D.C. A Cohort Study Risk Factor Analysis for Endemic Disease in Pre-Weaned Dairy Heifer
Calves. Animals 2021, 11, 378. [CrossRef] [PubMed]
51. Hepola, H.; Hänninen, L.; Pursiainen, P.; Tuure, V.M.; Syrjälä-Qvist, L.; Pyykkönen, M.; Saloniemi, H. Feed intake and oral
behaviour of dairy calves housed individually or in groups in warm or cold buildings. Livest. Sci. 2006, 105, 94–104. [CrossRef]
52. Phillips, C.J.C. The effects of forage provision and group size on the behavior of calves. J. Dairy Sci. 2004, 87, 1380–1388. [CrossRef]
53. Jensen, M.B.; Duve, L.R.; Weary, D.M. Pair housing and enhanced milk allowance increase play behavior and improve performance
in dairy calves. J. Dairy Sci. 2015, 98, 2568–2575. [CrossRef] [PubMed]
54. Margerison, J.K.; Preston, T.R.; Berry, N.; Phillips, C.J.C. Cross-sucking and other oral behaviours in calves, and their relation to
cow suckling and food provision. Appl. Anim. Behav. Sci. 2003, 80, 277–286. [CrossRef]
55. Miller-Cushon, E.K.; DeVries, T.J. Effect of social housing on the development of feeding behavior and social feeding preferences
of dairy calves. J. Dairy Sci. 2016, 99, 1406–1417. [CrossRef]
56. Cramer, M.C.; Ollivett, T.L. Growth of preweaned, group-housed dairy calves diagnosed with respiratory disease using clinical
respiratory scoring and thoracic ultrasound—A cohort study. J. Dairy Sci. 2019, 102, 4322–4331. [CrossRef]
57. Ollivett, T.L.; Leslie, K.E.; Duffield, T.F.; Nydam, D.V.; Hewson, J.; Caswell, J.; Dunn, P.; Kelton, D.F. Field trial to evaluate the
effect of an intranasal respiratory vaccine protocol on calf health, ultrasonographic lung consolidation, and growth in Holstein
dairy calves. J. Dairy Sci. 2018, 101, 8159–8168. [CrossRef] [PubMed]
58. Lorenz, I.; Fagan, J.; More, S.J. Calf health from birth to weaning. II. Management of diarrhoea in pre-weaned calves. Ir. Vet. J.
2011, 64, 9. [CrossRef] [PubMed]
59. Curtis, G.C.; Argo, C.M.; Jones, D.; Grove-White, D.H. Impact of feeding and housing systems on disease incidence in dairy
calves. Vet. Rec. 2016, 179, 512. [CrossRef]
60. Hepola, H. Milk feeding systems for dairy calves in groups: Effects on feed intake, growth and health. Appl. Anim. Behav. Sci.
2003, 80, 233–243. [CrossRef]
61. Mahendran, S.A.; Booth, R.; Beekhuis, L.; Manning, A.; Blackmore, T.; Vanhoudt, A.; Bell, N. Assessing the effects of weekly
preweaning health scores on dairy calf mortality and productivity parameters: Cohort study. Vet. Rec. 2017, 181, 196. [CrossRef]
62. McGuirk, S.M. Disease Management of Dairy Calves and Heifers. Vet. Clin. N. Am. Food Anim. Pract. 2008, 24, 139–153. [CrossRef]
63. Jones, G.H.; Marsden, C.A.; Robbins, T.W. Increased sensitivity to amphetamine and reward-related stimuli following social
isolation in rats: Possible disruption of dopamine-dependent mechanisms of the nucleus accumbens. Psychopharmacology 1990,
102, 364–372. [CrossRef] [PubMed]You can also read