Production of Vegetables and Artichokes Is Associated with Lower Cardiovascular Mortality: An Ecological Study - MDPI
←
→
Page content transcription
If your browser does not render page correctly, please read the page content below
International Journal of
           Environmental Research
           and Public Health

Article
Production of Vegetables and Artichokes Is
Associated with Lower Cardiovascular Mortality: An
Ecological Study
Alberto Arnedo-Pena 1,2,3, * , Joan Puig-Barberà 4 , Juan Bellido-Blasco 2,3,5 ,
Ma¯ Angeles Romeu-Garcia 2 , Ma¯ Rosario Pac-Sa 2 and Francisco Guillen-Grima 1
 1  Health Sciences Department, Public University Navarra, 31008 Pamplona, Spain; f.guillen.grima@gmail.com
 2  Epidemiology Division Public Health Center, 12003 Castello de la Plana, Spain; bellido_jua@gva.es (J.B.-B.);
    romeu_man@gva.es (M.A.R.-G.); charopac@gmail.com (M.R.P.-S.)
 3  Epidemiology and Public Health (CIBERESP), 28029 Madrid, Spain
 4  Vaccines Research Area FISABIO, 46020 Valencia, Spain; jpuigb55@gmail.com
 5  Epidemiology Department, Jaume I University, 12006 Castelló de la Plana, Spain
 * Correspondence: albertoarnedopena@gmail.com

 Received: 29 July 2020; Accepted: 5 September 2020; Published: 10 September 2020

 Abstract: Mortality due to cardiovascular disease (CVD), including cerebrovascular disease (CED)
 and ischaemic heart disease (IHD), was considerably different in eight municipalities of the province of
 Castellón, Community of Valencia (Spain) during the period of 1991–2011. In addition, these villages
 showed differences in agricultural practices and production. Since high vegetable consumption has
 been linked to decreased all-cause, CVD, and CED mortalities, we hypothesized that the diversity
 in vegetable and artichoke production, used as proxies for their consumption, could be associated
 with the diversity of mortality rates. In order to test our hypothesis, we estimated the smoothed
 standardized mortality ratios (SMRs) of CVD, CED, and IHD mortalities and a directed, age-adjusted
 mortality rate (AMR). We used a multilevel linear regression analysis to account for the ecological
 nature of our study. After adjustment, the CVD and CED SMRs were inversely associated with
 vegetable and artichoke production, with a reduction in SMRs for CVD: −0.19 (95% Confidence
 Interval [CI] −0.31 to −0.07) and −0.42 (95% CI −0.70 to −0.15) per hectare/103 inhabitants, respectively.
 The SMRs for CED also decreased: −0.68 (95% CI −1.61 to −0.19) and −1.47 (95% CI −2.57 to −0.36)
 per hectare/103 inhabitants, respectively. The SMRs for IHD were not associated with vegetal and
 artichoke production. When the directed AMR was used, CED mortality was consistent with the
 previous results, whereas the CVD mortality association was lost. Our results indicate that vegetable
 and artichoke production may act as protective factors of CED and CVD mortalities.

 Keywords: mortality; cardiovascular; cerebrovascular; vegetables; artichokes; agriculture;
 municipalities; multilevel; ecology

1. Introduction
     Mortality from cardiovascular diseases (CVD), including cerebrovascular disease (CED), is the
primary cause of death in the population, and many risk factors have been identified through
epidemiological and medical studies [1–5]. CVD and CED mortalities present large geographic
differences, suggesting that factors at a local level may play a role in the observed variability. To explain
these differences, research on mortality in small areas is useful to generate hypotheses on potential
causes or risk factors, health resource distribution, and preventive measures [6–8]. In general, the first
stage is the detection of local differences in CVD mortality. If differences are found, a second stage is
carried out to estimate risks and protective factors [9–12].

Int. J. Environ. Res. Public Health 2020, 17, 6583; doi:10.3390/ijerph17186583      www.mdpi.com/journal/ijerph
Int. J. Environ. Res. Public Health 2020, 17, 6583 2 of 16
Using the Analysis Geographic Epidemiologic (AGEPI) mortality program [13–15], we observed
differences in CVD and CED mortalities in the eight municipalities with 25,000 or more inhabitants
in the Castellón province in the Community of Valencia (CV); today a new version is available [16].
There is a difference between these municipalities in their agricultural practice: citrus cultivation is
predominant in all of the municipalities except one, Benicarló, where vegetables, mainly artichokes
(Cynara scolymus), have high production levels. Consumption of vegetables and fruits is associated
with lower all-cause, CVD, CED, and ischaemic heart disease (IHD) mortality [17–19]. Artichokes have
properties, such as lipid and glycemic reduction and high levels of K with a low Na/K index, that may
prevent hypertension and CVD [20,21].
Our hypothesis was that the production of vegetables and artichokes as a proxy of their
consumption is associated with lower CVD and CED mortalities. To test this, we conducted an
ecological study considering all-cause, CVD, CED, and IHD mortalities in eight municipalities in the
Castellón province.
2. Materials and Methods
We conducted an ecological study considering all-cause, CVD, CED, and IHD mortalities during
the period from 1991 to 2011 in the eight municipalities in the province of Castellón with a population
of 25,000 or more inhabitants in 2011. This province is divided into three health departments: Vinaròs
in the north, Castelló de la Plana in the center, and Vila-real in the south, with 90,816, 283,021 and
187,258 inhabitants, respectively.
The municipalities were Almassora (25,945 inhabitants), Benicarló (26,553 inhabitants), Borriana
(27,385 inhabitants), Castelló de la Plana (176,300 inhabitants), Onda (25,704 inhabitants), la Vall d’Uixó
(32,864 inhabitants), Vila-real (51,168 inhabitants), and Vinaròs (28,508 inhabitants). The health care
system was the same in the 8 studied municipalities, and the CVD medical attention was comparable
in the three health departments (Vinaròs, Castelló de la Plana, and Vila-real) with a ratio of 1299, 1497,
and 1538 physicians per 1000 inhabitants, respectively, and a ratio of 1613, 1756, and 2064 nurses per
1000 inhabitants, respectively [22].
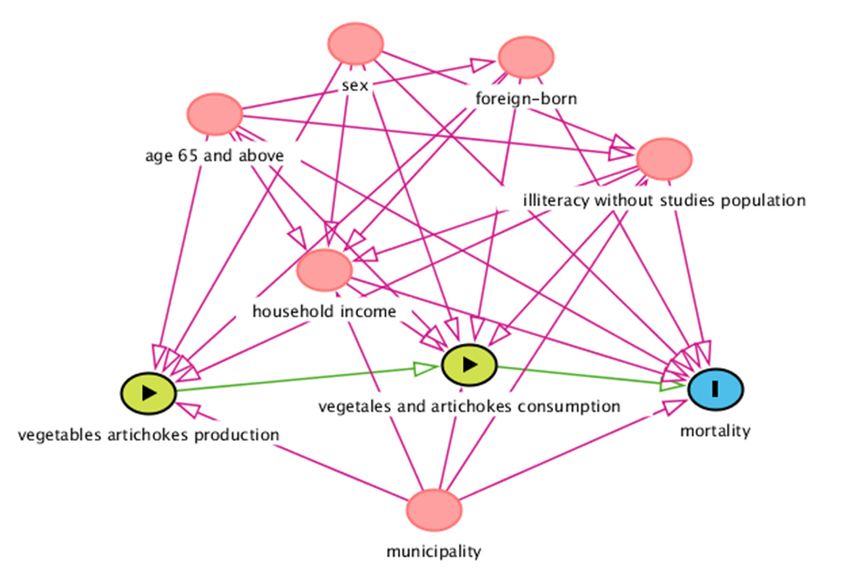
The province of Castellón is located on Spain’s east, Mediterranean coast, with 576,889 inhabitants
and an area of 6612 km2 . The population is concentrated in the north (El Baix-Maestrat), in Benicarló
and Vinaròs, in the central part (La Plana Alta), in the cities of Castelló de la Plana, the administrative
capital, and Almassora, as well as in the southern part (Plana Baixa), in Borriana, Vila-real, la Vall
d’Uixó, and Onda. Almassora and Vila-real are located adjacent to Castelló de la Plana, 5.2 km and
7.6 km apart, respectively, and Borriana is located 11.1 km south of Castelló; all of these municipalities
are on or near the Mediterranean coast. In the interior, la Vall d’Uixó and Onda are located 24.5 km
and 19.3 km from Castelló de la Plana, respectively. Vinaròs and Benicarló are near each other (7.2 km
apart) and are located 70 km and 62.3 km away from Castelló de la Plana, respectively (Figure 1).
Agricultural production is based on citrus fruits in all of these municipalities, with the exception of
Benicarló, where vegetable production predominates with artichokes as the more prevalent vegetable.
Industrial production involving ceramics is located in Vila-real and Onda, and the petro-chemistry
industry is based in Castelló.
The number of CVD, CED, and IHD deaths was obtained from the AGEPI mortality program of
the Conselleria de Sanitat Universal and Salud Pública of the Generalitat Valenciana [13]. The causes
of mortality were coded according to the 9th and 10th International Classification of Diseases (ICD):
CVD (codes 100–199; 390–459); CED (codes 160–169; 430–438); IHD (codes 120–125; 410–419) [23].
We obtained socio-economic and demographic data from the Generalitat Valenciana (Argos,
Banc de dates Territorial) and from the National Statistics Institute (2001–2011 censuses) [24–26].
We collected information on the number of inhabitants, sex distribution, population aged 65 years
and above, foreign-born population, household income in euros, unemployment, illiterate population,
percentages of occupations in agriculture, industry, services, and construction as variables forInt. J. Environ. Res. Public Health 2020, 17, 6583 3 of 16
adjustment, and agricultural production of vegetables, artichokes, and citrus fruits per hectare
perInt.
1000 inhabitants
J. Environ. (median
Res. Public for the
Health 2020, 17, xperiod 2002–2011) as explicative variables. 3 of 16
Figure 1. Geographical locations and populations of the included municipalities.
Figure 1. Geographical locations and populations of the included municipalities.
3. Statistical Methods
The number of CVD, CED, and IHD deaths was obtained from the AGEPI mortality program of
We estimated the smoothed standardized mortality ratios (SMRs) using Clayton and Kaldor’s
the Conselleria de Sanitat Universal and Salud Pública of the Generalitat Valenciana [13]. The causes
methodology [27] and compared the observed mortality with the expected mortality in the CV,
of mortality were coded according to the 9th and 10th International Classification of Diseases (ICD):
and calculated the age-adjusted mortality rate (AMR) by direct standardization of the CV age
CVD (codes 100–199; 390–459); CED (codes 160–169; 430–438); IHD (codes 120–125; 410–419) [23].
distribution per 100,000 inhabitants during the study period [13]. The SMRs were calculated from each
We obtained socio-economic and demographic data from the Generalitat Valenciana (Argos,
of the 8 municipalities’ observed mortality and the expected mortality from Valencia’s population.
Banc de dates Territorial) and from the National Statistics Institute (2001–2011 censuses) [24–26]. We
Given that calculating the SMR is a preferred method to study mortality in small areas [28], we used
collected information on the number of inhabitants, sex distribution, population aged 65 years and
AMR calculation as a sensitivity analysis for the SMR results, considering direction and significance.
above, foreign-born population, household income in euros, unemployment, illiterate population,
Using the Directed Acyclic Graphic (DAG) [29] (Figure 2), we studied the relationship of exposure
percentages of occupations in agriculture, industry, services, and construction as variables for
to agricultural production with all-cause, CVD, CED, and IHD mortality outcomes, and potential
adjustment, and agricultural production of vegetables, artichokes, and citrus fruits per hectare per
confounding factors: sex, population aged 65 years and above, foreign-born, household income,
1000 inhabitants (median for the period 2002–2011) as explicative variables.
illiteracy, and municipality. Other potential confounders such as unemployment, particulate matter
(PM10) and nitrogen dioxide (NO2) levels, coastal proximity, and drinking water hardness were studied.
3. Statistical Methods
We used a multilevel linear regression analysis with municipality as the level variable to estimate
We estimated
associations the smoothed
between mortality standardized
outcomes mortality
and exposure ratios (SMRs)
variables in modelsusing Clayton
adjusted forand Kaldor's
potential
methodology
confounders [27] and
assuming compared
normal datathe observed mortality
distribution. A residual with the expected
interclass mortality
correlation in indicated
(ICC) the CV, and
thecalculated the age-adjusted
total explained variance bymortality
the models. rate We
(AMR)usedbyLog
direct standardization
likelihood, Akaike’sofinformation
the CV age distribution
criterion
andper 100,000 information
Bayesian inhabitants during
criterionthetostudy
checkperiod [13]. TheofSMRs
the goodness fit ofwere calculated
the models. Wefrom each ofthe
estimated the 8
Moran’s I index [30] to evaluate the spatial autocorrelations of the SMRs and AMR among thethat
municipalities' observed mortality and the expected mortality from Valencia's population. Given
calculating and
municipalities the used
SMR Spearman’s
is a preferred method to correlation
nonparametric study mortality in small
to detect areas [28],
relationships amongwe exposure
used AMR
calculation
variables. as a sensitivity
We performed all of analysis for the
the analyses withSMR
Stata ® version
results, considering direction
14 (StataCorp, andStation,
College significance. Using
TX, USA.
No Investigation Review Board approbation was required because all data were anonymous-aggregated to
the Directed Acyclic Graphic (DAG) [29] (Figure 2), we studied the relationship of exposure
dataagricultural production with all-cause, CVD, CED, and IHD mortality outcomes, and potential
of public domain.
confounding factors: sex, population aged 65 years and above, foreign-born, household income,
illiteracy, and municipality. Other potential confounders such as unemployment, particulate matter
(PM10) and nitrogen dioxide (NO2) levels, coastal proximity, and drinking water hardness were
studied.
We used a multilevel linear regression analysis with municipality as the level variable to
estimate associations between mortality outcomes and exposure variables in models adjusted for
potential confounders assuming normal data distribution. A residual interclass correlation (ICC)
indicated the total explained variance by the models. We used Log likelihood, Akaike’s information
criterion and Bayesian information criterion to check the goodness of fit of the models. We estimated
the Moran’s I index [30] to evaluate the spatial autocorrelations of the SMRs and AMR among theInt. J. Environ. Res. Public Health 2020, 17, x 4 of 16
municipalities and used Spearman's nonparametric correlation to detect relationships among
exposure variables. We performed all of the analyses with Stata® version 14 (StataCorp, College
Station, TX, USA. No Investigation Review Board approbation was required because all data were
Int. J. Environ. Res. Public Health 2020, 17, 6583 4 of 16
anonymous-aggregated data of public domain.
Figure2.2.Directed
Figure DirectedAcyclic
AcyclicGraph
Graph(DAG)(DAG)ofofthe
theeffect
effectofofvegetable
vegetableand
andartichoke
artichokeproduction
productionand
and
consumption
consumption(exposure)
(exposure)on
onmortality
mortality(outcome).
(outcome). Ancestors
Ancestors of ofexposure
exposureand
andoutcome
outcome(red
(redcolor).
color).
Based
BasedononDAGitty
DAGittyversion
version3.0.
3.0.( (Johannes
JohannesTextor,
Textor,Nijmegen,
Nijmegen, The
TheNetherlands).
Netherlands).
4.4.Results
Results
The
Thesocio-economic
socio-economic characteristics of theofeight
characteristics the municipalities (Table 1) (Table
eight municipalities indicated1) some important
indicated some
differences.
important differences. Castelló de la Plana, the province capital, was the biggest municipality, the
Castelló de la Plana, the province capital, was the biggest municipality, and Almassora and
smallest.
Almassora Thethe
foreign-born
smallest. Thepopulation was higher
foreign-born in Benicarló
population and lower
was higher in la Vall and
in Benicarló d’Uixó. Household
lower in la Vall
income
d’Uixó.differences
Householdwere incomesmall, but unemployment
differences were small, but wasunemployment
higher in Ondawas andhigher
lowerin inOnda
Benicarló and
and lower
Vinaròs. Industrial
in Benicarló and occupations were more
Vinaròs. Industrial common inwere
occupations Ondamoreand Vila-real.
commonAgricultural
in Onda and hectares per
Vila-real.
inhabitant were higher in Onda and Vinaròs and lower in Castelló. A great contrast
Agricultural hectares per inhabitant were higher in Onda and Vinaròs and lower in Castelló. A great between Benicarló
and the other
contrast cities was
between observed
Benicarló andwhen vegetable
the other citiesand artichoke
was observedproduction levels were
when vegetable andcompared.
artichoke
Benicarló
productionhadlevels
the highest
were level of vegetable
compared. and artichoke
Benicarló had the production,
highest levelwhereas in Onda and
of vegetable and Vila-real,
artichoke
vegetable andwhereas
production, artichokeinproduction
Onda andwere almost
Vila-real, null. Despite
vegetable high citrusproduction
and artichoke productionwere in the province,
almost null.
differences were considerable; Borriana and Vinaròs had the highest production
Despite high citrus production in the province, differences were considerable; Borriana and Vinaròs level and Castelló
the
hadlowest. Out of
the highest the eight municipalities,
production level and Castelló except Onda and
the lowest. OutVall d’Uixó,
of the six were located
eight municipalities, in coastal
except Onda
proximity,
and Vall d’Uixó, six were located in coastal proximity, and all of the municipalitiespresent
and all of the municipalities had a Mediterranean climate, although rains were more had a
inMediterranean
Benicarló and climate,
Vinaròs.although
Water hardness wasmore
rains were elevated in these
present municipalities,
in Benicarló with higher
and Vinaròs. Water levels
hardnessin
Castelló and the lowest in Vinaròs. Air pollution, measured by PM10 and NO2 levels,
was elevated in these municipalities, with higher levels in Castelló and the lowest in Vinaròs. Air was higher in
Almassora and lower in Benicarló and Vinaròs.
pollution, measured by PM10 and NO2 levels, was higher in Almassora and lower in Benicarló and
Spearman correlation coefficients among explicative variables are shown in Table 2. Vegetable
Vinaròs.
and artichoke production levels had strong positive correlations (0.91); artichoke production correlated
negatively with unemployment (−0.92) and positively with coastal distance (0.87). A strong negative
correlation between foreign-born population percentage and unemployment was found (−0.83). Pm10
and NO2 negatively correlated with the percentage of population aged 65 years and above and
agricultural and vegetable production.Int. J. Environ. Res. Public Health 2020, 17, 6583 5 of 16
Table 1. Socio-economic characteristics of the eight municipalities, agricultural production in hectares
per 1000 inhabitants, and environmental indicators (Castellón, 1991–2011 period).
Vall Vila-
Variables Almassora Benicarló Borriana Castelló Onda Vinaròs
d’Uixó Real
Socio-economic indicators
Health departments 2 1 3 2 3 3 3 1
Population 1 17,384 21,015 27,385 150,444 20,021 29,638 42,961 22,960
Population aged 65 years
14.2 17.8 17.1 17.8 15.7 19.1 15.8 18.1
and above %
Foreign-born % 14.8 21.2 15.9 15.9 12.5 7.1 11.8 17.8
Household income in
14,064 13,824 14,077 15,519 13,815 13,754 14,436 14,198
euros
Unemployment % 18.1 15.3 16.8 17.9 21.2 18.67 19.6 15.3
Illiteracy % 32.1 22.6 22.4 20.4 23.3 24.0 24.4 22.9
Occupation %
Agriculture % 3.2 8.8 10.0 2.7 5.9 8.6 4.8 8.7
Industrial % 22.1 18.7 22.7 17.2 33.1 20.5 26.6 16.7
Construction % 11.8 10.1 7.8 6.6 8.7 9.3 8.6 8.2
Services % 62.9 62.4 59.5 73.5 52.3 61.7 60.0 66.4
Agriculture production Ha 2
Agriculture 2 104.3 181.0 130.7 46.0 404.0 189.1 88.8 335.9
Herbaceous 2 8.7 58.9 4.7 7.5 14.6 4.3 4.7 37.0
Woody plants 2 90.0 105.8 122.9 29.2 242.2 77.9 80.2 281.5
Pastures 2 5.8 15.8 3.1 8.1 69.9 106.0 3.9 16.3
Forest species 2 0.15 1.2 0.01 1.21 89.4 0.02 0.0 1.04
Vegetables 3 1.1 64.0 0.9 0.2 0.2 0.3 0.0 10.3
Artichoke 3 0.5 27.4 0.2 0.1 0.0 0.03 0.0 2.8
Citrus 3 94.4 52.3 111.7 21.7 182.7 70.9 76.2 204.6
Environmental indicators
Water hardness in
35.8◦ 35.5◦ 45.8◦ 49.5◦ 48.9◦ 28.9◦ 45.0◦ 30.4◦
French degrees 4
Coastal distance in km 5.0 0.10 5.7 5.0 10.6 20.0 8.4 0.10
PM10 mg/m3 5 36.58 16.03 27.38 29.08 21.93 19.0 6 31.64 16.03
NO2 mg/m3 5 22.7 6.25 16.22 21.49 9.0 6.5 6 19.20 6.25
1 Median population (1991–2011). 2 Land in hectares per 1000 inhabitants: Census 2011. 3 Median hectare production
(2002–2011) per 1000 inhabitants. Portal estadístico Generalitat Valenciana [25]. 4 Annual mean values. Sources:
Facsa and Sorea water distribution companies www.facsa.com www.sorea.cat. 5 Annual mean concentration
(2001–2011). Source: Calidad Ambiental. Generalitat Valenciana [24]. Annual mean concentration (2003–2011).
6 Vall d’Uixó (2010–2011).
The SMRs for all-cause and CVD mortalities are presented in Table 3. For males, the SMR for
all-cause mortality was higher than 100 in all cities except Benicarló. For CVD, CED, IHD, and CVD
plus IHD mortalities, Benicarló had the lowest SMRs and Borriana the highest. Benicarló had SMRs
lower than 100 for all of these diseases. For females, as with males, Benicarló had the lowest SMRs for
all-cause and CVD mortalities. We observed higher differences across the municipalities in the case of
females: Onda had the highest SMR for all-cause mortality, Vila-real had the highest for CVD, Borriana
for CED, and Castelló for IHD.
The AMRs for all-cause and cardiovascular disease mortalities are presented in Table 4. The results
are parallel with the SMRs. For males, Benicarló had the lowest AMRs for all-cause and CVD mortalities,
and Borriana the highest. The AMR differences across the municipalities are elevated, being the highest
for CED and the lowest for IHD. For females, Benicarló had the lowest AMRs for all-cause and CVD
mortalities; Onda had the highest AMRs for all-cause and CVD mortalities, followed by Borriana in
CVD mortality and Castelló in IHD mortality.Int. J. Environ. Res. Public Health 2020, 17, 6583 6 of 16
Table 2. Spearman correlation coefficients among independent variables (Castellón, 1991–2011 period).
Variables (a) (b) (c) (d) (e) (f) (g) (h) (i) (j) (k) (l) (m)
Population aged 65 years and above % (a) 1.0
Household income in euros (b) −0.06 1.0
Foreign-born % (c) 0.16 0.38 1.0
Illiteracy % (d) −0.41 −0.33 −0.71 1.0
Agriculture
0.22 −0.69 −0.17 0.10 1.0
Production 1 (e)
Vegetables 1 (f) 0.22 0.33 0.52 0.10 0.40 1.0
Artichoke 1 (g) 0.25 0.04 0.75 −0.29 0.05 0.91 1.0
Citrus 1 (h) −0.25 −0.12 −0.22 0.24 0.62 0.21 −0.01 1.0
Unemployment % (i) −0.44 −0.57 −0.83 −0.57 0.05 −0.43 −0.92 0.01 1.0
Coastal distance in km (j) −0.11 −0.42 −0.88 0.36 0.14 −0.66 0.87 0.02 0.84 1.0
PM10 mg/m3 /(k) −0.70 0.40 −0.31 0.37 −0.72 −0.56 −0.41 −0.14 0.49 0.25 1.0
NO2 mg/m3 (l) −0.64 0.42 −0.19 0.23 −0.74 −0.54 −0.35 −0.22 0.42 0.19 0.98 1.0
Water hardness 2 (m) −0.54 0.45 0.19 −0.40 0.40 −0.57 −0.41 −0.10 0.29 0.11 0.51 0.59 1.0
1 Land in hectares per 1000 inhabitants. 2 French degrees. Italic: p-value < 0.05; Bold: p-value < 0.01.
Table 3. Smoothed standardized mortality ratios (SMRs): males and females (Castellón, 1991–2011 period).
All-Cause Cardiovascular Cerebrovascular Ischaemic Heart
Municipality CED + IHD
Mortality Disease (CVD) Disease (CED) Disease (IHD)
Males Females Males Females Males Females Males Females Males Females
Almassora 101.2 103.8 99.2 115.5 98.2 98.5 110.2 101.1 103.8 99.1
Benicarló 104.7 111.8 94.9 97.7 75.5 71.4 94.1 82.1 83.3 73.9
Borriana 95.4 101.0 120.6 116.3 137.0 141.6 113.4 97.6 126.5 129.3
Castelló 98.1 107.1 106.4 106.5 100.6 98.9 108.1 117.9 104.1 104.3
Onda 115.2 109.1 111.3 120.2 119.3 133.1 107.2 87.0 104.1 120.1
Vall d’Uixó 108.2 111.7 105.0 116.1 103.8 106.4 107.2 88.2 114.0 101.0
Vila-real 104.1 106.2 113.7 121.0 128.3 138.4 101.3 96.2 115.9 126.4
Vinaròs 100.7 103.0 100.6 102.0 85.4 101.7 109.0 90.9 96.3 98.5Int. J. Environ. Res. Public Health 2020, 17, 6583 7 of 16
Table 4. Age-adjusted mortality rates per 100,000 inhabitants: males and females (Castellón, 1991–2011 period).
All-Cause Cardiovascular Cerebrovascular Ischaemic Heart
Municipality CED + IHD
Mortality Disease (CVD) Disease (CED) Disease (IHD)
Males Females Males Females Males Females Males Females Males Females
Almassora 952.2 866.2 287.7 382.5 80.8 109.8 80.2 46.4 161.1 156.1
Benicarló 891.9 812.0 274.8 335.5 60.7 78.5 68.0 36.2 128.7 114.7
Borriana 1082.9 894.8 350.8 399.0 114.7 159.2 82.5 44.8 197.2 203.4
Castelló 976.5 834.2 378.3 365.8 83.5 110.9 78.5 53.2 162.0 164.1
Onda 977.7 929.0 323.0 414.4 99.2 151.5 77.6 38.5 176.7 190.0
Vall
948.0 885.3 303.7 399.0 85.6 118.6 71.2 39.3 159.9 157.7
d’Uixó
Vila-real 1027.0 925.3 331.2 414.1 106.9 155.7 73.2 43.8 180.1 198.8
Vinaròs 996.4 853.6 292.4 350.2 69.5 113.7 79.5 41.0 148.9 154.6Int. J. Environ. Res. Public Health 2020, 17, 6583 8 of 16
The spatial autocorrelation on SMRs and AMRs was significant for CED plus IHD. CVD was only
found to be significant on SMRs (Table 5).
Table 5. Spatial autocorrelation following Moran’s I index of the smoothed standardized mortality ratios
(SMRs) and age-adjusted mortality rates (AMRs) of the eight municipalities (Castellón, 1991–2011 period).
SMRs Moran’s I Index Z p-Value
All-cause mortality −0.013 0.620 0.268
Cardiovascular (CVD) mortality 0.110 2.015 0.022
Cerebrovascular (CED) mortality 0.073 1.596 0.055
Ischaemic heart disease (IHD) mortality −0.008 0.741 0.229
CED + IHD mortality 0.110 2.052 0.020
AMRs
All-cause mortality 0.006 0.699 0.242
Cardiovascular (CVD) mortality 0.046 1.292 0.098
Cerebrovascular (CED) mortality 0.073 1.199 0.115
Ischaemic heart disease (IHD) mortality 0.006 0.817 0.207
CED + IHD mortality 0.113 2.083 0.019
With the SMRs and AMRs as dependent variables, and agricultural, vegetable, artichoke, and citrus
production as independent variables adjusted for other covariates (Table 6), artichoke production was
associated with lower SMRs or AMRs in all instances.
All-cause mortality was inversely associated with vegetable and artichoke production, but ICCs
were not computable; we found no association between agricultural and citrus production with
all-cause mortality. CVD mortality (SMR) was reduced: −0.19 (95% CI −0.31 to −0.07) for vegetables
and −0.42 (95% CI −0.79 to −0.04) for artichokes per hectare/103 inhabitants, with low ICCs of 0.07 and
0.10, respectively. For CEV, the SMRs were lower: −0.68 (95% CI −1.16 to −0.19) for vegetables and
−1.4 (95% CI −2.57 to −0.36) for artichokes per hectare/103 inhabitants, with high ICCs of 0.72 and
0.73, respectively. Agricultural and citrus production levels were not associated with CVD or CED
mortalities (SMRs). IHD mortality (SMRs) was not associated with any of the independent variables
and ICCs were not computable. For CED plus IHD mortality, when vegetable and artichoke production
increased, the SMRs decreased, with ICCs of 0.59 and 0.61, respectively.
The AMR multilevel linear regression sensitivity analysis results are reported in Table 6. The AMR
results closely resemble those obtained for the SMRs. All causes of mortality were inversely associated
with vegetable and artichoke production, but the ICCs were not computable, and agricultural and
citrus production levels were not associated with all-cause mortality. CVD mortality was not associated
with any of the independent variables. CED mortality was inversely associated with vegetable and
artichoke production with ICCs of 0.39 and 0.41, respectively; agricultural and citrus production levels
were not associated with any change in CED mortality. IHD mortality was inversely associated with
vegetable and artichoke production but ICCs were not computable; agricultural and citrus production
levels were not associated with IHD mortality. CED plus IHD mortality was inversely associated with
vegetable and artichoke production with ICCs of 0.56 and 0.58, respectively. Agricultural and citrus
production levels were not associated with CED plus IHD mortality.Int. J. Environ. Res. Public Health 2020, 17, 6583 9 of 16
Table 6. Multilevel linear regression: smoothed standardized mortality ratio (SMR) and age-adjusted mortality rate (AMR) of mortality among eight municipalities of
the Castellón province. Adjusted models for sex, population aged 65 years and above, foreign-born, household income, illiteracy level, and municipality (Castellón,
1991–2011 period).
Factors SMRs AMR
RC 1 (95% CI 2 ) p-Value ICC 3 (95% CI) RC 1 (95% CI 2 ) p-Value ICC 3 (95% IC)
All-cause mortality
Agriculture 4 −0.01 (−0.04 to 0.43) 0.726 0.24(0.01 to 0.92) 5 −0.04 (−0.27 to 0.20) 0.761 0.25 (0.00–0.91)
Vegetables 4 −0.19 (−0.31 to −0.07) 0.003 NC 6 −1.76 (−2.88 to −0.63) 0.002 NC 6
Artichokes 4 −0.42 (−0.62 to −0.11) 0.003 NC 6 −3.92 (−6.41 to −1.42) 0.002 NC 6
Citrus 4 0.03 (−0.01 to 0.07) 0.196 0.16 (0.00 to 0.97) 5 0.25 (−0.11 to 0.61) 0.178 0.15 (0.00 to 0.97)
Cardiovascular disease (CVD) mortality
Agriculture 4 −0.02 (−0.05 to 0.01) 0.169 0.23 (0.01 to 0.92) −0.05 (−0.17 to 0.06) 0.376 NC 6
Vegetables 4 −0.20 (−0.36 to −0.03) 0.017 0.07(0.00 to 0.99) −0.58 (−1.33 to 0.16) 0.126 NC 6
Artichokes 4 −0.42 (−0.79 to −0.04) 0.028 0.10 (0.00 to 0.99) −1.20 (−2.88 to 0.48) 0.161 NC 6
Citrus 4 0.02 (−0.01 to 0.06) 0.137 0.88 (0.50 to 0.98) −0.02 (−0.22 to 0.18) 0.862 NC 6
Cerebrovascular disease (CED) mortality
Agriculture 4 −0.05 (−0.14 to 0.04) 0.309 0.82 (0.54 to 0.96) −0.04 (−0.14 to 0.05) 0.372 0.62 (0.21 to 0.90)
Vegetables 4 −0.68 (−1.16 to −0.19) 0.006 0.72 (0.33 to 0.93) −0.71 (−1.18 to −0.24) 0.003 0.39 (0.05 to 0.88)
Artichokes 4 −1.47 (−2.57 to −0.36) 0.000 0.73 (0.35 to 0.93) −1.54 (−2.16 to −0.47) 0.005 0.41 (0.06 to 0.88)
Citrus 4 0.04 (−0.13 to 0.21) 0.623 0.84 (0.54 to 0.96) 5 0.05 (−0.12 to 0.22) 0.544 0.64 (0.23 to 0.99)
Ischaemic heart disease (IHD) mortality
Agriculture 4 0.01 (−0.05 to 0.07) 0.771 NC 6 0.01 (−0.02 to 0.03) 0.651 0.19 (0.0 to 0.95)
Vegetables 4 −0.36 (−0.76 to 0.03) 0.067 NC 6 −0.21 (−0.31 to −0.12) 0.000 NC 6
Artichokes 4 −0.78 (−1.65 to 0.10) 0.083 NC 6 −0.46 (−0.68 to −0.25) 0.000 NC 6
Citrus 4 0.30 (−0.07 to 0.14) 0.548 NC 6 0.03 (−0.01 to 0.06) 0.104 0.06 (0.00 to 0.99)
Cerebrovascular disease (CED) and ischaemic heart disease (IHD) mortality
Agriculture 4 −0.02 (−0.10 to 0.05) 0.509 0.80 (0.47 to 0.95) 5 −0.04 (0.15 to 0.08) 0.528 0.80 (0.45 to 0.95) 5
Vegetables 4 −0.57 (−0.89 to −0.26) 0.000 0.59 (0.18 to 0.90) −0.92 (−1.41 to −0.42) 0.000 0.56(0.16 to 0.90)
Artichokes 4 −1.24 (−1.97 to −0.52) 0.001 0.61 (0.20 to 0.91) −2.00 (−3.14 to −0.86) 0.001 0.58 (0.17 to 0.90)
Citrus 4 0.05 (−0.07 to 0.17) 0.434 0.80 (0.47 to 0.95) 5 0.08 (−0.12 to 0.28) 0.421 0.79 (0.44 to 0.95) 5
1 RC = Regression coefficient 2 CI = confidence interval. 3 ICC= interclass correlation 4 Hectare production per 1000 inhabitants. 5 Likelihood ratio test (LRT) value > 0.05 6 . NC = Not computable.Int. J. Environ. Res. Public Health 2020, 17, 6583 10 of 16
5. Discussion
Our results support that the production of vegetables and artichokes may be protective for
CED mortality and, to a lesser extent, for CVD mortality. A non-significant effect was observed in
IHD mortality. All-cause mortality was inversely associated with the production of vegetables and
artichokes, but with a low ICC. By contrast, CVD, CED and IHD mortalities were not associated with
agricultural and citrus production, suggesting some specificity for the estimated protective effects of
vegetables and artichokes.
In the sensitivity analyses of the AMRs, we obtained results similar to the SMRs in respect to CED
and all-cause mortalities, but the CVD mortality association with vegetable and artichoke production
was not significant. The autocorrelation did not indicate a general spatial dependence and other
municipality-related factors could have played a role. Our findings support that SMRs and AMRs may
be adequate for spatial analysis of CED mortality.
CVD is related to many risks and protecting factors, including socio-economic and personal
factors, such as lifestyle, social class, diet, stress, air pollution, health, genetic conditions, and health
care systems [31–36]. In our study, Borriana presented high all-cause, CVD, and CED mortalities;
this situation may be related with the elevated prevalence of type 2 diabetes mellitus and obesity
reported there in a 2006 publication [37]. All-cause, CVD, and CED mortalities have been associated
with blue water and green space [38,39]. In addition, water hardness and CVD mortality’s relationship
has been studied for a long time but controversy remains [40,41]. The hardness of drinking water
(calcium and magnesium concentrations) was associated with CED and IHD mortalities in a study of
CVD at a municipal level in the CV [9]; when the level of magnesium was controlled in the models,
the SMRs of CED mortality increased, which suggested a protecting effect apart from other unknown
factors. Interestingly, psychosocial stress has been shown as a more predominant risk factor in IHD
mortality than in CED. We hypothesize that vegetable and artichoke consumption may be less protective
for psychosocial stress than for CED mortality, therefore, this could explain the non-significant effect
observed on IHD mortality [42].
Regarding the effects of pesticides and fertilizers on CVD mortality [43], the ecological (organic)
agriculture was small in the Castellón province during the 1991–2011 period; the median of hectares
with ecological agriculture of irrigated cultivation of vegetables was 18.33, and this number represented
1.1% of the median of 1740 hectares of irrigated cultivation of vegetables in the eight municipalities
during the same period [44,45].
In our DAG approach, we did not consider factors that were not related to agricultural production.
However, in our multilevel models, we studied other factors, considering their relation to CED
mortality and vegetable and artichoke production, such as unemployment, particulate matter (PM10)
and nitrogen dioxide (NO2) levels, coastal proximity, and drinking water hardness. In all models,
direction and significance were maintained for these factors. Water hardness, air pollution indicators
(PM10 and NO2), and unemployment produced a decline in the protecting effects of the production of
artichokes and vegetables. Water hardness and coastal proximity had fewer effects on the estimates.
Overall, these results suggest that vegetable and artichoke production are protective factors with
independence of some known factors of CVD mortality.
In ecological studies, CVD mortality (CED, IHD, and hypertensive disease) has been associated
with social inequalities and low socio-economic levels [46,47], and low mortality has been observed in
rural non-metropolitan counties with agricultural production in the United States [48]. Changes in
agricultural production, food processing, and diet in European Mediterranean countries have been
related to an increase in CVD incidence [49]. In our study, all-cause, CVD, and CED mortalities
were lower with the presence of vegetable and artichoke production, but we found no changes in
mortality related to agricultural or citrus production. The largest decline in CVD and CED mortalities
associated with artichokes and vegetables production was found in Benicarló. Lower IHD mortality
has been associated with fruit and vegetable consumption [50], but not in our study and others [51].
The eight municipalities in our study had differences in agricultural production which may explainInt. J. Environ. Res. Public Health 2020, 17, 6583 11 of 16
CVD mortality variations. In general, a diet with vegetables and fruits is associated with lower
all-cause, CVD, and CED mortalities [52–55]. Apart from artichokes, vegetable cultivation included
salads, cauliflowers, cabbages, tomatoes, and onions. Specifically, the consumption of vegetables,
including that of cruciferous vegetables (i.e., cauliflowers and cabbages, among others), has been
associated with a decline of all-cause, CVD, and CED mortalities. Physiologically, protective effects
associated with vegetables include anti-oxidant and anti-inflammatory actions, inhibition of platelet
aggregation, lowering of blood pressure, and glucose and lipid metabolism regulation [18,56,57].
Artichokes have several healthy properties including antioxidant activity, lipid and cholesterol
reduction, and a decrease in postprandial glycemic and insulin response [58–60]. Components of artichokes
which have an effect are caffeic acid derivatives, flavonoids, such as luteolin, cynaroside, scolymoside,
and cynarotrioside and sesquiterpenic lactones; artichokes decrease production of cholesterol and
endogenous triglycerides and increase their excretion by bile production [21,61,62]. In several clinical trials,
reductions in cholesterol levels were found but more studies are needed [63–66]. In addition, improved
hypertension, body mass index, cardio-metabolic parameters, and hepato-protective effects have been
observed [67–69]. Artichoke extract may be relevant as a therapeutic factor for atherosclerosis due to it
lowering the rates of low-density-lipoprotein cholesterol and by its antioxidant, anti-inflammatory,
and nitric oxide regulation effects [70–75].
We hypothesized that the production of vegetables and artichokes may be a proxy of their
consumption in our ecological approach. Considering the high production of vegetables and artichokes
in Benicarló, it is plausible that vegetable and artichoke consumption may be more elevated than
in the other municipalities due to higher accessibility, lower price, different diet habits related with
own vegetable production, and the elevated proportion of people with agricultural occupations.
More than 200 farmers of Benicarló, Vinaròs, and neighboring towns work in the cultivation of
artichokes. In addition, since 1998, the artichoke of Benicarló is an appellation of origin, and since
2003, it holds a Denomination of Protected Origin of the European Commission. A week of artichoke
consumption has been celebrated each year since 1993 where artichoke culinary recipes are presented
in many restaurants of Benicarló as a part of a multitudinous set of events with artichokes as the
protagonist [76,77]. On the other hand, agricultural lands are well distributed with small exploitations,
which have a mean of 5.47 hectares per owner in the CV with a Gini index of 0.45 [78]. In the eight
municipalities, the median of farm surface per owner was 3.70 hectares (rank 2.06 Castelló de la
Plana, 9.97 Benicarló). The health effects of gardening have been indicated and Benicarló has a high
agricultural occupation percentage [79].
The study limitations include its ecological design with aggregate data susceptible to ecological
fallacy. In addition, other potential confounders related with CVD mortality, such as existing
co-morbidities and family history of CVD of this population, were not studied, which we could
consider another limitation of our study. However, we obtained similar results with the AMR
sensitivity analysis. We assumed that the production of vegetables and artichokes was a proxy of their
consumption but studies to verify this point are necessary. Our retrospective approach could increase
potential bias; there were few socio-economic data at a municipal level; some residual confounding
could affect our estimates, some differences among municipalities may persist, genetic predisposition to
CVD of the population [80] was not studied, and finally, we cannot discard the impact of unmeasured
or unknown factors.
A strength of the study is that CVD was estimated by SMRs and AMRs in a substantial twenty-year
period; the study encompassed relatively small areas with similar climates and small socio-economic
differences, and we used multilevel models to adjust for variables considered to be potential confounders
and other unknown municipality related effects.
Our new research proposal includes a cross-sectional survey of a representative sample in
each municipality to obtain a background of CVD risk factors and co-morbidities, jointly with food
consumption, diet, habits, and demographic characteristics as a first step. The survey’s results could
support the relationship between the consumption of vegetables and artichokes and CVD and CEDInt. J. Environ. Res. Public Health 2020, 17, 6583 12 of 16
mortalities, and it could facilitate the rationale for accurate preventive strategies. As a second step,
we recommend a properly powered cohort approach with sufficient follow-up on a population-based
study of the first step.
6. Conclusions
Our study suggests that the production of vegetables and artichokes may be a protective factor of
CED and CVD mortality. Our recommendation is to continue this research using a cohort approach in
the eight municipalities.
Author Contributions: Conceptualization, A.A.-P., J.B.-B., M.R.P.-S., M.A.R.-G.; Methodology, J.P.-B., J.B.-B.,
F.G.-G.; validation, J.P.-B., M.A.R.-G.; Formal analysis, A.A.-P., M.R.P.-S., J.P.-B.; Writing—Original draft preparation,
A.A.-P., J.P.-B., M.A.R.-G.; Writing—Review and editing, A.A.-P., J.P.-B., J.B.-B., F.G.-G., M.R.P.-S.; supervision,
J.P.-B., M.A.R.-G., F.G.-G. All authors have read and agreed to the published version of the manuscript.
Funding: This research received no external funding.
Acknowledgments: We thank Claudia Arnedo-Pac, José Antonio Valer-Ratera, Lourdes Safont-Adsuara,
Ana Vizcaino-Batllés, Noemi Messeguer-Ferrer N, and Juan Carlos Gascó-Laborda for their help during the
preparation of this study.
Conflicts of Interest: The authors declare no conflict of interest.
References
1. Harper, S.; Lynch, J.; Smith, G.D. Social determinants and the decline of cardiovascular diseases:
Understanding the links. Annu. Rev. Public Health 2011, 32, 39–69. [CrossRef] [PubMed]
2. Ezzati, M.; Obermeyer, Z.; Tzoulaki, I.; Mayosi, B.M.; Elliott, P.; Leon, D.A. Contributions of risk factors and
medical care to cardiovascular mortality trends. Nat. Rev. Cardiol. 2015, 12, 508–530. [CrossRef] [PubMed]
3. Kim, K.; Hyeon, J.; Lee, S.A.; Kwon, S.O.; Lee, H.; Keum, N.; Lee, J.K.; Park, S.M. Role of total, red, processed,
and white meat consumption in stroke incidence and mortality: A systematic review and meta-analysis of
prospective cohort studies. J. Am. Heart Assoc. 2017, 6, e005983. [CrossRef] [PubMed]
4. Meier, T.; Gräfe, K.; Senn, F.; Sur, P.; Stangl, G.I.; Dawczynski, C.; März, W.; Kleber, M.E.; Lorkowski, S.
Cardiovascular mortality attributable to dietary risk factors in 51 countries in the WHO European Region
from 1990 to 2016: A systematic analysis of the Global Burden of Disease Study. Eur. J. Epidemiol. 2019, 34,
37–55. [CrossRef]
5. Grau, M.; Elosua, R.; Cabrera de León, A.; Guembe, M.J.; Baena-Díez, J.M.; Vega Alonso, T.; Javier Félix, F.;
Zorrilla, B.; Rigo, F.; Lapetra, J.; et al. Factores de riesgo cardiovascular en España en la primera década del
siglo xxi: Análisis agrupado con datos individuales de 11 estudios de base poblacional, estudio DARIOS.
Rev. Esp. Cardiol. 2011, 64, 295–304. [CrossRef]
6. Roth, G.A.; Dwyer-Lindgren, L.; Bertozzi-Villa, A.; Stubbs, R.W.; Morozoff, C.; Naghavi, M.; Mokdad, A.H.;
Murray, C.J.L. Trends and patterns of geographic variation in cardiovascular mortality among US counties,
1980–2014. JAMA 2017, 317, 1976–1992. [CrossRef]
7. Mena, C.; Sepúlveda, C.; Fuentes, E.; Ormazábal, Y.; Palomo, I. Spatial analysis for the epidemiological study
of cardiovascular diseases: A systematic literature search. Geospat. Health 2018, 13, 587. [CrossRef]
8. Rajabi, M.; Mansourian, A.; Pilesjö, P.; Åström, D.O.; Cederin, K.; Sundquist, K. Exploring spatial patterns of
cardiovascular disease in Sweden between 2000 and 2010. Scand. J. Public Health 2018, 46, 647–658. [CrossRef]
9. Ferrandiz, J.; Abellan, J.J.; Gomez-Rubio, V.; Lopez-Quilez, A.; Sanmartin, P.; Abellan, C.; Martinez-Beneito, M.A.;
Melchor, I.; Vanaclocha, H.; Zurriaga, O.; et al. Spatial analysis of the relationship between mortality from
cardiovascular and cerebrovascular disease and drinking water hardness. Environ. Health Perspect. 2004, 112,
1037–1044. [CrossRef]
10. Maheswaran, R.; Haining, R.P.; Brindley, P.; Law, J.; Pearson, T.; Fryers, P.R.; Wise, S.; Campbell, M.J. Outdoor
air pollution and stroke in Sheffield, United Kingdom: A small-area level geographical study. Stroke 2005, 36,
239–243. [CrossRef]
11. Gómez-Barroso, D.; Prieto-Flores, M.E.; Mellado San Gabino, A.; Moreno Jiménez, A. Análisis espacial de la
mortalidad por enfermedades cardiovasculares en la ciudad de Madrid, España. Rev. Esp. Salud Publica
2015, 89, 27–37. [CrossRef] [PubMed]Int. J. Environ. Res. Public Health 2020, 17, 6583 13 of 16
12. Wróblewska, W. Territorial variation in mortality from causes amenable to medical care in Poland. Ann. Agric.
Environ. Med. 2017, 24, 489–495. [CrossRef] [PubMed]
13. AGEPI: Analisis Geográfico Epidemiológico. Programa de Mortalidad de la Comunidad Valenciana. Valencia
Conselleria de Sanitat 2005. Available online: http://www.agepi.es (accessed on 11 July 2017).
14. Lopez-Quilez, A.; Verdejo, F.; Zurriaga, O.; Botella, P.; Vanaclocha, H.; Martinez-Beneito, M.A.; Amador, A.
AGEPI (Analisis Geografico Epidemiologico): Una herramienta para cartografia de enfermedades. Logroño:
XXIV Reunión de la Sociedad Española de Epidemiología 2006. Gac. Sanit. 2006, 20, 78.
15. Martinez-Beneito, M.A.; Lopez-Quiles, A.; Amador-Iscla, A.; Melchor-Alos, I.; Botella-Rocamora, P.;
Abellan-Andres, C.; Abellan-Andres, J.J.; Verdejo-Mañez, F.; Zurriaga-Lloréns, O.; Vanaclocha-Lina, H.; et al.
Altas de mortalidad de la Comunidad Valenciana. 1991–2000. Valencia Generaliata Valenciana. Coselleria
de Sanitat. 2005. Available online: http://san.gva.es/publicaciones/documentos/V.5093-2005.pdf (accessed on
8 September 2020).
16. Corpas-Burgos, F.; Vergara-Hernandez, Botella-Rocamora, P.; Perez-Panades, J.; Perpiñan-Faubel, H.;
Martinez-Beneito, M.A. Atlas nacional de mortalidad de España (ANDEES). FISABIO-Generalidad Valenciana
2020. Available online: http://fisabio.san.gva.es/desigualdades-en-salud. (accessed on 8 September 2020).
17. Aune, D.; Giovannucci, E.; Boffetta, P.; Fadnes, L.T.; Keum, N.; Norat, T.; Greenwood, D.C.; Riboli, E.; Vatten, L.J.;
Tonstad, S. Fruit and vegetable intake and the risk of cardiovascular disease, total cancer and all-cause mortality-a
systematic review and dose-response meta-analysis of prospective studies. Int. J. Epidemiol. 2017, 46, 1029–1056.
[CrossRef] [PubMed]
18. Conrad, Z.; Thomson, J.; Jahns, L. Prospective analysis of vegetable amount and variety on the risk of
all-cause and cause-specific mortality among US adults, 1999–2011. Nutrients 2018, 10, 1377. [CrossRef]
19. Tang, G.Y.; Meng, X.; Li, Y.; Zhao, C.N.; Liu, Q.; Li, H.B. Effects of vegetables on cardiovascular diseases and
related mechanisms. Nutrients 2017, 9, 857. [CrossRef]
20. Pandino, G.; Lombardo, S.; Mauromicale, G. Mineral profile in globe artichoke as affected by genotype, head
part and environment. J. Sci. Food Agric. 2011, 91, 302–308. [CrossRef]
21. Rondanelli, M.; Giacosa, A.; Morazzoni, P.; Guido, D.; Grassi, M.; Morandi, G.; Bologna, C.; Riva, A.;
Allegrini, P.; Perna, S. MediterrAsian diet products that could raise HDL-cholesterol: A systematic review.
Biomed. Res. Int. 2016, 2016, 2025687. [CrossRef]
22. Ministerio de Sanidad, Consumo y Bienestar Social. Madrid 2008. Available online: https://www.mscbs.gob.
es/estadEstudios/estadisticas/estadisticas/estMinisterio/SIAP/Estadisticas.htm/ (accessed on 20 August 2020).
23. World Health Organization. The International Classification of Diseases (ICD) 9th and 10th Edition; World Health
Organization: Geneva, Switzerland, 2010.
24. Argos. Banco de Datos Municipales. Valencia: Generalitat Valenciana. Available online: www.argos.gva.es
(accessed on 22 January 2020).
25. Generalitat Valenciana: Portal Estadístico. Banco de Datos de Series. Municipios y Comarcas. Banco de
Datos Territorial. Available online: http://www.pegv.gva.es/es/bdt (accessed on 21 January 2020).
26. Instituto Nacional de Estadística. Censos de Población y Viviendas 2001–2011. Madrid: Instituto Nacional
de Estadistica. Available online: www.ine.es (accessed on 8 January 2020).
27. Clayton, D.; Kaldor, J. Empirical Bayes estimates of age-standarized relative risks for use in disease mapping.
Biometrics 1987, 43, 671–681. [CrossRef]
28. Mollié, A. Bayesian mapping of Hodgkin’s disease in France. In Spacial Epidemiology: Methods and Applications;
Elliot, P., Wakefield, J., Best, N., Briggs, D., Eds.; Oxford University Press: New York, NY, USA, 2001;
pp. 267–285.
29. Textor, J.; Van der Zander, B.; Gilthorpe, M.K.; Liskiewicz, M.; Ellison, G.T.H. Robust causal inference using
directed acyclic graphs: The R package ‘dagitty’. Int. J. Epidemiol. 2016, 45, 1887–1894. [CrossRef]
30. Moran, P.A.P. The interpretation of statistical maps. J. R. Stat. Soc. Ser. B 1948, 10, 243–251. [CrossRef]
31. Francula-Zaninovic, S.; Nola, I.A. Management of measurable variable cardiovascular disease’ risk factors.
Curr. Cardiol. Rev. 2018, 14, 153–163. [CrossRef]
32. Orozco-Beltran, D.; Gil-Guillen, V.F.; Redon, J.; Martin-Moreno, J.M.; Pallares-Carratala, V.; Navarro-Perez, J.;
Valls-Roca, F.; Sanchis-Domenech, C.; Fernandez-Gimenez, A.; Perez-Navarro, A.; et al. Lipid profile,
cardiovascular disease and mortality in a Mediterranean high-risk population: The ESCARVAL-RISK study.
PLoS ONE 2017, 12, e0186196. [CrossRef] [PubMed]Int. J. Environ. Res. Public Health 2020, 17, 6583 14 of 16
33. Appelman, Y.; Van Rijn, B.B.; Ten Haaf, M.E.; Boersma, E.; Peters, S.A. Sex differences in cardiovascular risk
factors and disease prevention. Atherosclerosis 2015, 241, 211–218. [CrossRef]
34. Fiordelisi, A.; Piscitelli, P.; Trimarco, B.; Coscioni, E.; Iaccarino, G.; Sorriento, D. The mechanisms of air
pollution and particulate matter in cardiovascular diseases. Heart Fail. Rev. 2017, 22, 337–347. [CrossRef]
[PubMed]
35. Rajagopalan, S.; Al-Kindi, S.G.; Brook, R.D. Air pollution and cardiovascular disease: JACC State-of-the-Art
Review. J. Am. Coll. Cardiol. 2018, 72, 2054–2070. [CrossRef]
36. Martínez-García, M.; Salinas-Ortega, M.; Estrada-Arriaga, I.; Hernández-Lemus, E.; García-Herrera, R.;
Vallejo, M. A systematic approach to analyze the social determinants of cardiovascular disease. PLoS ONE
2018, 13, e0190960. [CrossRef]
37. Pallares-Carratala, V.; Piñón-Selles, F.; Diago-Torrent, J.L.; en nombre de los investigadores del estudio
Burriana. Diabetes mellitus y otros factores de riesgo cardiovascular mayores en una población del
Mediterraneo español. Estudio Burriana. Endocrinol. Nutr. 2006, 53, 158–167. [CrossRef]
38. Crouse, D.L.; Balram, A.; Hystad, P.; Pinault, L.; Van den Bosch, M.; Chen, H.; Rainham, D.; Thomson, E.M.;
Close, C.H.; Van Donkelaar, A.; et al. Associations between living near water and risk of mortality among
urban Canadians. Environ. Health Perspect. 2018, 126, 077008. [CrossRef]
39. Nieuwenhuijsen, M.J.; Gascon, M.; Martinez, D.; Ponjoan, A.; Blanch, J.; Garcia-Gil, M.D.M.; Ramos, R.;
Foraster, M.; Mueller, N.; Espinosa, A.; et al. Air pollution, noise, blue space, and green space and premature
mortality in Barcelona: A mega cohort. Int. J. Environ. Res. Public Health 2018, 15, 2405. [CrossRef]
40. Leurs, L.J.; Schouten, L.J.; Mons, M.N.; Goldbohm, R.A.; Van den Brandt, P.A. Relationship between tap
water hardness, magnesium, and calcium concentration and mortality due to ischemic heart disease or stroke
in The Netherlands. Environ. Health Perspect. 2010, 118, 414–420. [CrossRef] [PubMed]
41. Sengupta, P. Potential health impacts of hard water. Int. J. Prev. Med. 2013, 4, 866–875.
42. Fioranelli, M.; Bottaccioli, A.G.; Bottaccioli, F.; Bianchi, M.; Rovesti, M.; Roccia, M.G. Stress and inflammation
in coronary artery disease: A review psychoneuroendocrineimmunology-based. Front. Immunol. 2018, 9,
2031. [CrossRef]
43. Sekhotha, M.M.; Monyeki, K.D.; Sibuyi, M.E. Exposure to agrochemicals and cardiovascular disease: A review.
Int. J. Environ. Res. Public Health 2016, 13, 229. [CrossRef]
44. Comité d’Agricultura Ecológica de la Comunitat Valenciana. Estadisticas. Hectareas de Producción.
Available online: https://www.caecv.com/ (accessed on 21 August 2020).
45. Portal Estadístico de la Generalitat Valenciana. Superficies de Cultivo de Hortalizas de Regadío Por Municipio
2002–2011. Available online: http://www.pegv.gva.es/es/bdt (accessed on 21 August 2020).
46. Cardona, D.; Cerezo Mdel, P.; Parra, H.; Quintero, L.; Muñoz, L.; Cifuentes, O.L.; Vélez, S.C. Desigualdades
en la mortalidad por enfermedades cardiovasculares en los municipios del Eje Cafetero, 2009–2011. Biomedica
2015, 35, 379–394. [CrossRef] [PubMed]
47. Karp, D.N.; Wolff, C.S.; Wiebe, D.J.; Branas, C.C.; Carr, B.G.; Mullen, M.T. Reassessing the stroke belt: Using
small area spatial statistics to identify clusters of high stroke mortality in the United States. Stroke 2016, 47,
1939–1942. [CrossRef] [PubMed]
48. Hendryx, M.; Fedorko, E.; Halverson, J. Pollution sources and mortality rates across rural-urban areas in the
United States. J. Rural Health 2010, 26, 383–391. [CrossRef]
49. Ghebremeskel, K.; Crawford, M.A. Nutrition and health in relation to food production and processing. Nutr. Health
1994, 9, 237–253. [CrossRef]
50. Bhupathiraju, S.N.; Wedick, N.M.; Pan, A.; Manson, J.E.; Rexrode, K.M.; Willett, W.C.; Rimm, E.B.; Hu, F.B.
Quantity and variety in fruit and vegetable intake and risk of coronary heart disease. Am. J. Clin. Nutr. 2013,
98, 1514–1523. [CrossRef]
51. Besson, H.; Paccaud, F.; Marques-Vidal, P. Ecologic correlations of selected food groups with disease incidence
and mortality in Switzerland. J. Epidemiol. 2013, 23, 466–473. [CrossRef]
52. Atkins, J.L.; Whincup, P.H.; Morris, R.W.; Lennon, L.T.; Papacosta, O.; Wannamethee, S.G. Dietary patterns
and the risk of CVD and all-cause mortality in older British men. Br. J. Nutr 2016, 116, 1246–1255. [CrossRef]
[PubMed]
53. Price, H.C.; Nicholls, A. Primary prevention of CVD: Diet. BMJ Clin. Evid. 2014, 2014, 0219. [PubMed]Int. J. Environ. Res. Public Health 2020, 17, 6583 15 of 16
54. Misirli, G.; Benetou, V.; Lagiou, P.; Bamia, C.; Trichopoulos, D.; Trichopoulou, A. Relation of the traditional
Mediterranean diet to cerebrovascular disease in a Mediterranean population. Am. J. Epidemiol. 2012, 176,
1185–1192. [CrossRef] [PubMed]
55. Gillman, M.W.; Cupples, L.A.; Gagnon, D.; Posner, B.M.; Ellison, R.C.; Castelli, W.P.; Wolf, P.A. Protective
effect of fruits and vegetables on development of stroke in men. JAMA 1995, 273, 1113–1117. [CrossRef]
[PubMed]
56. Mori, N.; Shimazu, T.; Charvat, H.; Mutoh, M.; Sawada, N.; Iwasaki, M.; Yamaji, T.; Inoue, M.; Goto, A.;
Takachi, R.; et al. Cruciferous vegetable intake and mortality in middle-aged adults: A prospective cohort
study. Clin. Nutr. 2019, 38, 631–643. [CrossRef]
57. Miller, V.; Mente, A.; Dehghan, M.; Rangarajan, S.; Zhang, X.; Swaminathan, S.; Dagenais, G.; Gupta, R.;
Mohan, V.; Lear, S.; et al. Fruit, vegetable, and legume intake, and cardiovascular disease and deaths in 18
countries (PURE): A prospective cohort study. Lancet 2017, 390, 2037–2049. [CrossRef]
58. Banach, M.; Patti, A.M.; Giglio, R.V.; Cicero, A.F.G.; Atanasov, A.G.; Bajraktari, G.; Bruckert, E.; Descamps, O.;
Djuric, D.M.; Ezhov, M.; et al. The role of nutraceuticals in statin intolerant patients. J. Am. Coll Cardiol. 2018,
72, 96–118. [CrossRef]
59. Ben Salem, M.; Affes, H.; Ksouda, K.; Dhouibi, R.; Sahnoun, Z.; Hammami, S.; Zeghal, K.M. Pharmacological
studies of artichoke leaf extract and their health benefits. Plant. Foods Hum. Nutr. 2015, 70, 441–453.
[CrossRef]
60. Ben Salem, M.; Affes, H.; Dhouibi, R.; Charfi, S.; Turki, M.; Hammami, S.; Ayedi, F.; Sahnoun, Z.; Zeghal, K.M.;
Ksouda, K. Effect of artichoke (Cynara scolymus) on cardiac markers, lipid profile and antioxidants levels in
tissue of HFD-induced obesity. Arch. Physiol. Biochem. 2019, 1–7. [CrossRef]
61. Rondanelli, M.; Monteferrario, F.; Perna, S.; Faliva, M.A.; Opizzi, A. Health-promoting properties of artichoke
in preventing cardiovascular disease by its lipidic and glycemic-reducing action. Monaldi Arch. Chest Dis.
2013, 80, 17–26. [CrossRef]
62. Cicero, A.F.G.; Fogacci, F.; Bove, M.; Giovannini, M.; Veronesi, M.; Borghi, C. Short-Term effects of dry extracts
of artichokeand berberis in hypercholesterolemic patients without cardiovascular disease. Am. J. Cardiol. 2019,
123, 588–591. [CrossRef]
63. Pittler, M.H.; Thompson, C.O.; Ernst, E. Artichoke leaf extract for treating hypercholesterolaemia. Cochrane
Database Syst. Rev. 2002, 3, CD003335.
64. Wider, B.; Pittler, M.H.; Thompson-Coon, J.; Ernst, E. Artichoke leaf extract for treating hypercholesterolaemia.
Cochrane Database Syst. Rev. 2009, 4, CD003335.
65. Wider, B.; Pittler, M.H.; Thompson-Coon, J.; Ernst, E. Artichoke leaf extract for treating hypercholesterolaemia.
Cochrane Database Syst. Rev. 2013, 3, CD003335.
66. Santos, H.O.; Bueno, A.A.; Mota, J.F. The effect of artichoke on lipid profile: A review of possible mechanisms
of action. Pharmacol. Res. 2018, 137, 170–178. [CrossRef]
67. Roghani-Dehkordi, F.; Kamkhah, A.F. Artichoke leaf juice contains antihypertensive effect in patients with
mild hypertension. J. Diet. Suppl. 2009, 6, 328–341. [CrossRef]
68. Khan, M.Y.; Kumar, V. Mechanism & inhibition kinetics of bioassay-guided fractions of Indian medicinal
plants and foods as ACE inhibitors. J. Tradit. Complement Med. 2018, 9, 73–84.
69. Ardalani, H.; Jandaghi, P.; Meraji, A.; Hassanpour Moghadam, M. The Effect of Cynara scolymus on blood
pressure and BMI in hypertensive patients: A randomized, double-blind, placebo-controlled, clinical trial.
Complement Med. Res. 2019, 27, 40–46. [CrossRef]
70. Castellino, G.; Nikolic, D.; Magán-Fernández, A.; Malfa, G.A.; Chianetta, R.; Patti, A.M.; Amato, A.;
Montalto, G.; Toth, P.P.; Banach, M.; et al. Altilix®supplement containing chlorogenic acid and luteolin
improved hepatic and cardiometabolic parameters in subjects with metabolic syndrome: A 6 month
randomized, double-blind, placebo-controlled study. Nutrients 2019, 25, 2580. [CrossRef]
71. Bjørklund, G.; Dadar, M.; Martins, N.; Chirumbolo, S.; Goh, B.H.; Smetanina, K.; Lysiuk, R. Brief challenges
on medicinal plants: An eye-opening look at ageing-related disorders. Basic. Clin. Pharmacol. Toxicol. 2018,
122, 539–558. [CrossRef]
72. D’Antuono, I.; Carola, A.; Sena, L.M.; Linsalata, V.; Cardinali, A.; Logrieco, A.F.; Colucci, M.G.; Apone, F.
Artichoke polyphenols produce skin anti-Age effects by improving endothelial cell integrity and functionality.
Molecules 2018, 23, 2729. [CrossRef] [PubMed]You can also read