Association of Neurocognitive and Physical Function With Gait Speed in Midlife - Townnews
←
→
Page content transcription
If your browser does not render page correctly, please read the page content below
Original Investigation | Neurology

          Association of Neurocognitive and Physical Function
          With Gait Speed in Midlife
          Line Jee Hartmann Rasmussen, PhD; Avshalom Caspi, PhD; Antony Ambler, MSc; Jonathan M. Broadbent, PhD; Harvey J. Cohen, MD; Tracy d’Arbeloff, BA;
          Maxwell Elliott, BS; Robert J. Hancox, MD; HonaLee Harrington, BA; Sean Hogan, BA; Renate Houts, PhD; David Ireland, PhD; Annchen R. Knodt, MSc;
          Kim Meredith-Jones, PhD; Miriam C. Morey, PhD; Lynda Morrison, BSc; Richie Poulton, PhD; Sandhya Ramrakha, PhD; Leah Richmond-Rakerd, PhD;
          Maria L. Sison, BS; Kate Sneddon, PhD; W. Murray Thomson, PhD; Ahmad R. Hariri, PhD; Terrie E. Moffitt, PhD

          Abstract                                                                                                            Key Points
                                                                                                                              Question Is gait speed measured at age
          IMPORTANCE Gait speed is a well-known indicator of risk of functional decline and mortality in
                                                                                                                              45 years associated with accelerated
          older adults, but little is known about the factors associated with gait speed earlier in life.
                                                                                                                              biological aging, neurocognitive
                                                                                                                              function, and cognitive decline?
          OBJECTIVES To test the hypothesis that slow gait speed reflects accelerated biological aging at
          midlife, as well as poor neurocognitive functioning in childhood and cognitive decline from childhood               Findings In this 5-decade cohort study
          to midlife.                                                                                                         of 904 participants in New Zealand,
                                                                                                                              physical and biological indicators of
          DESIGN, SETTING, AND PARTICIPANTS This cohort study uses data from the Dunedin                                      accelerated aging, including
          Multidisciplinary Health and Development Study, a population-based study of a representative 1972                   compromised brain integrity (eg,
          to 1973 birth cohort in New Zealand that observed participants to age 45 years (until April 2019).                  reduced brain volume and cortical
          Data analysis was performed from April to June 2019.                                                                thickness), were associated with slow
                                                                                                                              gait measured at age 45 years. Lifelong
          EXPOSURES Childhood neurocognitive functions and accelerated aging, brain structure, and                            compromised brain health—including
          concurrent physical and cognitive functions in adulthood.                                                           poor neurocognitive functioning as early
                                                                                                                              as age 3 years and childhood-to-
          MAIN OUTCOMES AND MEASURES Gait speed at age 45 years, measured under 3 walking                                     adulthood decline in cognitive
          conditions: usual, dual task, and maximum gait speeds.                                                              functioning—was associated with slower
                                                                                                                              gait at midlife.
          RESULTS Of the 1037 original participants (91% of eligible births; 535 [51.6%] male), 997 were alive
                                                                                                                              Meaning Gait speed at midlife may be a
          at age 45 years, of whom 904 (90.7%) had gait speed measured (455 [50.3%] male; 93% white).
                                                                                                                              summary index of lifelong aging with
          The mean (SD) gait speeds were 1.30 (0.17) m/s for usual gait, 1.16 (0.23) m/s for dual task gait, and
                                                                                                                              possible origins in childhood central
          1.99 (0.29) m/s for maximum gait. Adults with more physical limitations (standardized regression
                                                                                                                              nervous system deficits.
          coefficient [β], −0.27; 95% CI, −0.34 to −0.21; P < .001), poorer physical functions (ie, weak grip
          strength [β, 0.36; 95% CI, 0.25 to 0.46], poor balance [β, 0.28; 95% CI, 0.21 to 0.34], poor visual-
          motor coordination [β, 0.24; 95% CI, 0.17 to 0.30], and poor performance on the chair-stand [β,                   + Invited Commentary
          0.34; 95% CI, 0.27 to 0.40] or 2-minute step tests [β, 0.33; 95% CI, 0.27 to 0.39]; all P < .001),
          accelerated biological aging across multiple organ systems (β, −0.33; 95% CI, −0.40 to −0.27;
                                                                                                                            + Supplemental content
                                                                                                                            Author affiliations and article information are
          P < .001), older facial appearance (β, −0.25; 95% CI, −0.31 to −0.18; P < .001), smaller brain volume
                                                                                                                            listed at the end of this article.
          (β, 0.15; 95% CI, 0.06 to 0.23; P < .001), more cortical thinning (β, 0.09; 95% CI, 0.02 to 0.16;
          P = .01), smaller cortical surface area (β, 0.13; 95% CI, 0.04 to 0.21; P = .003), and more white matter
          hyperintensities (β, −0.09; 95% CI, −0.15 to −0.02; P = .01) had slower gait speed. Participants with
          lower IQ in midlife (β, 0.38; 95% CI, 0.32 to 0.44; P < .001) and participants who exhibited cognitive
          decline from childhood to adulthood (β, 0.10; 95% CI, 0.04 to 0.17; P < .001) had slower gait at age
          45 years. Those with poor neurocognitive functioning as early as age 3 years had slower gait in midlife
          (β, 0.26; 95% CI, 0.20 to 0.32; P < .001).

                                                                                                             (continued)

             Open Access. This is an open access article distributed under the terms of the CC-BY License.

          JAMA Network Open. 2019;2(10):e1913123. doi:10.1001/jamanetworkopen.2019.13123 (Reprinted)                                                  October 11, 2019        1/15

Downloaded From: https://jamanetwork.com/ on 10/11/2019
JAMA Network Open | Neurology                                                          Association of Neurocognitive and Physical Function With Gait Speed in Midlife

          Abstract (continued)

          CONCLUSIONS AND RELEVANCE Adults’ gait speed is associated with more than geriatric
          functional status; it is also associated with midlife aging and lifelong brain health.

          JAMA Network Open. 2019;2(10):e1913123. doi:10.1001/jamanetworkopen.2019.13123

          Introduction
          The ability to walk and gait speed depend on the function and interplay of the musculoskeletal,
          visual, central nervous, and peripheral nervous systems, as well as aerobic capacity, cardiorespiratory
          fitness, and energy production and delivery.1,2 Reduced gait speed is a sign of advancing age3; it is
          associated with poorer response to rehabilitation, age-related diseases, including cardiovascular
          disease and dementia, and early mortality.4-6
                Gait speed is frequently used in geriatric settings as a quick, simple, and reliable way of
          estimating older patients’ functional capacity. It is increasingly recognized that gait is associated with
          not only musculoskeletal mechanisms but also with the central nervous system (CNS).4,7 To date,
          longitudinal research on gait and cognitive functioning has primarily focused on older adults, many
          with neurological diseases.8 Few studies have integrated cognitive and structural measures of the
          CNS with gait in healthy midlife adults, and, to our knowledge, none has examined the childhood CNS
          origins of gait. Filling this information gap is important for understanding the origins of gait speed
          and for prevention of functional disability. If gait speed is antedated by early-life CNS variation, this
          would point to possibilities for early identification of vulnerability and resilience in functional capacity
          well before late life and suggest potential targets for early intervention.
                Herein, we evaluated 2 hypotheses. First, we tested the hypothesis that slow gait speed at
          midlife—when adults are still in their robust 40s—already reflects early signs of accelerated biological
          aging. If so, this would imply that gait speed could be used as an earlier indicator of aging in aging-
          prevention trials. Second, we tested the hypothesis that slow gait speed is associated with poor
          neurocognitive functioning at midlife and also in early childhood. If so, this would imply that gait
          speed has origins in brain development beginning in childhood and manifesting in midlife. Support
          for our hypotheses would suggest rethinking gait speed, from a geriatric index of adult functional
          decline to a summary index of lifelong aging with possible origins in childhood CNS deficits.

          Methods
          Study Design and Population
          Participants are members of the Dunedin Multidisciplinary Health and Development Study, a
          longitudinal investigation of health and behavior in a representative birth cohort. The 1037
          participants (91% of eligible births) were all individuals born between April 1972 and March 1973 in
          Dunedin, New Zealand, who were eligible on the basis of residence in the province and who
          participated in the first assessment at age 3 years.9 The cohort represents the full range of
          socioeconomic status (SES) in the general population of New Zealand’s South Island and, as adults,
          matches the New Zealand National Health and Nutrition Survey on key adult health indicators (eg,
          body mass index, smoking, and general practitioner visits) and the New Zealand Census of citizens of
          the same age on educational attainment. Participants are primarily white (93%, self-identified),
          matching South Island demographic characteristics.9 Assessments were performed at birth; at ages
          3, 5, 7, 9, 11, 13, 15, 18, 21, 26, 32, and 38 years; and, most recently (completed April 2019), at age 45
          years, when 938 of the 997 participants (94.1%) still alive participated. At each assessment, each
          participant was brought to the research unit for interviews and examinations. Written informed
          consent was obtained from cohort participants, and study protocols were approved by the

             JAMA Network Open. 2019;2(10):e1913123. doi:10.1001/jamanetworkopen.2019.13123 (Reprinted)                                                October 11, 2019    2/15

Downloaded From: https://jamanetwork.com/ on 10/11/2019
JAMA Network Open | Neurology                                                                                                                    Association of Neurocognitive and Physical Function With Gait Speed in Midlife

          institutional ethical review boards of the participating universities. This study follows the
          Strengthening the Reporting of Observational Studies in Epidemiology (STROBE) reporting guideline.

          Gait Speed
          Gait speed (meters per second) was assessed with the 6-m-long GAITRite Electronic Walkway (CIR
          Systems, Inc) with 2-m acceleration and 2-m deceleration before and after the walkway, respectively.
          We excluded 4 participants who could not be tested because of disabling conditions (eg, amputation
          or broken leg). Gait speed was assessed under 3 walking conditions: usual gait speed (walk at normal
          pace from a standing start, measured as a mean of 2 walks) and 2 challenge paradigms, dual task gait
          speed (walk at normal pace while reciting alternate letters of the alphabet out loud, starting with the
          letter “A,” measured as a mean of 2 walks) and maximum gait speed (walk as fast as safely possible,
          measured as a mean of 3 walks).

          Composite Gait Speed
          Gait speed was correlated across the 3 walk conditions: usual vs dual task, usual vs maximum, and
          dual task vs maximum (Figure 1). To increase reliable measurements and take advantage of the
          variation in all 3 walk conditions (usual gait and the 2 challenge paradigms), we calculated the mean
          of the 3 individual walk conditions to generate our primary measure of composite gait speed
          (eFigure 1 in the Supplement).

          Figure 1. Distribution of Gait Speed for Participants in the Dunedin Multidisciplinary Health and Development Study at Age 45 Years

                                              125                                                                           125                                                                               125

                                              100                                                                           100                                                                               100
                  Participants, No.

                                                                                                  Participants, No.

                                                                                                                                                                                    Participants, No.

                                              75                                                                             75                                                                                75

                                              50                                                                             50                                                                                50

                                              25                                                                             25                                                                                25

                                               0                                                                             0                                                                                  0
                                                    0   0.5   1.0   1.5   2.0   2.5   3.0   3.5                                   0   0.5    1.0   1.5    2.0   2.5     3.0   3.5                                   0   0.5    1.0   1.5    2.0    2.5    3.0   3.5
                                                              Usual Gait Speed, m/s                                                         Dual Task Gait Speed, m/s                                                         Maximum Gait Speed, m/s

                                              3.0                                                                           3.5                                                                               3.5

                                                                                                                            3.0                                                                               3.0
                                              2.5
                                                                                                  Maximum Gait Speed, m/s

                                                                                                                                                                                    Maximum Gait Speed, m/s
                  Dual Task Gait Speed, m/s

                                                                                                                            2.5                                                                               2.5
                                              2.0

                                                                                                                            2.0                                                                               2.0
                                              1.5
                                                                                                                            1.5                                                                               1.5

                                              1.0
                                                                                                                            1.0                                                                               1.0

                                              0.5
                                                                                                                            0.5                                                                               0.5

                                               0                                                                             0                                                                                  0
                                                    0   0.5   1.0   1.5   2.0   2.5   3.0   3.5                                   0   0.5    1.0   1.5    2.0   2.5     3.0   3.5                                   0   0.5    1.0   1.5    2.0    2.5    3.0   3.5
                                                              Usual Gait Speed, m/s                                                          Usual Gait Speed, m/s                                                            Dual Task Gait Speed, m/s

          Gait speed distributions for individual walk conditions (usual, dual task, and maximum) are depicted as histograms. Scatterplots illustrate the pairwise correlations between individual
          walk conditions. The blue lines are linear regression lines.

             JAMA Network Open. 2019;2(10):e1913123. doi:10.1001/jamanetworkopen.2019.13123 (Reprinted)                                                                                                                                           October 11, 2019    3/15

Downloaded From: https://jamanetwork.com/ on 10/11/2019
JAMA Network Open | Neurology Association of Neurocognitive and Physical Function With Gait Speed in Midlife
Physical Function
Physical function at age 45 years was assessed by self-reported physical limitations using the RAND
36-Item Short Form Survey,10 with reversed scores to reflect limitations. Physical function was also
assessed by several brief exercises that index the ability to perform everyday activities, including
handgrip strength,11,12 balance,13-15 visual-motor coordination,16 chair-stand test,17,18 and 2-minute
step test18,19 (eMethods 1 in the Supplement).
Measures of Accelerated Aging
Accelerated aging was assessed by 2 measures: pace of aging20 and facial age20 (eMethods 1 in the
Supplement). The pace of aging was measured for each participant with repeated assessments of a
panel of 19 biomarkers taken at ages 26, 32, 38, and 45 years.20 The 19 biomarkers were body mass
index, waist-to-hip ratio, glycated hemoglobin level, leptin level, blood pressure (mean arterial
pressure), cardiorespiratory fitness (maximum oxygen consumption [VO2max]), forced expiratory
volume in 1 second (FEV1), ratio of forced expiratory volume in 1 second to forced vital capacity
(FEV1/FVC), total cholesterol level, triglyceride level, high-density lipoprotein cholesterol level, ratio
of apolipoprotein B100 to apolipoprotein A1, lipoprotein(a) level, creatinine clearance, blood urea
nitrogen level, C-reactive protein level, white blood cell count, gum health, and caries-affected tooth
surfaces. Change over time in each biomarker was modeled with mixed-effects growth models, and
these rates of change were combined into a single index scaled (by sex) in years of physiological
change occurring per 1 chronological year. Participants ranged in their pace of aging from
approximately 0 years of physiological change per chronological year to approximately 3 years of
physiological change per chronological year. Facial age was evaluated on the basis of ratings by an
independent panel of 8 raters of standardized photographs of each participant’s face made during
their assessment at age 45 years.
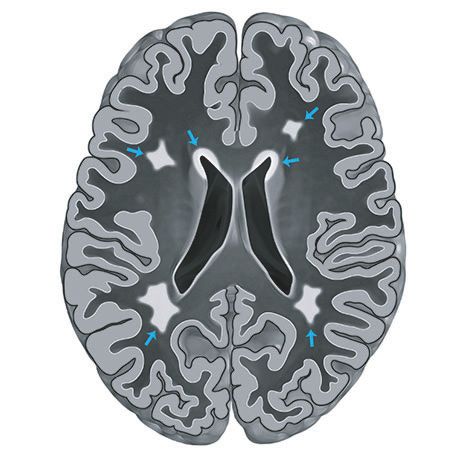
Brain Structure and Neurocognitive Functions
At age 45 years, participants completed a neuroimaging protocol to detect structural age-related
features of the brain. Images (T1-weighted structural and fluid-attenuated inversion recovery) were
acquired using a 3-T magnetic resonance imaging scanner (Skyra; Siemens Healthcare) equipped
with a 64-channel head and neck coil. High-resolution structural images were used to generate
estimates of total brain volume, mean cortical thickness, total surface area, and white matter
hyperintensities (eMethods 1 in the Supplement). Total white matter hyperintensities were
log-transformed (natural logarithm) to improve normality.
Neurocognitive function at age 45 years was assessed with the Wechsler Adult Intelligence
Scale–IV.21 The Wechsler Adult Intelligence Scale–IV generates the overall full-scale IQ. In addition, 4
Wechsler Adult Intelligence Scale–IV indexes assess the abilities that make up the IQ: processing
speed, working memory, perceptual reasoning, and verbal comprehension. In addition, the Trail-
Making Test,22 Animal Naming Test, Wechsler Memory Scale–Mental Control, and the Rey Auditory
Verbal Learning Test of Memory16 were administered at age 45 years to assess executive functioning,
verbal fluency, and memory (eMethods 1 in the Supplement). Trail-Making Test scores were reversed
so that higher values corresponded to better cognitive performance.
Measures of Childhood Neurocognitive Functions and Childhood SES
At age 3 years, each child participated in a 45-minute examination that included assessments by a
pediatric neurologist; standardized tests of intelligence, receptive language, and motor skills; and
examiner ratings of each child’s emotional and behavioral regulation. These 5 measures were
combined to yield a composite index of brain health (eMethods 2 in the Supplement).23 Childhood-
to-adulthood cognitive decline was calculated by a difference between scores on the Wechsler Adult
Intelligence Scales and the Wechsler Intelligence Scale for Children–Revised.24 These tests are ideal
for measuring childhood-to-adulthood cognitive decline because both tests are matched for content
coverage and format, both were individually administered by trained psychometrists, and both yield
JAMA Network Open. 2019;2(10):e1913123. doi:10.1001/jamanetworkopen.2019.13123 (Reprinted) October 11, 2019 4/15
Downloaded From: https://jamanetwork.com/ on 10/11/2019JAMA Network Open | Neurology Association of Neurocognitive and Physical Function With Gait Speed in Midlife
summary scores that are reliable at greater than 0.95. Mean scores for the Wechsler Intelligence
Scale for Children–Revised across administration at ages 7, 9, and 11 years were calculated (eMethods
2 in the Supplement). The SES of participants’ childhood families was measured using the 6-point
Elley-Irving Socioeconomic Index for New Zealand.25
Statistical Analysis
Continuous measures are presented as mean (SD) or median (interquartile range). We calculated
Pearson correlation coefficients (r). We performed linear regression analyses with all variables
standardized to mean = 0 and SD = 1, and we present standardized regression coefficients (β) for the
associations between individual factors with gait speed, adjusted for sex. Associations were further
adjusted for leg length, body composition (fat mass and lean mass), or childhood SES. These results
are presented in eTables 1, 2, 3, and 4 in the Supplement; further details about the measurement of
leg length, fat mass index, and lean mass index are provided in eMethods 1 in the Supplement. We
applied Bonferroni correction to account for multiple testing within domain sets of measures
(physical function, accelerated aging, brain structure, and neurocognitive function).
Statistical analyses were performed in SAS Enterprise Guide statistical software version 7.15
(SAS Institute). Analyses reported here were checked for reproducibility by an independent data
analyst, who recreated the code by working from the manuscript and applied it to a fresh copy of the
data set. Two-sided P < .05 (Fisher exact test) was a priori designated as statistically significant. We
present effect sizes, 95% CIs, and actual P values for all tests conducted. Data analysis was
performed from April to June 2019.
Results
Of 1037 participants in the original cohort (535 [51.6%] male), 997 were still alive at age 45 years, and
938 took part in the assessment at age 45 years between April 2017 and April 2019. Of the 997 still
alive, 904 (90.7%; 455 [50.3%] male; 93% white) completed the gait test and were included in this
study. Participants with gait speed data available did not differ significantly from other living
participants in terms of childhood SES or childhood neurocognitive functioning (see attrition analysis
in eMethods 3 in the Supplement). Table 1 shows the demographic characteristics and mean (SD) for
measures of gait speed, physical function (mean [SD], physical limitation score, 10.2 [15.4]; maximum
handgrip strength, 39.8 [12.0] kg; 1-legged balance, 14.8 [9.8] seconds; visual-motor coordination,
71.4 [12.6] seconds; number of chair stands in 30 seconds, 18.3 [5.6]; and 2-minute step test, 115.5
[26.6] steps), accelerated aging (mean [SD], pace of aging score, 0.99 [0.31]; facial age score, −0.004
[1.00]), brain structure (mean [SD], total brain volume, 1 160 304.5 [116 687.8] mm3; mean cortical
thickness, 2.56 [0.09] mm; total surface area, 185 514.9 [16 350.8] mm2; and total log-transformed
white matter hyperintensities, 936.2 [1050.8] mm3), and neurocognitive function (mean [SD],
childhood brain health z score, 0.05 [0.93]; total IQ, 100.1 [14.9]). Gait speed was normally
distributed under all walk conditions, with larger variation in gait speed during the dual task and
maximum walk conditions (usual vs dual task, r = 0.75 [95% CI, 0.72-0.77], P < .001; usual vs
maximum, r = 0.46 [95% CI, 0.41-0.51], P < .001; and dual task vs maximum, r = 0.45 [95% CI, 0.40-
0.50], P < .001) (Figure 1). The mean (SD) usual gait speed was 1.30 (0.17) m/s; dual task gait speed,
1.16 (0.23) m/s; and maximum gait speed, 1.99 (0.29) m/s. The mean (SD) composite gait speed was
1.48 (0.19) m/s. The median (interquartile range) usual gait speed was 1.30 (1.18-1.40) m/s; dual task
gait speed, 1.17 (1.03-1.31) m/s; maximum gait speed, 1.96 (1.80-2.15) m/s; and composite gait speed,
1.48 (1.35-1.60) m/s. One-week gait speed test-retest reliabilities (50 participants) were r = 0.77
(95% CI, 0.62-0.86; P < .001) for usual gait speed, r = 0.86 (95% CI, 0.75-0.91; P < .001) for dual task
gait speed, r = 0.74 (95% CI, 0.58-0.84; P < .001) for maximum gait speed, and r = 0.77 (95% CI,
0.62-0.86; P < .001) for composite gait speed. Later in the article, we describe associations between
composite gait speed and measures in domains of physical function, accelerated aging, brain
structure, and neurocognitive function. Each of the 3 individual walk conditions yielded the same
JAMA Network Open. 2019;2(10):e1913123. doi:10.1001/jamanetworkopen.2019.13123 (Reprinted) October 11, 2019 5/15
Downloaded From: https://jamanetwork.com/ on 10/11/2019JAMA Network Open | Neurology Association of Neurocognitive and Physical Function With Gait Speed in Midlife
pattern of associations as did composite gait speed (Table 2; eTable 3 and eTable 4 in the
Supplement). All associations were independent of leg length and body composition (lean mass and
fat mass) (eTable 1 and eTable 2 in the Supplement) as well as childhood SES (eTable 3 and eTable 4
in the Supplement), except white matter hyperintensities, which became nonsignificant when we
controlled for body composition and childhood SES. When correcting for multiple testing within each
domain, all measures remained significantly associated with gait speed.
Gait Speed and Physical Function and Accelerated Aging at Age 45 Years
Midlife adults who self-reported more physical limitations in their day-to-day life had slower gait
speed (β, −0.27; 95% CI, −0.34 to −0.21; P < .001). In addition, adults with weaker grip strength (β,
0.36; 95% CI, 0.25-0.46; P < .001), poorer balance (β, 0.28; 95% CI, 0.21-0.34; P < .001), and poorer
visual-motor coordination (β, 0.24; 95% CI, 0.17-0.30; P < .001) and those who performed worse on
Table 1. Characteristics of Participants With Gait Speed Data
Participants, No.
Characteristic (N = 904)a Mean (SD)
Childhood socioeconomic status score 899 3.78 (1.13)
Gait speed, m/s
Usual 904 1.30 (0.17)
Dual task 904 1.16 (0.23)
Maximum 904 1.99 (0.29)
Composite 904 1.48 (0.19)
Physical function
Physical limitation scoreb 901 10.2 (15.4)
Maximum handgrip strength, kg 903 39.8 (12.0)
One-legged balance, s 897 14.8 (9.8)
Visual-motor coordination, sc 899 71.4 (12.6)
Chair stands, No. in 30 s 873 18.3 (5.6)
2-min step test, No. of steps 886 115.5 (26.6)
Accelerated aging
Pace of aging scored 903 0.99 (0.31)
Facial age score 902 −0.004 (1.00)
Brain structure
Total brain volume, mm3 859 1 160 304.5 (116 687.8)
Mean cortical thickness, mm 859 2.56 (0.09)
Total surface area, mm2 859 185 514.9 (16 350.8)
Total log-transformed white matter hyperintensities, mm3e 849 936.2 (1050.8)
Neurocognitive function
Childhood brain health z score 902 0.05 (0.93)
Total IQ 902 100.1 (14.9)
Processing speed 902 100.1 (15.0)
Working memory 898 100.1 (15.0)
Perceptual reasoning 902 100.1 (14.9)
Verbal comprehension 892 100.0 (15.0)
a
A total of 455 participants (50.3%) were male.
Trail-Making Test, s
b
Part A 901 30.2 (9.9) Measured according to the RAND 36-Item Short
Form Survey physical functioning scale with reversed
Part B 902 68.4 (22.5)
scores to reflect limitations.10
Animal Naming Test, No. in 60 s 895 23.4 (5.8) c
Grooved pegboard test, time (seconds) for
Wechsler Memory Scale–Mental Control scoref 888 3.05 (1.34) nondominant hand.
Rey Auditory Verbal Learning test score d
Years of physiological change per chronological year.
Total 902 35.7 (7.4) e
Natural logarithm.
Recall 898 8.7 (2.9) f
Naming the months backward.
JAMA Network Open. 2019;2(10):e1913123. doi:10.1001/jamanetworkopen.2019.13123 (Reprinted) October 11, 2019 6/15
Downloaded From: https://jamanetwork.com/ on 10/11/2019Table 2. Associations of Gait Speed With Concurrent Measures of Physical Function, Accelerated Aging, Brain Structure, and Neurocognitive Functiona
Gait Speed
Usual Dual Task Maximum Composite
Participants,
Variable No. β (95% CI) P Value β (95% CI) P Value β (95% CI) P Value β (95% CI) P Value
Physical function
Physical limitationsb 901 −0.21 (−0.27 to −0.15)JAMA Network Open | Neurology Association of Neurocognitive and Physical Function With Gait Speed in Midlife
the chair-stand (β, 0.34; 95% CI, 0.27-0.40; P < .001) or 2-minute step tests (β, 0.33; 95% CI, 0.27-
0.39; P < .001) had slower gait (Table 2).
Midlife adults who exhibited signs of accelerated aging also had slower gait (Table 2). Slower
gait was associated with a more rapid pace of aging (β, −0.33; 95% CI, −0.40 to −0.27; P < .001);
according to the pace of aging index, participants with the slowest gait (bottom quintile; mean [SD]
composite gait speed, 1.21 [0.10] m/s) had been aging 5.0 years faster from ages 26 to 45 years than
participants with the fastest gait (top quintile; mean [SD] composite gait speed, 1.75 [0.10] m/s)
(Figure 2A; eFigure 2 in the Supplement). In addition, the faces of slow-gaited adults were rated as
looking older (β, −0.25; 95% CI, −0.31 to −0.18; P < .001) (Figure 2B).
Gait Speed, Brain Structure, and Neurocognitive Functions at Age 45 Years
Midlife adults with smaller total brain volume (β, 0.15; 95% CI, 0.06 to 0.23; P < .001), thinner mean
cortex (β, 0.09; 95% CI, 0.02 to 0.16; P = .01), smaller total brain surface area (β, 0.13; 95% CI, 0.04
to 0.21; P = .003), or a higher volume of white matter hyperintensities (β, −0.09; 95% CI, −0.15 to
−0.02; P = .01) had slower gait (Table 2; Figure 3). The association between white matter
hyperintensities and gait was not significant after controlling for body composition or childhood SES.
These brain features (volume, cortical thickness, surface area, and white matter hyperintensity
burden) are known to be associated with cognitive functioning, as confirmed by their associations
with IQ (Figure 3). Next, we tested whether neurocognitive functioning at age 45 years was also
associated with gait speed. Participants with lower IQ at age 45 years had slower gait (β, 0.38; 95%
CI, 0.32 to 0.44; P < .001) (Table 2). The cognitive impairment of those with slow gait was apparent
Figure 2. Accelerated Aging, Poor Childhood Neurocognitive Function, and Cognitive Decline Associated
With Slower Midlife Gait Speed
A Mean pace of aging B Mean facial age
1.2 0.4
Pace of Aging, Years of Physiological
Change/Chronological Year
Facial Age, Mean z-Score
1.1 0.2
1.0 0
0.9 –0.2
0.8 –0.4
1 2 3 4 5 1 2 3 4 5
Slow Fast Slow Fast
Gait Speed Quintiles Gait Speed Quintiles
C Mean childhood brain health D Childhood-to-adulthood cognitive decline
0.4 110 A-C, The mean pace of aging at age 45 years (years of
Gait speed physiological change per chronological year) (A), mean
quintiles:
105 facial age at age 45 years (z score; mean = 0, SD = 1)
Brain Health, Mean z-Score
0.2 1 Slow
2 (B), and mean brain health at age 3 years (z score;
3 mean = 0, SD = 1) (C) by gait speed quintiles at age 45
100 4
years are shown. Generalized additive models are
0 5 Fast
IQ
shown in eFigure 2 in the Supplement. D, The
95 childhood-to-adulthood cognitive decline by gait
speed quintiles is also shown. Gait speed quintiles are
–0.2
90
defined as follows: quintile 1, less than 1.32 m/s (181
participants); quintile 2, 1.32 to 1.43 m/s (181
participants); quintile 3, 1.44 to 1.52 m/s (181
–0.4 85
1 2 3 4 5 Child Adult
participants); quintile 4, 1.53 to 1.63 m/s (181
Slow Fast participants); and quintile 5, greater than 1.63 m/s (180
Gait Speed Quintiles participants). Error bars indicate standard error.
JAMA Network Open. 2019;2(10):e1913123. doi:10.1001/jamanetworkopen.2019.13123 (Reprinted) October 11, 2019 8/15
Downloaded From: https://jamanetwork.com/ on 10/11/2019JAMA Network Open | Neurology Association of Neurocognitive and Physical Function With Gait Speed in Midlife
Figure 3. Associations Between Brain Structure With IQ and With Gait Speed at Age 45 Years
A Total brain volume
2.0×10⁶ 2.0×10⁶
β, 0.31 (95% CI, 0.22 to 0.39); PJAMA Network Open | Neurology Association of Neurocognitive and Physical Function With Gait Speed in Midlife
across multiple neuropsychological domains: they had slower processing speed (β, 0.30; 95% CI,
0.23 to 0.36; P < .001), poorer working memory (β, 0.32; 95% CI, 0.26 to 0.38; P < .001), poorer
perceptual reasoning (β, 0.29; 95% CI, 0.22 to 0.35; P < .001), and poorer verbal comprehension (β,
0.30; 95% CI, 0.24 to 0.37) (Table 2). In addition, adults who performed worse on the Trail-Making
Test (part A: β, 0.26; 95% CI, 0.20 to 0.33; part B: β, 0.22; 95% CI, 0.16 to 0.29; P < .001 for both),
Animal Naming Test (β, 0.23; 95% CI, 0.16 to 0.29; P < .001), Wechsler Memory Scale–Mental Control
(β, 0.20; 95% CI, 0.13 to 0.26; P < .001), and the Rey Auditory Verbal Learning Test of Memory (total,
β, 0.33; 95% CI, 0.27 to 0.39; recall, β, 0.22; 95% CI, 0.15 to 0.29; P < .001 for both) had slower gait
(Table 2).
Childhood Neurocognitive Functioning and Gait Speed at Midlife
The contemporaneous association between gait speed and neurocognitive functioning at midlife was
foreshadowed by cognitive differences already apparent in childhood (Figure 2C and D). We looked
back to data obtained when participants were aged 3 years to test the longitudinal association
between childhood brain health assessed during a pediatric examination and midlife gait. Indications
of poor brain health at age 3 years were associated with slow gait at age 45 years (β, 0.26; 95% CI,
0.20-0.32; P < .001) (Figure 2C). Sensitivity analyses revealed that the following components of
brain health at age 3 years were each significantly associated with gait speed: picture vocabulary,
receptive language skills, motor skills, and lack of control (eTable 5 in the Supplement). The
association between childhood brain health and adult gait speed held after controlling for childhood
SES (β, 0.21; 95% CI, 0.15-0.28; P < .001). A decline on Wechsler testing from childhood to adulthood
was associated with slower gait speed at midlife (β, 0.10; 95% CI, 0.04-0.17; P < .001) (Figure 2D),
even after controlling for childhood SES (β, 0.11; 95% CI, 0.05-0.18; P < .001).
Discussion
Gait speed is used primarily to monitor the functional capacity of older adults and to forecast their
rate of age-related decline. Our findings suggest that gait speed may not only be a geriatric concern.
In this 5-decade longitudinal study of a population-representative birth cohort, gait speed measured
at age 45 years was already associated with physical and biological indicators of accelerated aging.
Beyond accelerated aging, gait speed was associated with lifelong compromised brain health and
neurocognitive functioning beginning as early as age 3 years. Notably, gait speed under the 3
separate walk conditions shared the same associations, albeit with larger effect sizes for the 2
challenge walks, especially maximum gait speed, which could suggest that maximum gait speed may
be a more sensitive measure among midlife patients. These findings call for rethinking gait speed,
from a geriatric index of functional decline to an index of the role of lifelong neurocognitive
functioning in processes of aging. We next highlight 3 specific findings.
First, slow gait was associated with poor physical function at midlife. In this midlife cohort—
most of whom walked faster than older adults3—we documented associations between gait speed
and physical performance similar to those observed in older adults,26 indicating that the association
between gait speed and physical function is evident at age 45 years, not just among older people.
Second, at midlife, slow gait was associated with accelerated aging, as indexed by more rapid
deterioration of multiple organ systems over the preceding 2 decades and by facial age. Slow gait was
also associated with multiple indices of compromised structural brain integrity, including smaller total
brain volume, global cortical thinning, and reduced total surface area.27 Slow gait was associated with
the volume of white matter hyperintensities, which is associated with cognitive decline and
dementia,28 although this association diminished when we controlled for body composition or
childhood SES. These findings in 45-year-old participants parallel those of studies29,30 showing that
gait speed is associated with structural brain changes in older adults and that total brain volume and
white matter hyperintensities are associated with gait slowing in older adults.31,32 These findings
survived correction for multiple testing applied within the brain structure domain, but if correction
JAMA Network Open. 2019;2(10):e1913123. doi:10.1001/jamanetworkopen.2019.13123 (Reprinted) October 11, 2019 10/15
Downloaded From: https://jamanetwork.com/ on 10/11/2019JAMA Network Open | Neurology Association of Neurocognitive and Physical Function With Gait Speed in Midlife
for multiple testing had been applied across all study measures simultaneously, only total brain
volume would have remained associated with gait speed, suggesting that findings for cortical
thickness, surface area, and white matter hyperintensities, although consistent with the literature,
should be treated with caution.
Third, slow gait at midlife was associated with poorer neurocognitive functioning across
multiple cognitive domains; there was a mean difference of 16 IQ points (>1 SD) between the slowest
and fastest walkers (ie, bottom vs top quintile). These findings align with those of several studies4
of older adults showing associations of slow gait with cognitive impairment and risk of dementia.
Remarkably, in our study, gait speed was associated not only with concurrent neurocognitive
functioning in adulthood but also with neurocognitive functioning in early childhood. The effect sizes
between participants in the slowest and fastest gait speed quintiles were far from trivial: at age 3
years, the difference in brain health was 0.62 SD
Research is needed to unpack the association between childhood neurocognitive functioning
and midlife gait speed. Six hypotheses are proposed: first, the link between better brain health and
gait may be governed by the integrity of shared neural substrates that are involved in both
neurocognitive functions and walking throughout life.33,34 Second, better brain health may be
associated with health-promoting behaviors (eg, not smoking, healthy diet, and physical activity).
Third, better brain health may be associated with better health literacy, facilitating access to better
health care. Fourth, better brain health may be associated with higher education and lower risk of
unsafe working conditions and health-damaging exposures. Fifth, better brain health is an early
indicator of good overall physical status because the brain is a sensitive organ and possibly the first
to indicate weak overall somatic system integrity across multiple organ systems.35 Sixth, common
genetic factors may account for the link between better brain health and physical health, either
because of lower mutation load36 or pleiotropy at genetic loci associated with both better
neurocognitive function and a longer life span.37 The finding that midlife gait speed reflects lifelong
compromised neurocognitive functioning may help to account for the robust ability of gait
assessments to predict Alzheimer disease and related dementias.4,32
Because gait speed shows meaningful aging-related variation already in midlife, it may prove to
be a useful measure in aging trials aimed at preventing the onset of age-related disease. A variety of
interventions targeting human aging—ranging from calorie restriction to metformin
administration38,39—are being tested in aging-prevention trials. It is increasingly recognized that it
might be easier to prevent aging-associated damage than to reverse it, suggesting that the effect of
interventions to slow aging may work better if they are applied while people are still young and free
of disease and disability. This necessitates a shift toward enrolling younger participants in antiaging
trials, and with this shift, valid measures are required to identify risk groups that need intervention,
and to track the course of outcome before the manifestation of age-related diseases. Gait speed
could be used as one such measure: the gait speed test is cheap, safe, easy to test repeatedly, and
feasible to use among people in their 40s.
Limitations
A limitation of the study is the lack of gait speed measurement before age 45 years, which precludes
assessment of longitudinal changes in gait speed. Similarly, brain imaging data were not acquired
before age 45 years. Although we were unable to examine structural brain changes over time, we
were able to evaluate changes in neurocognitive functioning from childhood to adulthood and to
show that greater cognitive decline from childhood to midlife was associated with slower midlife
gait speed.
Conclusions
Gait speed is more than just a geriatric index of adult functional decline; rather, it is a summary index
of lifelong aging with possible origins in childhood CNS deficits. This helps to explain why gait can be
JAMA Network Open. 2019;2(10):e1913123. doi:10.1001/jamanetworkopen.2019.13123 (Reprinted) October 11, 2019 11/15
Downloaded From: https://jamanetwork.com/ on 10/11/2019JAMA Network Open | Neurology Association of Neurocognitive and Physical Function With Gait Speed in Midlife
such a powerful indicator of risk of disability and death in the elderly. It also encourages rethinking
gait as not only a motoric concern, but as an integrative measure of health.
ARTICLE INFORMATION
Accepted for Publication: August 23, 2019.
Published: October 11, 2019. doi:10.1001/jamanetworkopen.2019.13123
Open Access: This is an open access article distributed under the terms of the CC-BY License. © 2019 Rasmussen
LJH et al. JAMA Network Open.
Corresponding Author: Line Jee Hartmann Rasmussen, PhD, Department of Psychology and Neuroscience, Duke
University, 2020 W Main St, Ste 201, Durham, NC 27708 (line.jee.hartmann.rasmussen@duke.edu).
Author Affiliations: Department of Psychology and Neuroscience, Duke University, Durham, North Carolina
(Rasmussen, Caspi, d’Arbeloff, Elliott, Harrington, Houts, Knodt, Richmond-Rakerd, Sison, Hariri, Moffitt); Clinical
Research Centre, Copenhagen University Hospital Amager and Hvidovre, Hvidovre, Denmark (Rasmussen);
Department of Psychiatry and Behavioral Sciences, Duke University School of Medicine, Durham, North Carolina
(Caspi, Moffitt); Center for Genomic and Computational Biology, Duke University, Durham, North Carolina (Caspi,
Moffitt); Social, Genetic, and Developmental Psychiatry Centre, Institute of Psychiatry, Psychology, and
Neuroscience, King’s College London, London, United Kingdom (Caspi, Moffitt); Dunedin Multidisciplinary Health
and Development Research Unit, Department of Psychology, University of Otago, Dunedin, New Zealand (Ambler,
Hogan, Ireland, Meredith-Jones, Morrison, Poulton, Ramrakha, Sneddon); Department of Oral Sciences, University
of Otago, Dunedin, New Zealand (Broadbent, Thomson); Claude D. Pepper Older Americans Independence Center,
Duke University, Durham, North Carolina (Cohen, Morey); Duke Center for the Study of Aging and Human
Development, Duke University, Durham, North Carolina (Cohen); Department of Medicine, Duke University,
Durham, North Carolina (Cohen, Morey); Department of Preventive and Social Medicine, Dunedin School of
Medicine, University of Otago, Dunedin, New Zealand (Hancox); Geriatric Research, Education, and Clinical Center,
Durham VA Medical Center, Durham, North Carolina (Morey); Frank Porter Graham Child Development Institute,
University of North Carolina at Chapel Hill, Chapel Hill (Richmond-Rakerd).
Author Contributions: Drs Rasmussen and Moffitt had full access to all of the data in the study and take
responsibility for the integrity of the data and the accuracy of the data analysis.
Concept and design: Rasmussen, Caspi, Cohen, Elliott, Poulton, Moffitt.
Acquisition, analysis, or interpretation of data: All authors.
Drafting of the manuscript: Rasmussen, Caspi, Moffitt.
Critical revision of the manuscript for important intellectual content: All authors.
Statistical analysis: Rasmussen, Ambler, Elliott, Houts, Knodt, Sison.
Obtained funding: Caspi, Broadbent, Poulton, Hariri, Moffitt.
Administrative, technical, or material support: Ambler, Broadbent, d’Arbeloff, Harrington, Hogan, Knodt, Meredith-
Jones, Morey, Morrison, Poulton, Ramrakha, Richmond-Rakerd, Sneddon, Hariri.
Supervision: Caspi, Ambler, Poulton, Hariri, Moffitt.
Content support: Morey.
Conflict of Interest Disclosures: None reported.
Funding/Support: This work was supported by grants AG032282, AG049789, and AG028716 from the National
Institute on Aging and grant MR/P005918/1 from the UK Medical Research Council to Ms Harrington and Drs Caspi,
Meredith-Jones, and Moffitt. Dr Rasmussen was supported by a postdoctoral fellowship through grant R288-
2018-380 from the Lundbeck Foundation. Dr Cohen was supported by grants from the National Institutes of
Health. Mr Elliott was supported by grant NSF DGE-1644868 from the National Science Foundation Graduate
Research Fellowship. Dr Meredith-Jones received support from the Jacobs Foundation, the New Zealand Health
Research Council, and the New Zealand Ministry of Business, Innovation and Employment. Dr Poulton was
supported by grants from New Zealand Health Research Council 16-604. Dr Richmond-Rakerd was supported by
a postdoctoral fellowship through grant T32-HD007376 from the National Institute of Child Health and Human
Development. The Dunedin Multidisciplinary Health and Development Research Unit was supported by the New
Zealand Health Research Council and New Zealand Ministry of Business, Innovation, and Employment.
Role of the Funder/Sponsor: The funders had no role in the design and conduct of the study; collection,
management, analysis, and interpretation of the data; preparation, review, or approval of the manuscript; and
decision to submit the manuscript for publication.
JAMA Network Open. 2019;2(10):e1913123. doi:10.1001/jamanetworkopen.2019.13123 (Reprinted) October 11, 2019 12/15
Downloaded From: https://jamanetwork.com/ on 10/11/2019JAMA Network Open | Neurology Association of Neurocognitive and Physical Function With Gait Speed in Midlife
Additional Contributions: We thank members of the Advisory Board for the Dunedin Neuroimaging Study, the
Irish Longitudinal Study on Ageing team, Dunedin Multidisciplinary Health and Development Study members, unit
research staff, and Dunedin Multidisciplinary Health and Development Study founder Phil Silva, PhD, University
of Otago.
Additional Information: The premise and analysis plan for this project were registered at https://sites.google.com/
site/dunedineriskconceptpapers/home/dunedin-approved.
REFERENCES
1. Fritz S, Lusardi M. White paper: “walking speed: the sixth vital sign.” J Geriatr Phys Ther. 2009;32(2):46-49. doi:
10.1519/00139143-200932020-00002
2. Peel NM, Kuys SS, Klein K. Gait speed as a measure in geriatric assessment in clinical settings: a systematic
review. J Gerontol A Biol Sci Med Sci. 2013;68(1):39-46. doi:10.1093/gerona/gls174
3. Bohannon RW, Williams Andrews A. Normal walking speed: a descriptive meta-analysis. Physiotherapy. 2011;97
(3):182-189. doi:10.1016/j.physio.2010.12.004
4. Peel NM, Alapatt LJ, Jones LV, Hubbard RE. The association between gait speed and cognitive status in
community-dwelling older people: a systematic review and meta-analysis. J Gerontol A Biol Sci Med Sci. 2019;74
(6):943-948. doi:10.1093/gerona/gly140
5. Dumurgier J, Elbaz A, Ducimetière P, Tavernier B, Alpérovitch A, Tzourio C. Slow walking speed and
cardiovascular death in well functioning older adults: prospective cohort study. BMJ. 2009;339:b4460. doi:10.
1136/bmj.b4460
6. Studenski S, Perera S, Patel K, et al. Gait speed and survival in older adults. JAMA. 2011;305(1):50-58. doi:10.
1001/jama.2010.1923
7. Demnitz N, Hogan DB, Dawes H, et al. Cognition and mobility show a global association in middle- and
late-adulthood: analyses from the Canadian Longitudinal Study on Aging. Gait Posture. 2018;64:238-243. doi:10.
1016/j.gaitpost.2018.06.116
8. National Institute on Aging. Council minutes: May 2017, the 131st meeting, May 16–17, 2017. https://www.nia.nih.
gov/about/naca/council-minutes-may-2017. Published 2017. Accessed May 20, 2019.
9. Poulton R, Moffitt TE, Silva PA. The Dunedin Multidisciplinary Health and Development Study: overview of the
first 40 years, with an eye to the future. Soc Psychiatry Psychiatr Epidemiol. 2015;50(5):679-693. doi:10.1007/
s00127-015-1048-8
10. The RAND Corporation. RAND 36-Item Short Form Survey (SF-36). https://www.rand.org/health-care/surveys_
tools/mos/36-item-short-form.html. Accessed August 14, 2019.
11. Rantanen T, Guralnik JM, Foley D, et al. Midlife hand grip strength as a predictor of old age disability. JAMA.
1999;281(6):558-560. doi:10.1001/jama.281.6.558
12. Mathiowetz V, Kashman N, Volland G, Weber K, Dowe M, Rogers S. Grip and pinch strength: normative data for
adults. Arch Phys Med Rehabil. 1985;66(2):69-74.
13. Bohannon RW, Larkin PA, Cook AC, Gear J, Singer J. Decrease in timed balance test scores with aging. Phys
Ther. 1984;64(7):1067-1070. doi:10.1093/ptj/64.7.1067
14. Vereeck L, Wuyts F, Truijen S, Van de Heyning P. Clinical assessment of balance: normative data, and gender
and age effects. Int J Audiol. 2008;47(2):67-75. doi:10.1080/14992020701689688
15. Springer BA, Marin R, Cyhan T, Roberts H, Gill NW. Normative values for the unipedal stance test with eyes
open and closed. J Geriatr Phys Ther. 2007;30(1):8-15. doi:10.1519/00139143-200704000-00003
16. Lezak D, Howieson D, Loring D, Hannay H, Fischer J. Neuropsychological Assessment. 4th ed. New York, NY:
Oxford University Press; 2004.
17. Jones CJ, Rikli RE, Beam WC. A 30-s chair-stand test as a measure of lower body strength in community-
residing older adults. Res Q Exerc Sport. 1999;70(2):113-119. doi:10.1080/02701367.1999.10608028
18. Jones CJ, Rikli RE. Measuring functional fitness of older adults. https://www.dnbm.univr.it/documenti/
OccorrenzaIns/matdid/matdid182478.pdf. Published 2002. Accessed August 31, 2019.
19. Rikli RE, Jones CJ. Functional fitness normative scores for community-residing older adults, ages 60-94.
J Aging Phys Act. 1999;7(2):162-181. doi:10.1123/japa.7.2.162
20. Belsky DW, Caspi A, Houts R, et al. Quantification of biological aging in young adults. Proc Natl Acad Sci U S A.
2015;112(30):E4104-E4110. doi:10.1073/pnas.1506264112
21. Wechsler D. Wechsler Adult Intelligence Scale. 4th ed. San Antonio, TX: Pearson Assessment; 2008.
JAMA Network Open. 2019;2(10):e1913123. doi:10.1001/jamanetworkopen.2019.13123 (Reprinted) October 11, 2019 13/15
Downloaded From: https://jamanetwork.com/ on 10/11/2019JAMA Network Open | Neurology Association of Neurocognitive and Physical Function With Gait Speed in Midlife
22. US War Department. Army Individual Test Battery Manual and Directions for Scoring. Washington, DC: War
Department, Adjutant General’s Office; 1944.
23. Caspi A, Houts RM, Belsky DW, et al. The p factor: one general psychopathology factor in the structure of
psychiatric disorders? Clin Psychol Sci. 2014;2(2):119-137. doi:10.1177/2167702613497473
24. Wechsler D. Manual for the Wechsler Intelligence Scale for Children, Revised. New York, NY: Psychological
Corp; 1974.
25. Elley W, Irving J. Revised socioeconomic index for New Zealand. N Z J Educ Stud. 1976;11:25-36.
26. Nofuji Y, Shinkai S, Taniguchi Y, et al. Associations of walking speed, grip strength, and standing balance with
total and cause-specific mortality in a general population of Japanese elders. J Am Med Dir Assoc. 2016;17(2):
184.e1-184.e7. doi:10.1016/j.jamda.2015.11.003
27. Potvin O, Dieumegarde L, Duchesne S; Alzheimer’s Disease Neuroimaging Initiative. Normative morphometric
data for cerebral cortical areas over the lifetime of the adult human brain. Neuroimage. 2017;156:315-339. doi:10.
1016/j.neuroimage.2017.05.019
28. Habes M, Erus G, Toledo JB, et al. White matter hyperintensities and imaging patterns of brain ageing in the
general population. Brain. 2016;139(4):1164-1179. doi:10.1093/brain/aww008
29. Nadkarni NK, Boudreau RM, Studenski SA, et al. Slow gait, white matter characteristics, and prior 10-year
interleukin-6 levels in older adults. Neurology. 2016;87(19):1993-1999. doi:10.1212/WNL.0000000000003304
30. Ezzati A, Katz MJ, Lipton ML, Lipton RB, Verghese J. The association of brain structure with gait velocity in
older adults: a quantitative volumetric analysis of brain MRI. Neuroradiology. 2015;57(8):851-861. doi:10.1007/
s00234-015-1536-2
31. Kilgour AH, Todd OM, Starr JM. A systematic review of the evidence that brain structure is related to muscle
structure and their relationship to brain and muscle function in humans over the lifecourse. BMC Geriatr.
2014;14:85. doi:10.1186/1471-2318-14-85
32. Rosso AL, Verghese J, Metti AL, et al. Slowing gait and risk for cognitive impairment: the hippocampus as a
shared neural substrate. Neurology. 2017;89(4):336-342. doi:10.1212/WNL.0000000000004153
33. Tian Q, Resnick SM, Davatzikos C, et al. A prospective study of focal brain atrophy, mobility and fitness. J Intern
Med. 2019;286(1):88-100.
34. Montero-Odasso M, Almeida QJ, Bherer L, et al; Canadian Gait and Cognition Network. Consensus on shared
measures of mobility and cognition: from the Canadian Consortium on Neurodegeneration in Aging (CCNA).
J Gerontol A Biol Sci Med Sci. 2019;74(6):897-909. doi:10.1093/gerona/gly148
35. Deary IJ. Looking for “system integrity” in cognitive epidemiology. Gerontology. 2012;58(6):545-553. doi:10.
1159/000341157
36. Arden R, Gottfredson LS, Miller G. Does a fitness factor contribute to the association between intelligence and
health outcomes? evidence from medical abnormality counts among 3654 US Veterans. Intelligence. 2009;37:
581-591. doi:10.1016/j.intell.2009.03.008
37. Dubal DB, Yokoyama JS, Zhu L, et al. Life extension factor klotho enhances cognition. Cell Rep. 2014;7(4):
1065-1076. doi:10.1016/j.celrep.2014.03.076
38. Redman LM, Smith SR, Burton JH, Martin CK, Il’yasova D, Ravussin E. Metabolic slowing and reduced oxidative
damage with sustained caloric restriction support the rate of living and oxidative damage theories of aging. Cell
Metab. 2018;27(4):805-815.e4. doi:10.1016/j.cmet.2018.02.019
39. Barzilai N, Crandall JP, Kritchevsky SB, Espeland MA. Metformin as a tool to target aging. Cell Metab. 2016;23
(6):1060-1065. doi:10.1016/j.cmet.2016.05.011
SUPPLEMENT.
eMethods 1. Age 45 Assessment
eMethods 2. Childhood Assessments
eMethods 3. Attrition Analysis
eTable 1. Associations Between Age-45 Measures of Physical Function, Accelerated Aging, Brain Structure, or
Cognitive Function With Concurrent Composite Gait Speed in Models Adjusted for Leg Length and Body
Composition (Lean Mass Index and Fat Mass Index)
eTable 2. Associations Between Childhood Variables and Composite Gait Speed at Age 45 Years Adjusted for Leg
Length and Body Composition (All Associations Are Adjusted for Sex and Childhood SES)
eTable 3. Associations Between Age-45 Measures of Physical Function, Accelerated Aging, Brain Structure, or
Cognitive Function With Concurrent Gait Speed (All Associations Are Adjusted for Sex and Childhood SES)
JAMA Network Open. 2019;2(10):e1913123. doi:10.1001/jamanetworkopen.2019.13123 (Reprinted) October 11, 2019 14/15
Downloaded From: https://jamanetwork.com/ on 10/11/2019JAMA Network Open | Neurology Association of Neurocognitive and Physical Function With Gait Speed in Midlife
eTable 4. Associations Between Childhood Variables and Gait Speed at Age 45 Years (All Associations Are Adjusted
for Sex and Childhood SES)
eTable 5. Associations Between Components of Childhood Brain Health and Composite Gait Speed at Age 45 Years
eFigure 1. Distribution of Gait Speed for Participants in the Dunedin Study at Age 45 Years
eFigure 2. Accelerated Aging and Poor Childhood Neurocognitive Functioning Are Associated With Slower Gait
Speed at Age 45 Years
eReferences
JAMA Network Open. 2019;2(10):e1913123. doi:10.1001/jamanetworkopen.2019.13123 (Reprinted) October 11, 2019 15/15
Downloaded From: https://jamanetwork.com/ on 10/11/2019You can also read