Anatomical and ontogenetic influences on muscle density - Nature
←
→
Page content transcription
If your browser does not render page correctly, please read the page content below
www.nature.com/scientificreports
OPEN Anatomical and ontogenetic
influences on muscle density
Kaitlyn C. Leonard1,2, Nikole Worden1, Marissa L. Boettcher3, Edwin Dickinson1,
Kailey M. Omstead4, Anne M. Burrows4 & Adam Hartstone‑Rose1*
Physiological cross-sectional area (PCSA), an important biomechanical variable, is an estimate of
a muscle’s contractile force potential and is derived from dividing muscle mass by the product of a
muscle’s average fascicle length and a theoretical constant representing the density of mammalian
skeletal muscle. This density constant is usually taken from experimental studies of small samples of
several model taxa using tissues collected predominantly from the lower limbs of adult animals. The
generalized application of this constant to broader analyses of mammalian myology assumes that
muscle density (1) is consistent across anatomical regions and (2) is unaffected by the aging process.
To investigate the validity of these assumptions, we studied muscles of rabbits (Oryctolagus cuniculus)
in the largest sample heretofore investigated explicitly for these variables, and we did so from
numerous anatomical regions and from three different age-cohorts. Differences in muscle density and
histology as a consequence of age and anatomical region were evaluated using Tukey’s HSD tests.
Overall, we observed that older individuals tend to have denser muscles than younger individuals. Our
findings also demonstrated significant differences in muscle density between anatomic regions within
the older cohorts, though none in the youngest cohort. Approximately 50% of the variation in muscle
density can be explained histologically by the average muscle fiber area and the average percent fiber
area. That is, muscles with larger average fiber areas and a higher proportion of fiber area tend to be
denser. Importantly, using the age and region dependent measurements of muscle density that we
provide may increase the accuracy of PCSA estimations. Although we found statistically significant
differences related to ontogeny and anatomical region, if density cannot be measured directly,
the specific values presented herein should be used to improve accuracy. If a single muscle density
constant that has been better validated than the ones presented in the previous literature is preferred,
then 1.0558 and 1.0502 g/cm3 would be reasonable constants to use across all adult and juvenile
muscles respectively.
Physiological cross-sectional area (PCSA) is an architectural property of muscle that directly relates to force
production capabilities—muscles with higher PCSAs can produce proportionally more force than muscles with
lower PCSAs. As such, PCSA has been frequently used to contextualize d ietary1–11 and locomotor a daptations12–16
across taxa. Unlike muscle mass and fascicle length, which are measured directly, PCSA is derived: calculated as
a function of muscle mass, average fascicle length and muscle d ensity17. The constants used for muscle density
(~ 1.06 g/cm3) are commonly taken from several different s tudies18–20. These sources share some commonalities:
their model specimens were all adult individuals and their samples were taken from similar anatomical regions.
Therefore, the use of these constants makes the assumption that muscle density is static regardless of age and
anatomical region—an assumption that this study aims to address.
Gersh et al.18 used mature guinea pigs as their model system and were analyzing the specific gravity or rela-
tive density of skeletal muscle due to changes in pressure. The authors did not specify the anatomical region
from which they took their tissue sample, but they found no significant differences in the specific density of the
muscle after decompression. Mendez and Keys20 used muscles of the lower limb and “sometimes” include the
psoas muscle of mature rabbits and dogs to evaluate muscle density. Though they specify the muscles they utilized
which include the quadriceps cruralis, gastrocnemius, and tibialis, the authors do not specify what muscles and
how many of each were included in each of the 13 muscle samples for rabbits and 12 muscle samples for dogs20.
Lastly, Murphy and B eardsley19 evaluated the mechanical properties of the soleus muscle of adult cats (n = 6) and
1
Department of Biological Science, North Carolina State University, 3546 Thomas Hall, 112 Derieux Place, Raleigh,
NC 27607, USA. 2Department of Biological Sciences, Meredith College, 3800 Hillsborough St, Raleigh, NC 27607,
USA. 3College of Medicine, Medical University of South Carolina, 96 Jonathan Lucas St. Ste. 601, MSC 617,
Charleston, SC 29425, USA. 4Department of Physical Therapy, Duquesne University, 600 Forbes Ave., Pittsburgh,
PA 15282, USA. *email: AdamHRose@ncsu.edu
Scientific Reports | (2021) 11:2114 | https://doi.org/10.1038/s41598-021-81489-w 1
Vol.:(0123456789)www.nature.com/scientificreports/
as an aside measured density because it was necessary to calculate PCSA. The conclusions of these studies18–20
all converged upon very similar densities (1.065, 1.0597, and 1.0564 g/cm3, respectively). This convergence may
reflect similarities in study design between these experiments, which were all comprised exclusively of adult
individuals, and limited variation among anatomical regions. Therefore, given these similarities, using a constant
for muscle density makes some inherent assumptions.
Assumption 1. The first assumption made seemingly universally by functional morphologists that is
important to evaluate is that muscle density remains relatively constant throughout an individual’s life. For this
assumption to be true, muscle mass and muscle volume would have to change proportionally because density is
defined as the mass per unit of volume. However, given that other architectural properties of muscle have been
demonstrated to be dynamic and change throughout the lifespan of animals (see, for e xample21–23), this is also
likely to be the case for muscle density. For example, muscle mass has been shown to decline with increasing
age—a condition that has been termed as s arcopenia24,25. Other previous studies conducted provide more direct
evidence that muscle density is variable with age26–28. For instance, Imamura et al.27 investigated the size and
density of human sacrospinalis and psoas major muscles with respect to age using computed tomography and
observed an increase in density until middle-age with a subsequent decline. While the authors noted that the dif-
ferences they observed were statistically significant, they did not specify what these differences were. Additional
evidence suggesting muscle density changes with age is provided by a study conducted by Newton et al.28 who
observed a decline in the density of the masseter and medial pterygoid muscles with advancing age. Overarching
trends within this literature suggest that muscle density will increase until approximately middle-age and decline
throughout senescence.
In addition to these studies that suggest muscles will vary based on their gross characteristics (e.g., mass), it
is also likely that they will change microscopically and in composition (especially during growth), resulting in
changes in muscle density. Muscles grow three different ways which include increasing the number of muscle
fibers, increasing the size of the muscle fibers, and lastly, increasing the length of the muscle fibers29. Skeletal
muscle is predominantly comprised of muscle fibers with connective tissue such as collagen and fat dispersed
throughout30. Therefore, as muscle grows it is likely that the proportions of the microscopic components will
change resulting in differences in muscle density.
Assumption 2. It is additionally assumed in most functional myology studies that muscle density is not
influenced by the anatomical region from which the samples are taken. The study conducted by Méndez and
Keys20 used lower limb muscles including the quadriceps cruralis, gastrocnemius, tibialis, and occasionally
included the hip flexor psoas, while the other most commonly cited reference for muscle density, the study by
Murphy and B eardsley19, only evaluated the soleus. This is potentially problematic as the density constant deter-
mined by these authors is used to make determinations about muscles from all anatomical regions and it has
been clearly demonstrated that muscles are variable in composition. For instance, Faucitano et al.31 found that
fat content within individual muscle fascicles can vary throughout the same muscle. Muscles that are higher in
fat (i.e., greater degree of “marbling”—as the food industry calls it) should have a lower density relative to leaner
muscles because fat has a significantly lower density of 0.936 g/cm332. Additionally, a generalized inverse trend
has been demonstrated within muscles between fat content and water content33–35. This variability in muscle
composition will presumably be reflected in muscle density. Fat content within skeletal muscle has been dem-
onstrated to be correlated with its microscopic organization. For instance, Kauffman and Safanie noted that
organized, but widely dispersed fasciculi correlated with high lipid c ontent36. The present study plans to address
this by sampling a certain area of a cross-section of each muscle to determine the percent of this area comprised
of muscle fibers. A higher percentage of muscle fibers in theory should be correlated to less fat content and ulti-
mately greater density.
In addition to variable fat content, it has been reported that collagen—the most substantial constituent ele-
ment of connective tissue within skeletal muscle-can comprise between 3 and 30% of a muscle’s total p rotein37.
Therefore, muscles with a lot of connective tissue will likely be denser. A good example of this would be the
masseter because it is a complex muscle consisting of several fascial layers with connective tissue throughout.
Predictions. In effort to address these assumptions and based on previous literature we predict the follow-
ing:
1. Based on previous studies26,27, we predict that muscle density will vary based on age within our sample—
increasing until prime adulthood.
2. Furthermore, we anticipate that this increase in density will be histologically correlated with an increase in
the size of the muscle fibers. We expect this to influence density because larger fibers will inherently contain
more proteins which are denser than water resulting in a slightly higher density.
Materials and methods
To test these hypotheses a sample (n = 66) of New Zealand white Oryctolagus cuniculus rabbit cadavers was
obtained from a commercial meat farm, Brittany Ridge Farms. All animals were euthanized according to USDA
standards prior to obtaining them and were therefore deemed “exempt” by NC State IACUC. The specimens
were subdivided into three age-cohorts which consisted of individuals approximately 3 weeks (n = 18), 8 months
(n = 30) and 2 years of age (n = 18; Table 1). These age-cohorts were selected based on the life history of this breed
of rabbit and availability. (As commercial breeders of rabbits for the food industry do not keep animals beyond
prime breeding age, we were not able to study the effects of senescence in this species, which lives to 7 years o ld38;
Scientific Reports | (2021) 11:2114 | https://doi.org/10.1038/s41598-021-81489-w 2
Vol:.(1234567890)www.nature.com/scientificreports/
Cohort Age Males Females Total
C1 3-weeks old 7 11 18
C2 8-months old 11 19 30
C3 2-years old 10 8 18
Table 1. Oryctolagus cuniculus sample demographics.
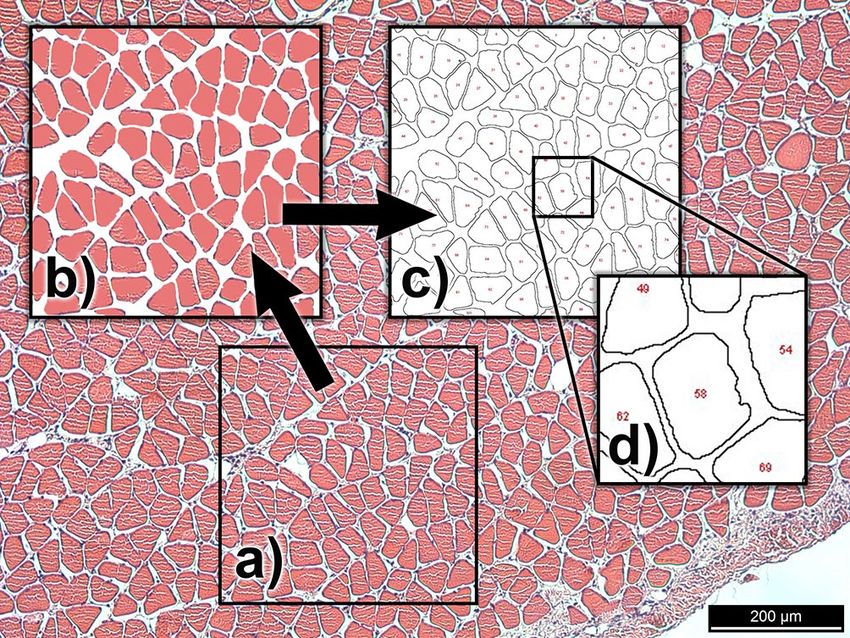
Figure 1. Stages of the histological image processing: (a) raw image obtained of an 8-month old rabbit soleus
(Specimen ID: A54_Soleus) muscle, (b) 400 × 400 μm section preprocessed in Photoshop to simplify for
measurement, (c) outline schematic produced by using the “analyze particles” function in ImageJ, (d) partial
fibers are excluded by number.
see “Limitations and future directions” below). Three-week old rabbits were chosen to represent the truly juvenile
cohort as they do not wean until approximately 30 days of a ge39,40. Sexual maturity is achieved by 6 months of
age41, therefore the 8-month old rabbits represent sexually mature individuals. By the age of 2 years (the oldest
age-cohort that we could obtain from the commercial farm) rabbits have reached full adult size.
In order to evaluate the effects of anatomical region on muscle density, muscles from four different regions
were selected, including the head, forelimb, hindlimb and the trunk. Individual muscles were chosen as rep-
resentative of these regions and also relatively diverse in subjective myological properties (e.g., muscles with a
lot of connective tissue, “lean” muscles, and states in between), and included the masseter, digastric, quad labii,
extensor carpi radialis longus (ECRL), pronator teres (PT), gastrocnemius, soleus, plantaris and psoas minor.
After excision, muscles were weighed to the nearest 0.0001 g using a Mettler Toledo New Classic (MS-105)
analytical balance and the density of each muscle at 20.0˚C was determined using a Mettler Toledo density kit
(MS-DNY-54), which automatically calculates density using Archimedes principle. The kit requires first weighing
the sample in air and then in an auxiliary liquid, for which we chose deionized water.
Additionally, in an effort to better account for differences in muscle composition, a subsample of muscles
was histologically evaluated (Fig. 1). To do this, three sections from each from each of the nine sampled muscles
from two rabbits from each cohort (one male and one female from the two younger cohorts and two males from
the older cohort) were cross-sectioned perpendicular to their fibers. For muscles that have multiple components
in which the fascicular orientation varies throughout (e.g., masseter), the section was taken perpendicular to
the most superficial fascicles. We then embedded these samples in paraffin, sectioned them at 10–12 μm and
then stained using hematoxylin and eosin. The slides were photographed using a Leica (CTR5500) microscope
and three 400 μm by 400 μm sections were sampled (chosen to minimize major vessels, nerves and tendons)
using Photoshop (CC2019). These sections were then processed further using ImageJ (IJ1.46r) (Fig. 1). After
the scale was set appropriately, the images were binarized, and then any holes within the individual fibers were
filled using the “fill holes” tool. The “Analyze particles” function was then used to collect information about the
area of each muscle fiber and the percent of each sampled section that consisted of fiber area. To determine the
average fiber area, any partial fibers that may have been captured within our sampled section were excluded (e.g.,
on the perimeter of the frame). The percent fiber area was calculated by summing all of the fiber areas for each
of the three sampled sections and dividing by the total sampled area.
All statistical analyses were conducted using JMP Pro14 (SAS). Tukey’s HSD tests (essentially an all-pairs
t-tests; alpha = 0.05) were conducted to compare the mean densities between age-cohorts and anatomical regions.
Tukey’s HSD tests were conducted to identify not only the presence of significant differences in mean density
but to determine where the significances lie. This test was used to compare density across the anatomical regions
Scientific Reports | (2021) 11:2114 | https://doi.org/10.1038/s41598-021-81489-w 3
Vol.:(0123456789)www.nature.com/scientificreports/
Figure 2. The distributions for the density of each muscle per each of the three cohorts: C1 = 3 weeks;
C2 = 8 months; C3 = 2 years old. The lines above the box plots indicate significant differences between connected
columns (* p < 0.05, ** p < 0.01, *** p < 0.0001) for each muscle. The light gray and medium gray lines depict the
constants taken from Mendez and Keys (1.0597 g/cm3; 1960) and Murphy and Beardsley (1.0564 g/cm3; 1974)
respectively. The black line represents the grand mean of all the muscles measured in this study (1.0546 g/cm3;
n = 594 muscles). One data outlier (C1 of the quadratus labii; density of 1.16 g/cm3) omitted for graphical clarity.
of each age-cohort as well as across the age-cohorts for each muscle. Further Tukey’s HSD tests were conducted
to evaluate to determine if average fiber area and percent of the sampled area that was comprised of muscle fib-
ers differed significantly between age-cohorts. To evaluate the scaling relationship between muscle density and
average fiber area and percent fiber area reduced major axis (RMA) linear regressions were conducted. This type
of analysis accounts for error in both the x and y axes42 and is commonly employed when evaluating scaling
relationships between variables.
Ethics approval and consent to participate. The use of cadaveric materials is exempt from North Car-
olina State University’s IACUC.
Consent for publication. All authors listed on this publication provide their consent for the work to be
published.
Results
The distributions of muscle density for the three age-cohorts and each muscle indicates variation based on both
age and anatomical region (Fig. 2). The quadratus labii was consistently the least dense while the plantaris was the
densest (Table 2). The mean density of all muscles except the soleus became greater with increasing age (Table 2;
Fig. 2) though, because of variance, not all of these increases across the full sample of muscles were significant.
The mean density of the masseter increased with increasing age and the masseter is the only muscle that dif-
fered significantly between each age-cohort (Table 2). A similar trend was observed when all muscles for each
age-cohort were analyzed collectively (C1 n = 162; C2 n = 270; C3 n = 162; Table 2). Contrastingly the quadratus
labii and the soleus were the only two muscles that did not show any significant differences in muscle density
between the three age-cohorts (Table 2). The digastric, gastrocnemius, plantaris and psoas followed similar
trends to one another. The youngest individuals had muscle densities that were significantly different than those
of the older two cohorts, but the average densities between the older two cohorts did not differ from one another
(Table 2). The extensor carpi radialis longus (ECRL) and pronator teres both exhibited the same trend. The aver-
age muscle density within the 3-week age-group was not significantly different than the 8-month olds but was
significantly different than the 2-year olds. The specimens from the older two cohorts were also not significantly
different than one another (Table 2).
Within the 3-week old cohort there were no significant density differences between any muscles; however,
this was not the case within the other two age-cohorts (Table 3).
The most consistent region-specific variation observed between the 8-month and 2-year old cohorts occurred
within the triceps surae, with the plantaris being significantly denser than the gastrocnemius and soleus muscles
(Table 3). There were no significant differences observed in muscle density between the pronator teres and ECRL
muscles in either of the latter two age-cohorts (Table 3).
When comparing the distributions of the histologically measured average fiber areas between each age-cohort,
(Fig. 3; Table 4), average fiber area was significantly higher in the 8-month old cohort than the 3-week old cohort
and also significantly higher in the 2-year old cohort than the 8-month old cohort. We also compared the percent
Scientific Reports | (2021) 11:2114 | https://doi.org/10.1038/s41598-021-81489-w 4
Vol:.(1234567890)www.nature.com/scientificreports/
Muscle Age-cohort Mean muscle density (g/cm3) Mean standard error
C1 1.0501 0.0011
Masseter C2 1.0558 0.0007
C3 1.0606 0.0009
C1 1.0497 0.0020
Digastric C2 1.0513 0.0009
C3 1.0565 0.0010
C1 1.0482 0.0079
Quadratus Labii C2 1.0432 0.0022
C3 1.0499 0.0019
C1 1.0494 0.0025
Extensor Carpi Radialis Longus C2 1.0529 0.0011
C3 1.0556 0.0009
C1 1.0453 0.0060
Pronator Teres C2 1.0542 0.0022
C3 1.0589 0.0021
C1 1.0534 0.0013
Gastrocnemius C2 1.0606 0.0011
C3 1.0630 0.0011
C1 1.0551 0.0016
Plantaris C2 1.0653 0.0003
C3 1.0656 0.0008
C1 1.0514 0.0014
Soleus C2 1.0529 0.0007
C3 1.0508 0.0013
C1 1.0493 0.0015
Psoas C2 1.0616 0.0009
C3 1.0611 0.0013
C1 1.0502 0.0012
All regions C2 1.0553 0.0006
C3 1.0580 0.0006
Table 2. The mean muscle density, mean standard error and results within each age-cohort (C1 = 3 weeks old;
C2 = 8 months old; C3 = 2 years old).
Muscle Tukey’s HSD results across C1 Tukey’s HSD results across C2 Tukey’s HSD results across C3
Masseter A BCD ABC
Digastric A BCD BCD
Quadratus Labii A E D
Extensor Carpi Radialis Longus A D CD
Pronator teres A CD ABC
Gastrocnemius A ABC AB
Plantaris A A A
Soleus A D D
Psoas A AB ABC
Table 3. “Connected Letter” report of Tukey’s HSD results of density differences between the anatomical
regions of each age-cohort (C1 = 3 weeks old; C2 = 8 months old; C3 = 2 years old). Muscles connected by
letters cannot be statistically separated at α = 0.05. For example, the density of gastrocnemius, plantaris and
psoas cannot be distinguished across any of the three age-cohorts (all connected by the letter “A”, as are all
of the muscles of the density indistinct youngest cohort), but the density of soleus is significantly different
(connected to other muscles labeled “D”, but without a connection to “A”) than that of gastrocnemius in the
two older cohorts.
Scientific Reports | (2021) 11:2114 | https://doi.org/10.1038/s41598-021-81489-w 5
Vol.:(0123456789)www.nature.com/scientificreports/
Figure 3. Distributions and mean diamonds for the histologically measured average fiber area and percent
fiber area for each of the muscles (n = 18 muscles from 2 individuals) measured in each of the three cohorts
(C1 = 3 weeks old; C2 = 8 months old; C3 = 2 years old). The lines above indicate significant differences between
connected columns (*p < 0.01, **p < 0.001, ***p < 0.0001).
Age-cohort Average fiber area (μm2) Std. dev. (μm2) Std. error mean (μm2)
C1 393.87 129.48 31.40
C2 1037.65 427.68 103.73
C3 1657.02 736.32 173.55
Table 4. Average fiber area (μm2), standard deviation (μm2) and standard error (μm2) for each muscle of a
subset of each age-cohort (C1 = 3 weeks old; C2 = 8 months old; C3 = 2 years old) and the connecting letter
report from a Tukey’s HSD test comparing the three groups.
Age-cohort Average % fiber area Std. dev Std. error mean
C1 62.40 7.22 1.75
C2 69.82 4.43 1.07
C3 69.08 6.06 1.43
Table 5. Average percent fiber area, standard deviation and standard error for each muscle for a subset of
each age-cohort (C1 = 3 weeks old; C2 = 8 months old; C3 = 2 years old) and the connecting letter report from a
Tukey’s HSD test comparing the three groups.
Scientific Reports | (2021) 11:2114 | https://doi.org/10.1038/s41598-021-81489-w 6
Vol:.(1234567890)www.nature.com/scientificreports/
Figure 4. Reduced major axis regressions of average fiber area (top; r 2 = 0.49) and % fiber area against (bottom;
r2 = 0.49) density combined for all muscles and cohorts.
of the sampled histological area that was occupied by muscle fibers (Fig. 3; Table 5) and we observed statistically
significant lower percent area occupied by muscle fibers in the 3-week cohort than either of the older cohorts.
However, the average percent fiber area of the sample area was not significantly different between the 8-month
and 2-year old cohorts.
To evaluate the relationship between muscle density and average fiber area and average percent fiber area
we conducted a reduced major axis regression (Fig. 4). We observed that approximately 49% of the variation
observed in muscle density is explained by the average fiber area and average percent fiber area—with individu-
als with denser muscles having larger fiber areas (i.e., bigger cross-sectional areas of the fibers) and the sample
regions consisting of a greater proportion of muscle fibers within the sampled regions (i.e., higher percent of the
sampled region was made up of muscle fibers; Fig. 4).
Discussion
Accurate representation of muscle density is crucial when calculating PCSA, an important biomechanical vari-
able that is a direct correlate of muscle force production potential. However, the current practice in the field
of substituting a value for muscle density as universally applicable from previous studies that included very
conscribed samples18–20, obscures the variability in this value that relates to ontogeny and anatomical region. To
address this, this study comprehensively evaluated variation in muscle density in different age groups and parts
of the body and sought to explain these differences histologically.
As we predicted based on the findings of Imamura et al.27 consisting of increasing muscle density within the
sacrospinalis and the psoas major muscles until middle-age in humans, we also observed the general trend that
for each muscle we evaluated, the average density was successively higher within the latter age-cohorts (Fig. 2,
Table 2). However, these differences were not always significant between the age-cohorts for each muscle—sug-
gesting differential trends in development based on the functional demands throughout the animal’s life history.
More specifically, while the mean density of each muscle (except soleus) increased in each age-cohort, those
increases were only significant for about half of the cohort to cohort comparisons (Fig. 2). Although soleus had
a relatively tight range of density measurements and did not exhibit this ontogenetic trend, the other muscles for
which this trend was least significant (i.e., quadratus labii and, to a lesser extent, extensor carpi radialis longus
and pronator teres) were the muscles that had the widest standard deviations in muscle density. As the means of
these densities increased like those of the other muscles, though with these notable wider standard deviations, if
the sample sizes were increased, the ontogenetic trend in these muscles might also reach statistical significance.
Scientific Reports | (2021) 11:2114 | https://doi.org/10.1038/s41598-021-81489-w 7
Vol.:(0123456789)www.nature.com/scientificreports/
The fact that soleus does not change density across the age-cohorts is rather surprising. Like the other two
muscles of the triceps surae, it has fairly little variation in muscle density—though the mean densities, especially
of the two older cohorts are notably lower than those of the gastrocnemius and plantaris. From a functional
perspective, it is unclear why this muscle’s density would scale differently (or, as it were, not at all) over ontogeny,
though perhaps it is because of functional/activation differences in these three crural muscles.
There do not appear to be clear regional differences in muscle density; the forelimb muscles are not generally
more or less dense than the hindlimb muscles, nor (with the exception of the relatively light quadratus labii)
are the head muscles or the trunk muscle (psoas) significantly notable. Thus, while there are significant differ-
ences in specific muscles in adult rabbits, these seem to fall within anatomical regions and are not general trends
between them. This suggests that there may be important functional differences in synergistic muscles within
the same system (e.g., the triceps surae) that influence their density as there is no apparently homogeneity in
these anatomical muscle groups.
The differences that we observed in density generally increasing with age were, at least in part, explained by
their histology: the average fiber area also increased with age. We also found that the percent of the sampled area
that consisted of muscle fibers increased significantly between the 3-week old cohort and the 8-month cohort
and the 3-week old and 2-year old cohorts but did not differ significantly between the 8-month old and 2-year
old cohort.
Overall, our findings demonstrate significant differences in muscle density occurring both across ontogeny
and anatomical region. Although we observed no statistically significant regional differences in muscle density
within 3-week old rabbits, significant trends were observed within the two older cohorts. The lack of significant
differences observed in youngest cohort could have two contrasting explanations. The first is that, the musculature
has not developed enough to reflect the diversity of their inherent anatomical properties. The second plausible
explanation is that muscles of the juveniles even within the same region could vary too widely—perhaps because
of important differences in maturation at this age—such that the Tukey’s HSD test would not be able to detect
more subtle differences.
While the findings of our study demonstrate statistically significant differences in muscle density based on
ontogeny and anatomical region, the practical significance of this may be relatively small: Inter-muscular dif-
ferences appear rather subtle—meaning that if it is not feasible to directly measure muscle density, the use of a
“constant” is reasonable. In other words, although there are significant differences, the magnitude of those dif-
ferences authors should not worry excessively about these differences if density cannot be measured on a muscle
by muscle basis. However, the use of the previously determined constants that were derived from a small subset
of muscles from adult individuals (i.e., those used in19,20) should no longer be considered the best practice; this
study presents a variety of values for muscle density (Table 6) that could be applied to more specific analyses
based on age and structural characteristics of the muscle. For example, if a researcher is studying the temporalis
muscle—a complex muscle consisting of several constituent layers and substantial fascial sheets, substituting a
value for density that was taken from the masseter would at least provide some structural similarity. Another
example, for a specimen of an unknown age, a density value of 1.0546 g/cm3 (Fig. 2) may be more appropriate as
it was derived from a large sample (n = 594 muscles) of muscles from individuals of various ages, spanning greater
anatomical breadth than the previously used constants. Researchers could also select other tailored constants if
the muscle of a similarly aged-cohort has been incorporated here. For instance, densities of 1.0558 g/cm3 and
1.0502 g/cm3 would be appropriate for general adult and juvenile muscles respectively; and 1.0549 g/cm3 and
1.0474 g/cm3 for adult and juvenile for forelimb mm; 1.0597 g/cm3 and 1.0533 g/cm3 for adult and juvenile leg
mm.; and 1.0518 g/cm3 and 1.0493 g/cm3 for adult and for juvenile head mm.
Limitations and future directions. This study produced significant findings; however, it is not without
limitations. For example, because histological samples are, by their nature generally relatively small, we were not
able to evaluate what are likely more subtle significant differences in average fiber area and percent fiber area
between the older two cohorts.
While our study found significant differences histologically in the average fiber area and percent fiber area
between age-cohorts we were still not able to explain other important elements of the tissue in a comprehensively
quantitative manner. For instance we were able to make some inferences about how an increase in fiber area may
be driving an increase in muscle density with age (i.e., larger muscle fiber areas thereby an increase in the amount
of protein present), but were not able to quantify the proportion of other types of tissues present that may also
be contributing to these differences (i.e., fat and collagen etc.). Future studies could incorporate a trichrome
stain into the methods—allowing for the differentiation of these tissues which could then be quantified using
the methods developed within this study.
Another histological element that is not incorporated here that may prove useful to incorporate into future
studies is immunohistochemical fiber typing. For example, fiber type composition has been demonstrated to
differ between the gastrocnemius and soleus muscles with the soleus muscle containing a greater proportion of
bers43. Fiber-type analyses may help to explain why within the latter two age-cohorts the
Type I or slow twitch fi
plantaris and gastrocnemius were consistently denser than the soleus muscle. This might also help to elucidate
the similarities in density like, for example, was observed between the ECRL and the PT despite functional and
structural differences. Future studies could further evaluate the correlation between fiber-type and the aging
condition to elucidate the relationships between fiber-type, age and the dynamic functional demands of life.
Another limitation to this study is that our sample did not include an age-cohort that was a true representation
of senescence. We procured our highly controlled sample from a commercial meat farm where they do not have
animals that reach senescence because they would no longer be reproductively efficient. In a future extension of
this work, it would be valuable to find and incorporate some data from senescent individuals perhaps from show
Scientific Reports | (2021) 11:2114 | https://doi.org/10.1038/s41598-021-81489-w 8
Vol:.(1234567890)www.nature.com/scientificreports/
Muscle Structural description Age-cohort Average muscle density (g/cm3)
C1 1.0501
Robust and complex containing multiple fascial
Masseter C2 1.0558
layers
C3 1.0606
C1 1.0497
Digastric Cylindrical with a distinct distal tendon C2 1.0513
C3 1.0565
C1 1.0482
Thin and highly associated with the skin and con-
Quadratus Labii C2 1.0432
nective tissue
C3 1.0499
C1 1.0494
Extensor Carpi Radialis Longus Strap-like muscle with a distinct distal tendon C2 1.0529
C3 1.0556
C1 1.0453
Strap-like muscle with a highly integrated and
Pronator Teres C2 1.0542
inseparable tendon
C3 1.0589
C1 1.0534
Consists of a lateral and medial head that converge at
Gastrocnemius C2 1.0606
a central tendinous sheet
C3 1.0630
C1 1.0551
Plantaris Fusiform shaped with a substantial distal tendon C2 1.0653
C3 1.0656
C1 1.0514
Soleus Cylindrical with a distinct distal tendon C2 1.0529
C3 1.0508
C1 1.0493
Thin and fragile–lacking substantial sheets of con-
Psoas minor C2 1.0616
nective tissue
C3 1.0611
Table 6. Average muscle density by structural characteristics and age.
rabbit breeders or to replicate this density research on a taxon for which a broader age range is available (e.g.,
the mouse lemurs used in22,23, though a larger taxon would probably yield more accurately measured densities).
Additionally, further studies are needed to determine the species-specificity of these values of muscle density
presented here.
Lastly, while the current study examines the relationship between muscle density in relation to ontogeny
and anatomical region, future studies should examine it in relation to other conditions including use/disuse
and disease—factors that clearly could affect the concentration of muscle proteins and therefore the relationship
between PCSA and density.
Conclusions
The implications of this study are great in that it is the first study to explicitly evaluate the density of mus-
cles across broad anatomical regions and ages—while the highly cited standard values for muscle density were
collected on limited samples as part of studies that were not explicitly trying to establish a constant that has
become so broadly used. Ultimately this study has demonstrated the variability in muscle density associated
with ontogeny and anatomy. We have also provided a variety of values for specific muscles if colleagues happen
to be studying the same or similar muscles that we evaluated, and more general values that can be used more
generically (namely a value of 1.0558 g/cm3 for adult muscles, 1.0502 g/cm3 for juveniles, 1.0597 g/cm3 for adult
legs and 1.0518 g/cm3for adult head muscles) if muscle density cannot be directly measured. In short, if possible,
researchers should measure muscle density directly. However, if this is not possible, the more specific density
values presented herein can help improve the accuracy of architectural analysis. More work needs to be done to
elucidate how these values change across species and how factors such as specimen handling and fluid preserva-
tion and future studies on the effects of how senescence and muscle fiber type may also influence muscle density.
Data availability
Data can be made available by contacting Dr. Adam Hartstone-Rose.
Received: 3 July 2020; Accepted: 7 January 2021
Scientific Reports | (2021) 11:2114 | https://doi.org/10.1038/s41598-021-81489-w 9
Vol.:(0123456789)www.nature.com/scientificreports/
References
1. Taylor, A. B. & Vinyard, C. J. Jaw-muscle fiber architecture in tufted capuchins favors generating relatively large muscle forces
without compromising jaw gape. J. Hum. Evol. 57(6), 710–720 (2009).
2. Eng, C. M., Ward, S. R., Vinyard, C. J. & Taylor, A. B. The morphology of the masticatory apparatus facilitates muscle force produc-
tion at wide jaw gapes in tree-gouging common marmosets (Callithrix jacchus). J. Exp. Biol. 212(24), 4040 (2009).
3. Perry, J. M. G. & Wall, C. E. Scaling of the Chewing Muscles in Prosimians. Primate Craniofacial Function and Biology 217–240
(Springer, Boston, 2008).
4. Perry, J. M. G. & Hartstone-Rose, A. Maximum ingested food size in captive strepsirrhine primates: Scaling and the effects of diet.
Am. J. Phys. Anthropol. 142(4), 625–635 (2010).
5. Perry, J. M. G., Hartstone-Rose, A. & Wall, C. E. The jaw adductors of strepsirrhines in relation to body size, diet, and ingested
food size. Anat. Rec. 294(4), 712–728 (2011).
6. Hartstone-Rose, A., Perry, J. M. G. & Morrow, C. J. Bite force estimation and the fiber architecture of felid masticatory muscles.
Anat. Rec. 295(8), 1336–1351 (2012).
7. Perry, J. M. G., Macneill, K. E., Heckler, A. L., Rakotoarisoa, G. & Hartstone-Rose, A. Anatomy and adaptations of the chewing
muscles in Daubentonia (Lemuriformes). Anat. Rec. 297(2), 308–316 (2014).
8. Prufrock, K. A. & Perry, J. M. G. Strepsirrhine diets and the pattern of masticatory muscle development. FASEB J. 32(1 Suppl),
780–785 (2018).
9. Hartstone-Rose, A., Deutsch, A. R., Leischner, C. L. & Pastor, F. Dietary correlates of primate masticatory muscle fiber architecture.
Anat. Rec. 301(2), 311–324 (2018).
10. Curtis, A. A. & Santana, S. E. Jaw-dropping: Functional variation in the digastric muscle in bats. Anat Rec. 301(2), 279–290 (2018).
11. Fabre, P. H., Herrel, A., Fitriana, Y., Meslin, L. & Hautier, L. Masticatory muscle architecture in a water-rat from Australasia
(Murinae, Hydromys) and its implication for the evolution of carnivory in rodents. J. Anat. 231(3), 380–397 (2017).
12. Crook, T. C. et al. Comparative anatomy and muscle architecture of selected hind limb muscles in the Quarter Horse and Arab. J.
Anat. 212(2), 144–152 (2008).
13. Kikuchi, Y. Comparative analysis of muscle architecture in primate arm and forearm. Anat. Histol. Embryol. 39(2), 93–106 (2010).
14. Leischner, C. L. et al. Scaling of primate forearm muscle architecture as it relates to locomotion and posture. Anat. Rec. 301(3),
484–495 (2018).
15. Marchi, D., Leischner, C. L., Pastor, F. & Hartstone-Rose, A. Leg muscle architecture in primates and its correlation with locomo-
tion patterns. Anat. Rec. 301(3), 515–527 (2018).
16. Oishi, M., Ogihara, N., Endo, H. & Asari, M. Muscle architecture of the upper limb in the orangutan. Primates J. Primatol. 49(3),
204–209 (2008).
17. Schumacher, G.-H. Funktionelle Morphologie der Kaumuskulatur (G. Fischer, Jena, 1961).
18. Gersh, I., Hawkinson, G. E. & Rathbun, E. N. Tissue and vascular bubbles after decompression from high pressure atmospheres:
Correlation of specific gravity with morphological changes. J. Cell Physiol. 24(1), 35–70 (1944).
19. Murphy, R. A. & Beardsley, A. C. Mechanical properties of the cat soleus muscle in situ. Am. J. Physiol. 227(5), 1008–1013 (1974).
20. Méndez, J. & Keys, A. Density and composition of mammalian muscle. Metab. Clin. Exp. 9(2), 184–188 (1960).
21. Dickinson, E., Fitton, L. C. & Kupczik, K. Ontogenetic changes to muscle architectural properties within the jaw-adductor mus-
culature of Macaca fascicularis. Am. J. Phys. Anthropol. 167(2), 291–310 (2018).
22. Leonard, K. C. et al. The ontogeny of masticatory muscle architecture in Microcebus murinus. Anat. Rec. 303, 1364–1373 (2019).
23. Boettcher, M. L. et al. The forearm musculature of the gray mouse lemur (Microcebus murinus): An ontogenetic study. Anat. Rec.
303, 1354–1363 (2019).
24. Rosenberg, I. H. Sarcopenia: origins and clinical relevance. J. Nutr. 127(5), 990S-S991 (1997).
25. Cruz-Jentoft, A. J. et al. Sarcopenia: European consensus on definition and diagnosis. Age Ageing. 39(4), 412–423 (2010).
26. Bulcke, J., Termote, J.-L., Palmers, Y. & Crolla, D. Computed tomography of the human skeletal muscular system. Neuroradiology
17(3), 127–136 (1979).
27. Imamura, K., Ashida, H., Ishikawa, T. & Fujii, M. Human major psoas muscle and sacrospinalis muscle in relation to age: A study
by computed tomography. J. Gerontol. 38(6), 678–681 (1983).
28. Newton, J., Yemm, R., Abel, R. & Menhinick, S. Changes in human jaw muscles with age and dental state. Gerodontology 10(1),
16–22 (1993).
29. Pearson, A. M. Muscle growth and exercise. Crit. Rev. Food Sci. Nutr. 29(3), 167–196 (1990).
30. Listrat, A. et al. How muscle structure and composition influence meat and flesh quality. Sci. World J. 2016, 1 (2016).
31. Faucitano, L., Rivest, J., Daigle, J., Lévesque, J. & Gariepy, C. Distribution of intramuscular fat content and marbling within the
longissimus muscle of pigs. Can. J. Anim. Sci. 84(1), 57–61 (2004).
32. Entenman, C., Goldwater, W. H., Ayres, N. S. & Behnke, A. R. Jr. Analysis of adipose tissue in relation to body weight loss in man.
J. Appl. Physiol. 13(1), 129–134 (1958).
33. Ramsbottom, J. & Strandine, E. Comparative tenderness and identification of muscles in wholesale beef cuts. J. Food Sci. 13(4),
315–330 (1948).
34. Swift, C. & Berman, M. Factors affecting the water retention of beef. 1. Variations in composition and properties among 8 muscles.
Food Technol. 13(7), 365–70 (1959).
35. Lawrie, R., Pomeroy, R. & Cuthbertson, A. Studies on the muscles of meat animals III. Comparative composition of various muscles
in pigs of three weight groups. J. Agric. Sci. 60(2), 195–209 (1963).
36. Kauffman, R. & Safanie, A. Influence of porcine muscle structure on its lipid accumulation during growth. J. Food Sci. 32(3),
283–286 (1967).
37. Walls, E. The Microanatomy of Muscle 21 (Academic Press, New York, 1960).
38. Reddan, J. R., Dziedzic, D. C., Mostafapour, M. K., McGee, S. J. & Schwartz, C. A. Establishment and characterization of a lens
epithelial cell line from an eight year old rabbit. Curr. Eye Res. 2(9), 633–640 (1982).
39. von Holst, D. et al. Social rank, fecundity and lifetime reproductive success in wild European rabbits (Oryctolagus cuniculus).
Behav. Ecol. Sociobiol. 51(3), 245–254 (2002).
40. Hudson, R., Bilko, A. & Altbäcker, V. Nursing, weaning and the development of independent feeding in the rabbit (Oryctolagus
cuniculus). Z. Saugetierkunde. 61(1), 39–48 (1996).
41. Macari, M. & Machado, C. R. Sexual maturity in rabbits defined by the physical and chemical characteristics of the semen. Lab.
Anim. 12(1), 37–39 (1978).
42. Sokal, R. & Rohlf, F. Biometry 880 (WH Freeman and Co., New York, 1995).
43. Gollnick, P. D., Sjödin, B., Karlsson, J., Jansson, E. & Saltin, B. Human soleus muscle: A comparison of fiber composition and
enzyme activities with other leg muscles. Pflügers Arch. 348(3), 247–255 (1974).
Acknowledgements
We thank our editor Maurilio Sampaolesi and three anonymous reviewers for insightful feedback that improved
the manuscript, and are especially grateful to Antonio Meza, Deanna Flores, Alysa Schwenk, Vasanth Ramdas,
Scientific Reports | (2021) 11:2114 | https://doi.org/10.1038/s41598-021-81489-w 10
Vol:.(1234567890)www.nature.com/scientificreports/
Shruti Kolli, Jason Seeyle, Sidney Swindell, Cassidy Davis, and Madison Smith for the role they played in data
collection. We would like to thank Laura Miller and Sandra Horton, for lending their histological expertise. We
would also like to thank the staff at Brittany Ridge Farms. This work was funded by the National Science Founda-
tion (IOS-15-57125 and BCS-14-40599).
Author contributions
Conceptual design: K.C.L., A.H.R. Data collection: K.C.L., N.W., M.L.B., K.M.O., A.M.B. Data Analysis: K.C.L.,
N.W., A.H.R. Manuscript preparation: K.C.L., N.W., M.L.B., E.D., K.M.O., A.M.B., A.H.R.
Funding
Grant sponsor: National Science Foundation; Grant Numbers: IOS-15-57125 and BCS-14-40599.
Competing interests
The authors declare no competing interests.
Additional information
Correspondence and requests for materials should be addressed to A.H.-R.
Reprints and permissions information is available at www.nature.com/reprints.
Publisher’s note Springer Nature remains neutral with regard to jurisdictional claims in published maps and
institutional affiliations.
Open Access This article is licensed under a Creative Commons Attribution 4.0 International
License, which permits use, sharing, adaptation, distribution and reproduction in any medium or
format, as long as you give appropriate credit to the original author(s) and the source, provide a link to the
Creative Commons licence, and indicate if changes were made. The images or other third party material in this
article are included in the article’s Creative Commons licence, unless indicated otherwise in a credit line to the
material. If material is not included in the article’s Creative Commons licence and your intended use is not
permitted by statutory regulation or exceeds the permitted use, you will need to obtain permission directly from
the copyright holder. To view a copy of this licence, visit http://creativecommons.org/licenses/by/4.0/.
© The Author(s) 2021
Scientific Reports | (2021) 11:2114 | https://doi.org/10.1038/s41598-021-81489-w 11
Vol.:(0123456789)You can also read