The Impacts of Locational and Neighborhood Environmental Factors on the Spatial Clustering Pattern of Small Urban Houses: A Case of Urban ...
←
→
Page content transcription
If your browser does not render page correctly, please read the page content below
sustainability

Article
The Impacts of Locational and Neighborhood
Environmental Factors on the Spatial Clustering
Pattern of Small Urban Houses: A Case of Urban
Residential Housing in Seoul
Myung-Cheul Shin, Gwang-Mun Shin and Jae-Su Lee *
 Department of Real Estate, College of Social Sciences, Kangwon National University, Kangwon-do 24341, Korea;
 smcmoin1@naver.com (M.-C.S.); taiger7878@gmail.com (G.-M.S.)
 * Correspondence: jslee25@kangwon.ac.kr; Tel.: +82-33-250-6831

 Received: 30 December 2018; Accepted: 22 March 2019; Published: 1 April 2019

 Abstract: Small housing has gained prominence in the housing market due to substantial shifts of
 both population and household structures in Korea. The study aims to examine the spatial clustering
 pattern of urban residential houses (URHs) in terms of the spatial statistics, and analyze the impacts
 of both locational and neighborhood residential factors on the formation of the spatial clustering
 pattern in the Seoul metropolitan area. It is found that the URHs represent a significant spatial
 clustering pattern based on the census tracts. The hotspots are mostly found in the outskirts of Seoul,
 where the development of small houses has been concentrated for ten years. Also, both locational
 and neighborhood residential factors have significant effects on the hotspot formation of the URH.
 The hotspots are more likely to be found in areas having many available sites for development,
 high demand for habitation, and high expected profits from developing small residences. Another
 significant factor is access to public transit, amenities, and employment centers. Therefore, it is
 necessary to design a rent subsidy program for potential residents and to encourage the development
 of housing in nearby hotspots with relatively lower land values. It is also important to establish
 policies and strategies for planning the housing supply and managing the residential environment in
 low-rise residential areas.

 Keywords: Urban Residential Housing; small housing; spatial clustering pattern; hotspot; one-person
 household; low-rise residential area; neighborhood environment; Seoul metropolitan area

1. Introduction
       Due to the steady increase of unmarried and lately married households, the number of persons
per household has been consistently declining in the Seoul metropolitan area (SMA). The ratio of single
and two-person households to the total number of households was 33.3% in 2000, 46.7% in 2010, and
54.1% in 2015, showing a continuous growth. It is projected to increase to 67.95% in 2035; therefore,
it is reasonable to anticipate that the demand for small houses will increase correspondingly [1]. Many
urban areas around the world have also experienced substantial changes in both population and
household structures. Due to changing trends and growing demand, small housing has attracted
attention in the housing market [2].
       In response to surging demand for small urban houses, shrinking residential stability, and
increasing burden of housing expenses of single and two-person households in Korea, the government
revised the Housing Act and introduced the Urban Residential Housing (URH) program at the end of
2009. The URH represents studio-type housing, and row housing and multi-household housing in
a complex with less than 300 households constructed in urban areas Specifically, a dwelling unit of

Sustainability 2019, 11, 1934; doi:10.3390/su11071934                     www.mdpi.com/journal/sustainability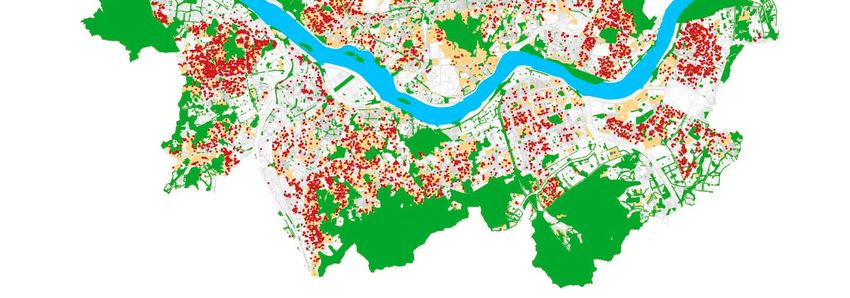
Sustainability 2019, 11, 1934                                                                        2 of 16

studio-type housing shall not exceed 50 m2 , while it is equipped with an independent bathroom and
kitchen; both row housing and multi-household housing in a complex can be built up to five floors.
It aimed to secure residential stability, residential amenities in the community, and to provide a plentiful
supply of affordable small housing. The number of urban residential houses (URHs) permitted for
construction in the SMA from 2009 to 2017 was 11,187 buildings and 192,638 dwelling units. The total
number of URH permitted between 2009 and 2017 was 11,372 buildings based on the data provided
by the Seoul Metropolitan Government (SMG); 185 buildings that were deemed redundant were not
included. Since the introduction of the new housing program in Seoul, most researchers have agreed
that it has significantly contributed to meeting the demand for housing for small households. However,
it has been argued that housing policies and strategies need to be established to enhance the quality of
residential and living environments. It has also been claimed that the housing policies are required to
alleviate the burden of rents and improve the housing affordability for the households [3].
      More than three quarters of total URH buildings and two thirds of total dwelling units were
permitted in the general residential zones, which means that the URH has mostly been built in low-rise
residential areas. In terms of the zoning system in Korea, it includes type 1 and type 2 exclusive
residential zones, and type 1 and type 2 general residential zones with a limit of seven floors. They
are classified as low-rise residential areas in this study when compared with high-rise residential
areas, in which high-rise apartment buildings are mostly located in the SMA. It is therefore expected
that the location of the housing is correlated to the spatial distribution of low-rise residential areas.
Maeng et al. [4] claimed that the age of low-rise houses within the low-rise residential areas in Seoul is
26.3 years on average, and the proportion of small houses with an area of less than 60 square meters is
57.0 percent, performing a crucial role as the main places supplying small urban residences. However,
from 2010 to 2016, the majority of total households residing in houses slated for demolition have
occupied homes in the low-rise residential areas. During the same period, the supply of low-rise
houses amounted to 51.9 percent of total housing supply [5], indicating that the quantity of small
residences may be declining, threatening the residential stability of single and two-person households.
      A number of studies have analyzed the characteristics and the effects of the small houses on
their neighborhoods, or investigated the pricing mechanism and affordability and suggested policy
implications [3,6–16]. Also, earlier studies have focused on analyzing the residential characteristics and
the residential satisfaction factors of single and two-person households as the primary consumers of
small urban residences [13,17–21]. They helped enhance our understanding of the factors influencing
small houses, and the effects of locational and environmental factors on their prices. However, little
research has been found on where they are concentrated and developed, what factors affect the
spatial clustering patterns of small urban residences, how small houses influence the surrounding
neighborhoods, and what can be suggested for reforming relevant policies and encouraging the
provision of small urban residences.
      This study aims to examine the spatial clustering pattern of the URHs in terms of spatial statistics
and analyze the impacts of both locational and neighborhood residential factors on the formation of
the hotspots of URH in the SMA. This research can contribute to suggestions on urban planning and
urban regeneration policies to boost the development of urban small houses and revitalize decrepit
residential areas. To investigate the spatial clustering pattern of the houses, a spatial database on URH
permits has been established using the Geographic Information System (GIS) application.
      The next section of this paper reviews the relevant studies regarding spatial clustering patterns
and URHs and small-scale developments. Section 3 of this paper elaborates on the methodology,
including hotspot analysis and logit analysis. Section 4 presents the results and interpretations of
the development characteristics, the spatial clustering patterns, and the impacts of locational and
neighborhood residential factors on the formation of hotspots in Seoul. The final section offers
conclusions and implications.
Sustainability 2019, 11, 1934                                                                                                        3 of 16

2. URH Program and Literature Review

2.1. Overview of the URH Program
      The URH program has been introduced to promote the supply of small urban houses by providing
numerous legal, institutional, and financial incentives as shown in Table 1. The program relaxes the
separation distance of the URH to the adjacent buildings by half according to the building code.
It lowers the number of parking space requirements to a half parking lot per residential unit, compared
to one parking lot per residential unit of an ordinary multi-family house. This is mainly related to the
results of many studies arguing that one- and two-person households residing in small urban homes
are favor public transportation and non-motorized modes of transport [3,9,12,13]. In addition, the URH
can be approved up to seven stories based on the building code, although an ordinary multi-family
house can only be built up to four stories.
      The institutional supports applied to the URH program vary depending on the number of
residential units approved on the site. Small development projects containing no more than thirty units
of the URHs are provided with more incentives because almost all URH projects are categorized as
being small development projects. They include simplified and time-saving permission procedures and
construction inspections by the local government. The Housing Act also stipulates that landscaping
and community service facilities for senior citizens, administration and management works, and
inhabitant meetings should be secured on development sites with more than thirty residential units.
However, development projects with less than 150 residential units under the URH program are exempt
from, or subject to significantly relaxed enforcement of, the requirements to provide landscaping and
community service facilities. In addition, the development projects for the URH units can benefit from
financial support. They qualify for low-interest loans from the National Housing Fund or the Housing
and Urban Fund, which have been revised since 2015 and were established to encourage the supply of
affordable small to medium-sized residential units.

                      Table 1. Summary of legal, institutional, and financial incentives for URHs.

                                                  URH Program                                  Ordinary Multi-Family House

                                •   The distance between the URH and adjacent           •   The distance between a multi-family house
                                    buildings is 0.25 times the height of the URH.          and adjacent buildings is 0.5 times the
                                •   The number of parking space requirements per            height of the house.
        Building code               residential units is 0.5.                           •   The number of parking space requirements
                                •   Maximum number of building stories that can             per residential unit is 1.0.
                                    be approved is 7.                                   •   Maximum number of building stories that
                                                                                            can be approved is 4.

                                •   The permission and inspection procedures are        •   Conventional permission and inspection
                                    simpler and quicker in small projects with less         procedure is required.
     Institutional support          than 30 units.                                      •   Both landscaping and community service
                                •   Both landscaping and community service                  facilities are compulsory the projects with
                                    facilities are not required in projects with less       more than 30 units.
                                    than 150 units.

                                •   Developers qualify for loans from the National
                                    Housing Fund, or currently the Housing and
       Financial support            Urban Fund, for no less than 70 percent of the      •   Do not qualify.
                                    total construction cost.
                                •   Developers can get these loans with relatively
                                    low interest rates.

2.2. Review of Relevant Studies
     Over past decades, many countries and cities around the world have experienced substantial shifts
in both population and household structures. It is noteworthy that the proportion of elderly people to
the total population has consistently increased; the number of single households has also increased,
while the average number of residents per household has reduced [22]. However, the average size of a
new house has been enlarged since the 1970s. People living alone have different needs from residential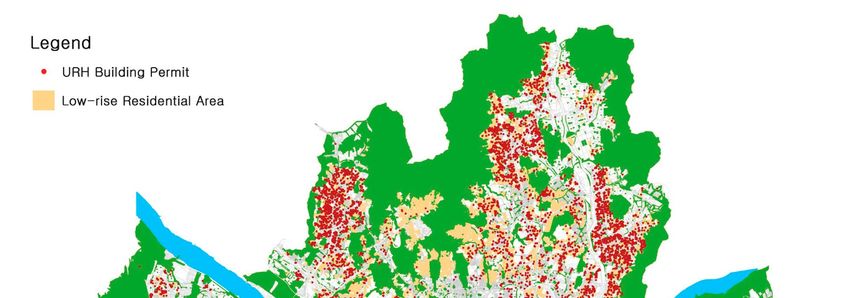
Sustainability 2019, 11, 1934                                                                         4 of 16

structures and different environmental attributes from typical families [7]. Combined with the growing
burden of housing expenses due to soaring housing prices and rents in recent years, the structural
changes urge us to reexamine current housing policies and planning.
      Although the issue of small housing has recently received attention, relatively few studies can
be found. Geffner [9] explored the benefits and challenges of alternative housing typologies (AHTs),
including accessory dwelling units and micro-apartments in many cities in the United States. It was
argued that small housing has gained prominence in the housing market due to changing national
trends and the benefits of AHT development. On the contrary, people on the other side contended that
it might have negative impacts on adjacent communities: higher density, lack of parking spaces, and
an influx of undesirable populations. It was also suggested that current land use regulations based on
the zoning codes hindered small housing developments. They included density regulations, parking
requirements, lot and unit size limits, open space requirements, and mixed land use regulations [8,23].
      According to previous studies, the advantages of small housing can be summarized as
affordability, sustainability, and flexibility [9]. Affordability indicated that small housing is more
affordable for low- and moderate-income households because of their small size and lack of residential
amenities [24]. Small houses are considered affordable by design, which is opposite to what is
affordable by subsidy [25]. Studies of diverse case areas found that small houses rented for less than
typical residences in total, even though they have higher rents per unit area. It is also claimed that
they have played an important role in securing affordable housing units and lowering housing costs
citywide by increasing the total supply of small residences [6,7,10,23,24].
      Sustainability implies that the small housing projects could contribute to a higher density of
existing single-family neighborhoods, which could result in lower automobile dependence, better
walkability, and better access to public transportation [9,26,27]. The White House [28] encouraged
local governments to approve the development of high-density and multi-family housing in order
to accommodate the growing populations in urban centers. Greenhouse gas emissions can also be
reduced by enhancing energy efficiency and reducing automobile dependence in urban areas [22,29,30].
Flexibility suggests that small housing can meet the demands of a new generation of small households.
Some studies found that small houses could allow many current residents to live alone, including
elderly people, while relieving the burden of high housing costs [7,8,17].
      Evans [2] examined the preferences and concerns around integrating small houses into urban
communities located in the southeastern region of the United States. Using a visual preference
survey, it was investigated how small houses should be located and what design elements would be
preferred. It was found that projects specific to the small housing development and the small homes
in a traditional design style were prioritized. The respondents were concerned about the potential
negative effects of small houses on the surrounding property values in their communities.
      Numerous studies have focused on the rents and the residential environment of the URHs in
Korea. Lee and Lee [3] found that while the URH has increased rapidly within a short period, high
rents compared to the income levels of potential residents have aggravated the burden of housing costs
as well. Therefore, they claimed that the public’s role in this system improvement should be to argue
for better affordability and support, as well as a management plan for small urban houses considering
their locational characteristics. Park [11] found the supply and vacancy of URHs are significantly
related to their prices. Lee and Seong [12] argued that the URH plan has contributed to the increase of
small houses, particularly in general residential zones and subway station-oriented areas. However,
considering their high rents, the public must help alleviate the burden for residents.
      Lee et al. [13] reported on the lack of residents’ evaluations on the affordability and the residential
environment, as the policies of the URH placed an emphasis on the efficient provision of housing.
According to their survey, residents have high satisfaction regarding the internal environment (e.g.,
security and privacy), but relatively lower satisfaction with the external environment (e.g., parks
and neighborliness), suggesting the need to improve the residential environment [31]. Lee et al. [14]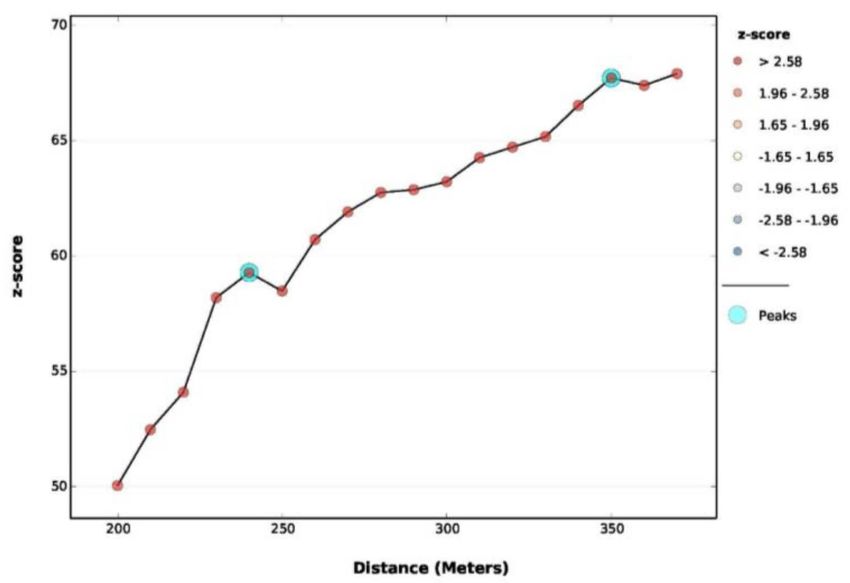
Sustainability 2019, 11, 1934                                                                        5 of 16

examined the effects of location factors of the URHs upon rents. They stated that mixed development
policies on affordable medium-sized sites accessible to public transportation should be encouraged.
      Won and Lee [15] paid attention to how the rents of the URHs were determined in Seoul using the
spatial hedonic price model. They reported that factors such as net residential area and accessibilities
to subway and public facilities exerted positive impacts on rents [32]. However, access to parks had no
impact on rents, suggesting that one and two-person households were unwilling to put a premium on
activities in open spaces. By examining the development characteristics of the URH, Shin and Lee [16]
asserted that a proliferation of small-scale developments within the low-rise residential areas may
result in the deterioration of the residential environment, including insufficient public facilities, breach
of privacy, and more crime. Therefore, a comprehensive management plan should be made in response
to expected harmful consequences.
      An increase in single and two-person households and the demand for small residences are closely
related, and there have been many academic achievements in Korea on this issue. Yi and Lee [19]
examined the spatial characteristics and the residential environments of densely populated residential
areas by the types of single households. They concluded that their residential environments were more
impoverished than the average in Seoul. They stated that the public efforts to improve the residential
environment in the areas were required, however, this could be a driver to augment the prices of
the small urban houses. Having examined the distribution pattern of single households in Busan,
Choi et al. [21] confirmed that the residential environment of one-person households was not good
due to the mix of residential and nonresidential zones. They mainly resided around the downtown
area, universities, and subway stations.
      Lee and Lee [18] maintained that although the number of single and two-person households has
been increasing, the housing stock for two-person households lacked compared to the housing stock
for single households. They suggested that housing policies should consider social mix in terms of
social integration due to the residential diversity of two-person households, according to their age
and income levels. Lee and Yang [33] argued that it was necessary to consider a plan to encourage the
provision of small urban houses in the residential areas around major centers in Seoul. Park et al. [34]
examined how the different characteristics of one-person households affect housing consumption.
It was found that when the number of one-person households increased, consumption of small rental
houses increased; however, this was only limited to one-person households with mid to high-income
ranges. After investigating the factors of single and two-person households on selecting their housing
tenure, Joung and Oh [20] argued that the residential stability should be supported to resolve the
issues regarding the low marriage and low birth rates of the young generation, since the housing costs
played a crucial role in their decision-making.
      Most studies have focused on either the effects of locational and environmental elements on the
housing prices or the impacts of the attributes of the residential environment and the residents on the
residential satisfaction and preference. They helped us understand what benefits the small houses
could give to our communities, what factors significantly affect the rents of the small houses in terms
of affordability, and what elements are more important for potential residents in terms of residential
environment. However, little research has yet been accomplished on what factors have impacts on the
locational pattern of small houses, even in Korea. Few empirical studies are available on the influences
small housing may have on the surrounding community.
      This study has significance in that it expands the scope of analysis to the entirety of Seoul rather
than limited case areas to generalize our insight, and it examines the spatial clustering pattern of the
URH over the decade using GIS and spatial statistical methods. It also differs from existing research in
that it analyzed the impacts of locational and neighborhood residential factors on the formation of the
spatial clustering pattern of the URH.
Sustainability 2019, 11, 1934 6 of 16
3. Methodology
3.1. Hotspot Analysis
When areas with a similar variation of quantity in spatial data, such as land and housing prices,
neighbor each other, a spatial autocorrelation pattern is likely to exist. Tobler [35] has claimed that
although everything is correlated to everything else, the elements closer to each other are more closely
correlated than the others located farther away. One of the most distinguished characteristics of spatial
data is to show the spatial autocorrelation. A spatial pattern analysis determines whether spatial
data displays a specific and significant spatial arrangement. Identifying the spatial pattern is crucial
since it provides fundamental information about the processes affecting their formation. There are
multiple methods of measuring spatial autocorrelation using spatial data. Among them, the I index
suggested by Moran [36] and the G index proposed by Geary [37] are generally used. Moran’s I statistic
is classified into the global statistic and the local statistic. The global Moran’s I measures similarities
between local attribute data and possesses a value between −1 and 1. However, it cannot distinguish
between a hotspot, in which large values are clustered, and a coldspot, in which small values are
clustered. In contrast, the G-statistic can distinguish between spatial concentrations of large and small
values [38].
Using the statistics of Getis-Ord Gi* or Local Indicators of Spatial Association (LISA), a specific
location’s spatial clustering patterns and the changes can be identified. Mainly, Getis-Ord General
G (General G) and Getis-Ord Gi* (Gi*) are used for the hotspot analysis in this study. General G is a
global index representing the spatial autocorrelation as a single value. Using the z-test method, it tests
a null hypothesis that a variable of spatial data is not spatially clustered.
Gi* calculates the z-values of the basic unit of analysis within an entire area. If the z-value of a
specific unit is high and the p-value is less than the significance level, the null hypothesis is rejected.
A hotspot is identified in a unit of analysis, where the z-score is statistically significant and positive.
The greater the z-score is, the more intensive the spatial clustering of high values or hotspots. On the
other hand, a coldspot is determined in a place where the z-score displays a statistically significant
and negative value. The smaller the z-value is, the greater the spatial clustering of low values or
coldspots [38–40]. The equation is as follows.
∑nj=1 ωi,j xi − x ∑nj=1 ωi,j
Gi∗ (d) = r , all j; (1)
2 −( n ω )2 ]
[n ∑nj=1 ωi,j ∑ j=1 i,j
SD n −1
s
∑nj=1 x j ∑nj=1 x2j 2
X= , SD = − (X)
n n
where i, j indicate unit of analysis; xi , xj are the attribute value of i and j; wi,j is the spatial weight
between i and j; and n is the number of the unit of analysis.
In this study, the basic spatial unit for analyzing the spatial clustering pattern is the census
tract presented by Statistics Korea. Using GIS techniques, the permission data of the URHs between
2009 and 2017 are converted to spatial data based on land parcel. By spatially joining the number
of households of the URHs in Seoul, it has been aggregated by each census tract where it is located.
The number of census tracts of the SMA suggested by Statistics Korea is 19,153 units, and the spatial
clustering pattern has been analyzed using 19,061 tracts, excluding the tracts only belonging to the
urban natural parks and the Han River.
The spatial clustering pattern analysis using Gi* examines if a census tract presents a statistically
significant high or low attribute compared to the adjacent areas within a radius from a central census
tract. First, it is necessary to decide an adequate distance for determining a neighbor, as well as a
statistical confidence level. A distance band should be established to include at least one neighbor
from the central unit of analysis. Based on some empirical studies, the distance showing the maximumSustainability 2019, 11, 1934 7 of 16
spatial autocorrelation becomes the reference for determining it. We used the “Generate Spatial Weight
Matrix” function from the ArcGIS program to perform the simulation. This is a method that examines
the point at which the spatial autocorrelation is maximized by starting at 200 m linear distance from
the center of each census tract and incrementing by 10 m until the point is determined. The statistical
confidence level is set at 95%.
3.2. Logit Model
The logit model is used to analyze the impacts of locational and neighborhood residential factors
on the spatial clustering pattern of the URHs. A logit model is a special form of regression model
used when the dependent variable is in a nominal scale. It is applied when a dependent variable only
results in either 1 or 0, such as in the cases of home or car ownership.
In the logit analysis, the ratio of the probability of an event occurring to the probability of not
occurring is called the odds ratio. It indicates how many times the possibility of success due to a choice
is higher than the possibility of failure. Therefore, the effect that the independent variable exerts on the
dependent variable, in the case of a variable’s odds ratio being 1, means that the difference in odds
between the comparative groups is not meaningful. However, an odds ratio greater than 1 reveals that
the odds of an event happening compared to the odds of it not happening increase rapidly, and if it is
smaller than 1, it implies the opposite [38,41].
If x is an explanatory variable and π ( xi ) = P(Y = 1| xi ) in the logit model, the model can be
defined in the linear relationship as follows [29]. In the equation, the odds increase by exp( β) for
one-unit increment in x, which indicates that exp( β) is the odds ratio of the independent variable [41].
π ( xi )
log it[ P(Y = 1| xi )] = log it[π [ xi ]] = ln (2)
1 − π ( xi )
exp( β 0 + β 1 x1 + · · · + β i xi )
log it[π ( xi )] = β 0 + β 1 x1 + · · · + β i xi ; π ( xi ) =
1 + exp( β 0 + β 1 x1 + · · · + β i xi )
Table 2 presents the names, definitions, and data sources of both dependent and explanatory
variables in this research. Two types of dependent variables are considered to estimate different logit
models. Whether a place is a hotspot of the URH or a non-hotspot incorporating a coldspot and an
insignificant spot is considered as a dependent variable in the first logit model. Another logit model
takes account of a hotspot versus a coldspot as a dependent variable.
The independent variables of the model have been limited to those considering data available
at the census tract, centering on the results of previous studies. The potential factors affecting
the formation of the spatial clustering pattern can be classified as the locational factors and the
neighborhood residential attributes. The locational factors are composed of accessibility to public
transport, accessibility to public facilities, and accessibility to jobs, as well as the land price and the
proportion of low-rise residential area. Public transport accessibility considers both subway and bus
accessibility; public facility accessibility includes both college and amenity accessibility; job accessibility
covers the number of jobs in the tract; the land value encompasses average land value appraised in 2017
and the rate of appraised land value change during the past five years. In addition, the neighborhood
residential attributes consider the density of young people in their 20s and 30s divided by the total area,
the proportion of the number of single households to total number of households, and the proportion
of the number of houses over 30 years in age to total number of houses.Sustainability 2019, 11, 1934 8 of 16
Table 2. Definitions and data sources of variables.
Variable Definition Data Source
Hotspot1 1 indicates hotspot, 0 indicates non-hotspot
Dependent var.
Hotspot2 1 indicates hotspot, 0 indicates coldspot
Explanatory var.
Accessibility Subway
The number of subway stations in a census tract
to public accessibility https://data.seoul.go.kr/
transport Bus accessibility The number of bus stations in a census tract
Accessibility College Shortest distance from the center of a tract to the gate
Google map
to public accessibility of nearby college (km)
facilities Amenity Shortest distance from the center of a census tract to
Locational www.nsdi.go.kr/
accessibility nearby amenity (km)
factor
Accessibility The number of employees in a census tract in
Number of jobs https://sgis.kostat.go.kr/
to jobs natural logarithm
Average appraised land value in a census tract in
Average land value
2017 (1000 Korean Won (KRW))
Land value https://data.seoul.go.kr/
Rate of land value Average rate of appraised land value change
change between 2013 and 2017 (%)
Proportion of type 1 and 2 exclusive and general
% of low-rise residential area
residential zones to total area (%)
The population in the 20s and 30s divided by total
Density of young population
area in natural logarithm
Neighborhood https://sgis.kostat.go.kr/
residential Proportion of single households to total
% of single household
factor households (%)
Proportion of houses over 30 years to total
% of deteriorated house
houses (%)
4. Results
4.1. The Supply and Distribution Pattern of the URH
The URH plan was introduced into the revised Housing Act of May 2009. From 2009 to 2017,
the number of permitted URHs in Seoul was 11,187 buildings and 192,638 dwelling units, as shown in
Figure 1. The number of permitted URHs was relatively high in 2012 and 2015: 1894 buildings and
35,014 units in 2012, and 2317 buildings and 35,344 units in 2015. However, the number has declined
sharply since then, especially in 2014 and 2017. The building scale of small houses is determined by
the land area and the floor area ratio given under the National Land Planning and Utilization Act.
Therefore, since the size per house and the number of residential units can vary according to building
plans, the number of permitted buildings and units are not exactly proportional.
Figure 1. The number of permissions of the URH by year.
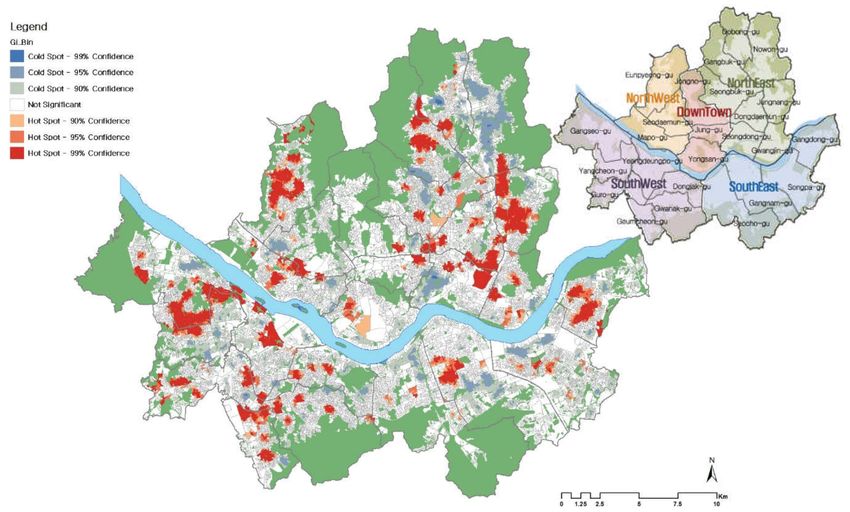
Although the permission of the URH is based on the parcel, for the sake of spatial clustering
pattern analysis, permitted locations were converted to spatial information using GIS techniques.
Figure 2 illustrates the locational information of all permitted URH buildings in the SMA since 2009.
The URHs are more concentrated in the outskirts of Seoul compared to conventional central business
districts (CBDs), such as the Downtown, Gangnam, and Yeongdeungpo districts, and even withinSustainability 2019, 11, 1934 9 of 16
the same district, they are concentrated within specific places. The CBDs are mostly designated as
commercial zones with concentrations of large business and commercial structures, where major
corporations and supporting service industries have a priority to be located compared to residences,
such as URHs. Thus, there is no advantage to them occupying the downtowns in terms of locational
competitiveness. Also, natural settlements without development plans have been distributed around
the downtown areas for a long time. They are irregular in parcel shape and lacking in infrastructure,
which results in many constraints for developing small urban houses.
The outskirts, except for the inner areas in SMA, have been developed deliberately with urban
development plans since the 1960s to address the issue of an insufficient supply of residential areas due
to rapid industrialization and urbanization. Many of them were developed for single and multi-family
houses, with infrastructure such as roads and parking spaces [42]. The number of permitted URHs is
found to be dominant in the general residential zones in Seoul. It is likely to be due to the deterioration
of low-rise residential areas, where single and multi-family houses had been developed since the 1960s.
It seems that URHs have been mainly built to reconstruct the deteriorated low-rise residential areas in
Seoul. This will be examined later in the study.
Figure 2. Distribution of the URH permits and the low-rise residential area in Seoul in 2017.
Descriptive statistics of the permitted URH buildings that was converted to spatial data is
presented in Table 3. The land area is 720 m2 , and the building area is 390 m2 on average, displaying
typical characteristics of small-size urban housing development projects. The number of permitted
buildings within the residential areas is 8561 cases (76.7%), and the average number of floors is 5.9,
indicating that most of them have been permitted upon the low-rise residential zones.Sustainability 2019, 11, 1934 10 of 16
Table 3. Descriptive statistics of permitted URH in Seoul.
Land Area Building Area Total Floor Area Parking Housing No. of
(1000 m2 ) (1000 m2 ) (1000 m2 ) Lot Unit Floors
Average 0.72 0.39 1.44 20.95 34.36 5.87
Standard deviation 38.23 20.91 75.93 1107.08 1815.47 1.89
Minimum 0.00 0.00 0.02 0.00 2.00 2.00
Maximum 10.97 11.75 18.75 482.00 299.00 31.00
Sum 4040.40 2209.95 8024.21 116,993 191,863 -
4.2. Spatial Clustering Pattern of the URH
In order to determine an optimal distance for the spatial clustering pattern analysis, it is crucial to
consider that at least one spatial unit should be included from a spatial unit of analysis. One method
applied in this study is to explore the distance from the centroid of a census tract with the reference
distance of 200 m and increments of 10 m. Through the simulation, we can investigate the distance that
the z-value is maximized. The result, as can be seen in Figure 3, show that at 240 and 350 m, the spatial
autocorrelation is maximized.
Figure 3. Simulation result showing the optimal distance being set.
From the analysis, as can be seen in Table 4, the z-score at 350 m is larger than the value at 240 m.
The optimal distance was finally set at 350 m in this research to analyze the spatial clustering pattern,
while including more adjacent spatial units.
Table 4. Summary of the global clustering pattern analysis.
Distance Observed General G Expected General G Variance Z-Score p-Value
240 m 0.19836 −0.00005 0.00001 58.48452 0.0000
350 m 0.16621 −0.00005 0.00001 67.71605 0.0000
The result of the spatial clustering pattern analysis is shown in Figure 4. Among a total of
19,061 census tracts subjected for the analysis, there are 2962 hotspots and 1805 coldspots. It can be seen
that large hotspots are formed in Gangseo-gu and some parts of the Yangcheon-gu in the southwestern
subregion, Dongdaemun-gu and Seongdong-gu in the northeastern subregion, Eunpyeong-gu in
the northwestern subregion, and some sections of Jungnang-gu in the northeastern subregion in the
metropolitan area. The hotspots can also be observed in Gangdong-gu, Gangnam-gu, Gangbuk-gu,
and Yeongdeungpo-gu.Sustainability 2019, 11, 1934 11 of 16
Figure 4. Local clustering pattern of the URH in Seoul (D = 350 m).
4.3. The Impacts of Factors on the Hotspot
Table 5 presents descriptive statistics of the explanatory variables for estimating the logit models.
They were established to analyze the impacts of factors on the spatial clustering pattern of the URH in
the SMA. As noted earlier, we consider two dependent variables with which different logit models
are specified. The dependent variable of the first model is whether a place becomes a hotspot or a
non-hotspot of the URH, including a coldspot and an insignificant tract. Another logit model takes
account of a hotspot versus a coldspot as a dependent variable. The number of census tracts of the
SMA suggested by Statistics Korea is 19,153 units, and the spatial clustering pattern has been analyzed
using only 19,061 tracts, as explained earlier.
Table 5. Descriptive statistics of explanatory variables.
Logit Model 1 Logit Model 2
Mean Std. Dev. Min Max Mean Std. Dev. Min Max
Subway accessibility 0.43 0.72 0.00 7.00 0.49 0.77 0.00 7.00
Bus accessibility 14.12 7.48 0.00 97.00 14.61 7.02 0.00 47.00
College accessibility 1.63 1.10 0.04 7.27 1.55 0.97 0.06 5.06
Locational Amenity accessibility 0.57 0.34 0.00 2.67 0.57 0.34 0.01 2.67
factor Number of jobs 3.35 2.30 0.00 11.05 3.45 2.20 0.00 10.23
Average land value 3000.48 2113.36 24.60 36,960.00 2867.49 1718.01 31.50 17,315.50
Rate of land value change 18.11 10.41 −68.00 477.63 18.82 10.57 −63.33 311.33
Low-rise residential area 25.91 32.30 0.00 100.00 28.27 33.05 0.00 100.00
Density of young
Neighborhood 9.21 0.84 3.88 12.51 9.40 0.66 4.80 12.51
population
residential
% of single household 29.28 17.58 2.26 91.10 31.42 18.13 2.55 89.06
factor
% of deteriorated house 15.75 24.82 0.00 100.00 11.58 19.32 0.00 100.00
15,237 in total 3740 in total
No. of observation Hotspot = 2874 Hotspot = 2874
Non-hotspot = 12,363 Coldspot = 866
Note: Model 1 only considers 15,237 census tracts in total. This excludes 92 tracts covered by natural parks and the
river, and 3824 tracts with missing values for any one of the explanatory variables.
The results of estimating the logit models incorporating the URH hotspots in Seoul are presented
in Table 6. They include the result dividing the dependent variable into hotspots and non-hotspots,
covering both the coldspots and others, and the result distinctively separating the dependent variable
into hotspots and coldspots.Sustainability 2019, 11, 1934 12 of 16
Table 6. Results of the logit models.
Logit Model 1 Logit Model 2
Variable ((Hotspot = 1, Non-Hotspot = 0) ((Hotspot = 1, Coldspot = 0)
β Std. err. Wald Exp(β) β Std. err. Wald Exp(β)
Constant −8.907 0.421 446.866 ** 0.000 −7.330 0.984 55.475 ** 0.001
Subway accessibility 0.251 0.030 67.610 ** 1.285 0.348 0.084 17.075 ** 1.416
Bus accessibility 0.003 0.003 1.140 1.003 −0.045 0.008 36.652 ** 0.956
College accessibility 0.026 0.021 1.516 1.026 0.251 0.056 20.052 ** 1.285
Locational Amenity accessibility 0.163 0.064 6.481 * 1.177 0.854 0.175 23.929 ** 2.350
factor Number of jobs 0.245 0.015 275.014 ** 1.278 0.478 0.031 235.720 ** 1.612
Average land value −1.39 × 10⁻⁴ 0.000 82.164 ** 1.000 −1.18 × 10⁻⁴ 0.000 12.758 ** 1.000
Rate of land value change 1.344 0.223 32.326 ** 3.833 5.494 0.744 54.580 ** 243.344
Low-rise residential area 0.886 0.069 164.856 ** 2.427 3.556 0.204 303.443 ** 35.007
Density of young
Neighborhood 0.628 0.041 239.548 ** 1.874 0.437 0.094 21.506 ** 1.548
population
residential
% of single household 1.459 0.141 106.548 ** 4.303 5.185 0.389 177.950 ** 178.576
factor
% of deteriorated house −0.915 0.132 48.273 ** 0.400 −0.804 0.263 9.370 ** 0.448
No. of obs. 15,237 3740
Cox and Snell R2 , Nagelkerke R2 0.082, 0.132 0.345, 0.521
Note: * p < 0.05, ** p < 0.01.
While focusing on the result of the first logit model, we can describe how both locational and
neighborhood residential factors influence formation of the URH hotspots as follows. First, between
the two variables of accessibility to public transportation in the locational factor group, subway
accessibility only represents a significantly positive impact upon hotspot formation. At the end of
2017, the subway lines consisted of line 1 to line 9, with six metropolitan connecting routes and one
light rail line in the SMA, which adds up to 16 lines and approximately 681 stations. It indicates that
with higher accessibility to public transportation, especially subway accessibility, the probability of
being a hotspot becomes higher, by catalyzing the development of small houses suitable for catering
to the needs of transit-oriented single and two-person households. However, bus accessibility is not
statistically significant. It suggests that having many bus lines available for residential areas does not
guarantee the active development of small urban houses. On the other hand, the second logit model
shows that bus accessibility is found to be significantly negative. It implies that having many bus
lines in the residential area may exert adverse effects on hotspot formation, e.g., pollution, noise, and
accidents, which discourages the development of URHs.
Second, amenity accessibility has a positive influence on hotspot formation. It means that the
more available amenities exist in the residential area, the more it will induce the development of URHs,
leading to a hotspot. However, college accessibility is statistically insignificant, which indicates that
the development of small urban houses for students around campuses has not yet been optimized.
On the other hand, the result of the second model suggests that accessibility to colleges exerts a
significantly positive effect. There is a total of 95 colleges in the SMA. The second result implies that
there is a possibility that the development of URHs for students is concentrated around campuses.
It also found that accessibility to jobs acts positively on the hotspots of small urban houses. This
indicates that URHs have been developed with concentrations around the downtowns, having high
employment accessibility in Seoul. Higher demand of young single and two-person households for
small urban houses to enhance employment opportunities and accessibility to workplaces results in
the concentration of URHs.
Third, the two variables regarding land value are both statistically significant; however, they have
adverse effects. Average land value shows a negative yet minute influence on the hotspot formation
of small urban residences, meaning that the higher the average land value is, the more it acts as an
obstacle to the development of the URH. This can be understood because high land value increases the
cost of housing development, while lowering the economic validity. On the other hand, the rate of
land value change exerts a substantial positive impact on the hotspot formation of small urban houses.
Our expectation of development profits gets higher in the areas with a high rate of increase in the
land value, which promotes the development of URHs, including financial and institutional incentives.
They are consistent with the outcomes of the second logit model.Sustainability 2019, 11, 1934 13 of 16
The proportion of low-rise residential areas also displays a positive effect on shaping the hotspots.
As the ratio of low-rise residential areas grow higher, it becomes more likely that URHs will be densely
developed in areas in which a hotspot of small urban houses exists. According to Shin and Lee [16],
both high-density and high-rise developments have not been permitted in Seoul where the number of
floors in the low-rise residential zone has been stipulated by the planning ordinance. URHs have been
mostly developed in general residential zones, helping to confirm that they are closely linked with
low-rise residential areas, as shown in Figure 2.
Fourth, although the three variables in the neighborhood residential factor group are all
statistically significant, they show different impacts on the hotspot formation of URHs. First, the
density of the young population positively influences formation of hotspots. A high percentage of
residents in their 20s and 30s indicates that the demand for small urban residences is high. In the areas
where the major consumer group dominantly resides, the development of URHs is more likely to be
concentrated, leading to a hotspot. The ratio of single households also plays a positive role in creating
a hotspot. In the residential areas with a high number of single households, there is a high demand for
small residences for them, and the potential for small residences to be developed is high to meet the
demand. Lee and Seong [12] claimed that the proportions of single households in their 20s and 30s
were 25.7% and 25.0%, respectively; therefore, the higher the ratio of single households, the greater the
likelihood that URH development is promoted.
The proportion of deteriorated houses has a significantly negative effect on hotspot formation.
It was initially expected that the higher the ratio of decrepit housing, the greater the demand for new
housing development would be, resulting in a hotspot of small urban houses. However, it can be
disputed by two findings. The first is that the old residential areas with a high ratio of decrepit houses
are more frequently inhabited by three- and four-person households and aged households than by
single and two-person households. They do not have a high percentage of small urban housing, and
elderly households do not favor new developments replacing the existing houses, which results in a
negative relationship between them. The second reason is that the ratio of decrepit houses and the
supply of URHs are in a reciprocal relationship. When a URH is built in an area in which decrepit
houses are largely located, the proportion of decrepit houses declines naturally. The lower the supply
of new small houses in a residential area is, the more likely it is that decrepit residences are maintained,
resulting in a high ratio of decrepit residences.
Finally, in terms of comparing the odds ratio between the explanatory variables in the first model,
that of the proportion of single households is the highest. The rate of land value change, the proportion
of low-rise residential area, and the density of the young population are also relatively high. It indicates
that these variables have a comparatively high magnitude of impact on the hotspot formation of URHs.
The ratio of single households and the density of the young population are positively correlated with
the demand for small urban houses. The rate of change in land value means a greater expected profit
for housing developers. The ratio of the low-rise residential area indicates the site in which small
houses can be developed. In other words, it is more likely that the URH hotspots are in areas where
there are many sites for development, high demand, and high expectation of profits from the URHs.
In addition, the higher the accessibilities to subways and amenities, and the more opportunities for
employment, the more likely the area is to be developed for small urban housing.
5. Conclusions and Implications
It has been a decade since the introduction of the URH program that aimed at securing residential
stability, improving amenities in residential environments, and providing affordable small urban
housing for single and two-person households. Focusing on the URH in Seoul, this research intends
to analyze the development characteristics and spatial clustering patterns of URHs. The study also
aims to examine the impacts of various locational and neighborhood residential factors on the hotspot
formation of URHs and to propose policy implications. The major findings of this study can be
summarized as follows.Sustainability 2019, 11, 1934 14 of 16
First, the number of permissions for URHs from 2009 to 2017 was 11,187 buildings and 192,638
residential units. The URHs are more frequently distributed in the outskirts compared to the
conventional downtowns and are mostly located in the general residential zones. This is mainly
because they play a major role in renewing low-rise residential areas that have been deteriorated
during the urbanization process from the 1960s onwards in SMA.
Second, the URHs represent a meaningful spatial clustering pattern when they are aggregated
by census tracts as the spatial unit of analysis. The hotspots for URHs are found to be similar to the
areas in which the housing developments have been concentrated for ten years. However, the places
in which high-rise and multi-family houses (such as apartments) are mainly observed are more likely
to be the coldspots.
Third, both locational and neighborhood residential factors have significant impacts on URH
hotspot formation in Seoul. Among the locational factors, accessibility to subway stations, amenities,
and jobs play significantly positive roles for building up a URH hotspot. Variables regarding land
value significantly influence hotspot formation. Average land value shows a negative effect; however,
the rate of land value change displays a strong positive impact on hotspot formation. The proportion of
low-rise residential areas has a strong influence on forming hotspots, implying that URHs are likely to
be concentrated in low-rise residential areas in Seoul. Among the neighborhood residential attributes,
both the density of the young population and the ratio of single households significantly contribute to
the concentration of URHs.
On the other hand, the proportion of decrepit houses shows a negative effect on hotspot formation.
To summarize, the URH hotspots are more likely to be built in areas having many available sites for
development, high demand for habitation, and high expected profits from development of housing.
It is also important to secure higher accessibility to subways, amenities, and employment centers.
Some policy implications can be suggested as follows. Above all, the places with distinct spatial
clustering patterns of small urban houses, such as areas adjacent to subway stations and employment
centers, are expected to have higher rental costs compared to other places. This means that single and
two-person households residing in Seoul are more likely to live in areas with relatively higher rents.
Thus, it is necessary to propose a rent subsidy program in order to increase affordability for single and
two-person households. It is also needed to consider a policy to encourage the development of URHs
in nearby hotspots with relatively lower land values.
Second, URHs have mostly been developed in low-rise residential areas in the SMA, i.e.,
the general residential zones with sites available for development. The pressure toward the
development of URHs is expected to continue in these areas in Seoul, mainly due to the relaxation
of building codes and institutional support. However, development projects for URHs in the SMA
have only been based upon individual lots, which suggests that they do not consider providing public
amenities and infrastructure, mainly due to economic feasibility. The community plans established by
both the metropolitan and the local governments do not take them into account. Thus, it is expected
that the residential environment will deteriorate due to the lack of roads, parks, and parking spaces.
Therefore, it is crucial to establish policies and strategies for planning the housing supply and managing
the residential environment in the low-rise residential areas.
Third, the fact that the URH hotspots in Seoul are meaningfully influenced by the land value,
the rate of land value change, and accessibility to amenities indicates that the clustering pattern of
small urban houses relies on regional characteristics. Therefore, it is necessary to establish detailed
planning criteria and management guidelines considering the features of supply and demand for small
urban housing in these places. It is further required to consider establishing a comprehensive plan
for each autonomous borough, including regulations and incentives for floor area ratio, standards for
parking lots, and improvement of the residential environment.
This research only pays attention to the spatial clustering pattern and the factors affecting the
pattern of URH locations in Seoul. More research is required on how small urban houses are spatially
expanded and concentrated in urban areas, and how the accumulation of small houses influencesSustainability 2019, 11, 1934 15 of 16
the surrounding communities in terms of the residential environment and satisfaction. More studies
are also needed on how the rents of small urban houses are determined and what factors affect the
residential choice of single and two-person households.
Author Contributions: M.-C.S. and J.-S.L. made substantial contributions to research design, data collection and
analysis, and interpretation of the results; played an important role in drafting and revising the manuscript;
gave final approval of the version to be submitted and published. G.-M.S. made contributions to acquisition and
analysis of data, and revision of the manuscript.
Funding: This research received no external funding.
Conflicts of Interest: The authors declare no conflict of interest.
References
1. Statistics Korea. Korean Statistical Information Service. Available online: http://kosis.kr/statHtml/statHtml.
do?orgId=101&tblId=DT_1JC1516&vw_cd=MT_ZTITLE&list_id=A12_2015_1_10_10&seqNo=&lang_mode=
ko&language=kor&obj_var_id=&itm_id=&conn_path=MT_ZTITLE (accessed on 12 December 2018).
2. Evans, K. Exploring the relationship between visual preferences for tiny and small houses and land use
policy in the southeastern United States. Land Use Policy 2019, 81, 209–218. [CrossRef]
3. Lee, J.S.; Lee, D.H. A Research on Current State of and Policy Suggestions for Urbanistic Housing in Seoul; The Seoul
Institute: Seoul, Korea, 2012.
4. Maeng, D.M.; Jang, N.J.; Baik, C.N. Current Condition and Policy Direction for Low-Rise Residential Areas in
Seoul; The Seoul Institute: Seoul, Korea, 2016.
5. Seoul Metropolitan Government. Seoul Open Data Square. Available online: http://data.seoul.go.kr/
dataList/datasetView.do?infId=234&srvType=S&serviceKind=2 (accessed on 11 December 2018).
6. Rudel, T.K. Household change, accessory apartments, and low income housing in suburbs. Prof. Geogr. 1984,
36, 174–181. [CrossRef]
7. Urban Land Institute. The Macro View on Micro Units; Urban Land Institute: Washington, DC, USA, 2014.
8. Gabbe, C.J. Looking through the lens of size: Land use regulations and micro-apartments in San Francisco.
Cityscape 2015, 17, 223–238. [CrossRef]
9. Geffner, T. Towards a Smaller Housing Paradigm: A Literature Review of Accessory Dwelling and Micro
Aapartments. Bachelor Thesis, Portland State University, Portland, OR, USA, 2018.
10. Stern, E.; Yager, J. 21st Century SROs: Can Small Housing Units Help Meet the Need for Affordable Housing in
New York City? NYU Furnam Center: New York, NY, USA, 2018.
11. Park, H.M. An analysis of the factors affecting on the prices of the urban-life housing type of the structure of
the urban spaces in Seoul: Focused on the system of structured spaces in the basic city planning of Seoul
2030. J. Korea Plan. Assoc. 2013, 48, 419–435.
12. Lee, J.S.; Seong, S.Y. Development characteristics and supply effect evaluation of Urban-type housing in
Seoul. J. Korea Plan. Assoc. 2013, 48, 305–317.
13. Lee, J.S.; Seong, S.Y.; Lee, D.H. A study of supply patterns and residential characteristics of urban-type
housing in Seoul. J. Korean Hous. Assoc. 2014, 25, 1–9.
14. Lee, D.H.; Lim, M.H.; Ko, S.C. A study on the factors affecting the rent of urban life housing in Seoul by
quantile regression. J. Korean Reg. Dev. Assoc. 2015, 27, 143–164. [CrossRef]
15. Won, J.W.; Lee, J.S. Investigating How the rents of small urban houses are determined: Using spatial hedonic
modeling for urban residential housing in Seoul. Sustainability 2018, 10, 31. [CrossRef]
16. Shin, M.C.; Lee, J.S. Investigating the pattern of small-scale development and the characteristics of residential
environment in low-rise residential area: Urban residential housing development areas in Seoul. Seoul Stud.
2018, 19, 81–101.
17. Chapman, N.J.; Howe, D.A. Accessory apartments: Are they a realistic alternative for ageing in place?
Hous. Stud. 2001, 16, 637–650. [CrossRef]
18. Lee, J.S.; Lee, S.S. Residential conditions and spatial patterns of two-person households in Seoul: Multivariate
analysis using GIS. J. Korean Hous. Assoc. 2013, 24, 49–56. [CrossRef]
19. Yi, C.Y.; Lee, S.G. Analysis of single household areas and evaluation of their residential environment in
Seoul. Seoul Stud. 2010, 11, 69–84.Sustainability 2019, 11, 1934 16 of 16
20. Joung, H.J.; Oh, D.H. A study on the factors affecting housing tenure of single or two-person households of
young generation. J. Korea Plan. Assoc. 2014, 49, 95–113. [CrossRef]
21. Choi, Y.; Shin, J.H.; Park, W.J. Analysis of distribution and highly density area pattern of one-person
household: Pusan metropolitan’s case. J. Korean Soc. Civ. Eng. 2012, 32, 655–662. [CrossRef]
22. Housing and Urban Development. The Case for Small Home Design as a Component of Sustainability
Efforts. PD&R Edge. 2015. Available online: https://www.huduser.gov/portal/pdredge/pdr-edge-featd-
article-080816.html (accessed on 10 February 2019).
23. Been, V.; Gross, B.; Infranca, J. Responding to Changing Households: Regulatory Challenges for Micro-Units and
Accessory Dwelling Units; What Works Collaborative White Paper; NYU Furman Center: New York, NY,
USA, 2014.
24. Wegmann, J.; Chapple, K. Understanding the Market for Secondary Units in the East Bay; No. 2012-03. Working
Paper; Institute of Urban and Regional Development: Berkeley, CA, USA, 2012.
25. Karlinsky, S.; Szambelan, S.J.; Wang, K. Room for More: SPUR’s Housing Agenda for San Jose; SPUR: San Jose,
CA, USA, 2017.
26. Lee, J.S.; Nam, J.; Lee, S.S. Built environment impacts on individual mode choice: An empirical study of the
Houston-Galveston metropolitan area. Int. J. Sustain. Transp. 2014, 8, 447–470. [CrossRef]
27. Lee, J.S.; Lee, S.K.; Jun, J. Connections between land use and driving distance: Causal investigation using
directed acyclic graphs. J. Urban Plan Dev. 2014, 140, 06014001. [CrossRef]
28. The White House. Housing Development Toolkit; Report Prepared by the White House and Released September;
The White House: Washington, DC, USA, 2016.
29. Accessory Dwelling Units in Portland, Oregon: Evaluation and Interpretation of a Survey of ADU Owners.
Available online: https://pdxscholar.library.pdx.edu/cgi/viewcontent.cgi?referer=https://scholar.google.
co.kr/&httpsredir=1&article=1040&context=trec_seminar (accessed on 10 February 2019).
30. Ewing, R.; Pendall, R.; Chen, D. Measuring sprawl and its transportation impacts. Transp. Res. Rec. 2003,
1831, 175–183. [CrossRef]
31. Jin, J.; Lee, H.Y. Understanding residential location choices: an application of the UrbanSim residential
location model on Suwon, Korea. Int. J. Urban Sci. 2016, 22, 216–235. [CrossRef]
32. Ki, C.O.; Jayantha, W.M. The effects of urban redevelopment on neighbourhood housing prices. Int. J.
Urban Sci. 2010, 14, 276–294. [CrossRef]
33. Lee, J.S.; Yang, J.S. A study of the characteristics and residential patterns of single-person households and
their policy implications in Seoul. Korea Plan. Assoc. 2013, 48, 181–193.
34. Park, B.L.; Kim, J.H.; Choi, M.J. Housing tenure of single person households: Focusing on age and income
factors. Korea Plan. Assoc. 2013, 48, 149–163.
35. Tobler, W.R. A computer movie simulating urban growth in the Detroit region. Econ. Geogr. 1970, 46, 234–240.
[CrossRef]
36. Moran, P.A.P. Notes on continuous stochastic phenomena. Biometrika 1950, 37, 17–23. [CrossRef] [PubMed]
37. Geary, R.C. The contiguity ratio and statistical mapping. Incorp. Stat. 1954, 5, 115–146. [CrossRef]
38. Lee, H.Y.; Noh, S.C. Advanced Analysis in Statistics: Practice and Theory, 2nd ed.; Moonwoosa: Goyang-si,
Korea, 2015; pp. 228–619. ISBN 979-11-951034-0-9.
39. Getis, A.; Ord, J.K. The analysis of spatial association by use of distance statistics. Geogr. Anal. 1992, 24,
189–206. [CrossRef]
40. Ord, J.K.; Getis, A. Local spatial autocorrelation statistics: Distributional issues and an application.
Geogr. Anal. 1995, 27, 286–306. [CrossRef]
41. Agresti, A. Categorical Data Analysis, 2nd ed.; John Wiley & Sons Inc.: Hoboken, NJ, USA, 2007; ISBN
978-0-471-22618-5.
42. Seoul Metropolitan Government. Seoul Solution. Available online: https://seoulsolution.kr/ko/content/
%ED%86%A0%EC%A7%80%EA%B5%AC%ED%9A%8D%EC%A0%95%EB%A6%AC%EC%82%AC%
EC%97%85 (accessed on 12 December 2018).
© 2019 by the authors. Licensee MDPI, Basel, Switzerland. This article is an open access
article distributed under the terms and conditions of the Creative Commons Attribution
(CC BY) license (http://creativecommons.org/licenses/by/4.0/).You can also read