R 606 - The impact of the COVID-19 shock on labour income inequality: Evidence from Italy - Banca d'Italia
←
→
Page content transcription
If your browser does not render page correctly, please read the page content below
Questioni di Economia e Finanza
                (Occasional Papers)

                The impact of the COVID-19 shock on labour income inequality:
                Evidence from Italy

                by Francesca Carta and Marta De Philippis
February 2021

                                                                      606
                                                             Number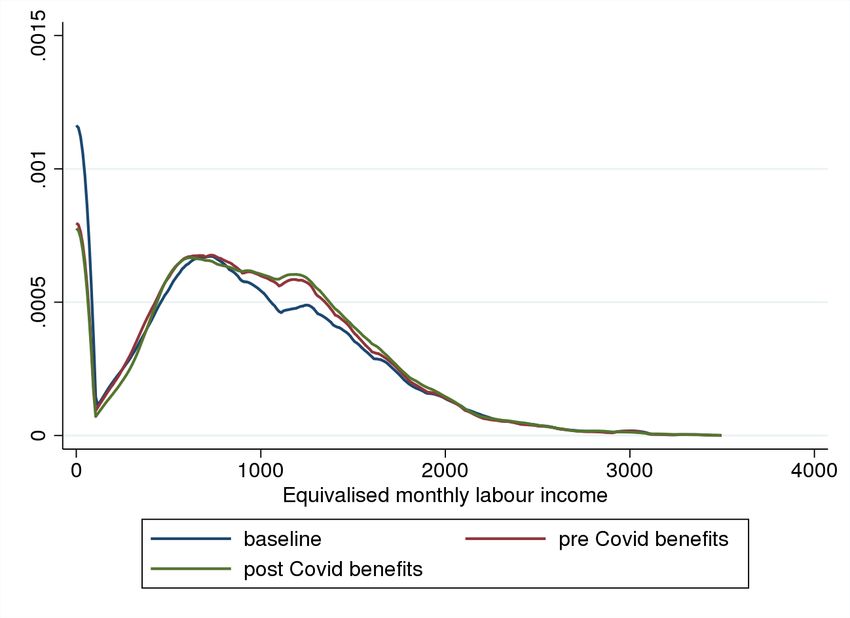
Questioni di Economia e Finanza
(Occasional Papers)

The impact of the COVID-19 shock on labour income inequality:
Evidence from Italy

by Francesca Carta and Marta De Philippis

Number 606 – February 2021
The series Occasional Papers presents studies and documents on issues pertaining to
the institutional tasks of the Bank of Italy and the Eurosystem. The Occasional Papers appear
alongside the Working Papers series which are specifically aimed at providing original contributions
to economic research.

                 The Occasional Papers include studies conducted within the Bank of Italy, sometimes
in cooperation with the Eurosystem or other institutions. The views expressed in the studies are those of
the authors and do not involve the responsibility of the institutions to which they belong.

                 The series is available online at www.bancaditalia.it .

ISSN 1972-6627 (print)
ISSN 1972-6643 (online)

Printed by the Printing and Publishing Division of the Bank of Italy
THE IMPACT OF THE COVID-19 SHOCK ON LABOUR INCOME INEQUALITY:
EVIDENCE FROM ITALY
by Francesca Carta* and Marta De Philippis*
Abstract
The spread of the pandemic and the consequent adoption of lockdown measures to
prevent infections had severe consequences for business activity and employment. By using
data from the Italian Labour Force Survey, this paper simulates the effect of the COVID-19
crisis on the dynamics and distribution of equivalized labour income in the first two quarters
of 2020. Moreover, it assesses the effectiveness in smoothing labour income losses of the
social insurance benefits that were in place before the crisis and of the temporary measures
adopted by the Italian Government to face it. We find that the economic repercussions of the
COVID-19 shock impacted low-income households more heavily than higher income
families, implying a substantial increase in labour income inequality. However, our results
show that the social insurance benefits temporarily introduced by the Italian Government
were able, at least in the short term, to compensate for these income losses and for the
increased inequality significantly more than the pre-crisis measures.
JEL Classification: H20, J20, D31.
Keywords: labour market, inequality, social insurance benefits, recessions, coronavirus,
Covid-19.
DOI: 10.32057/0.QEF.2021.606
Contents
1. Introduction ......................................................................................................................... 5
2. Measuring family labour income in the ILFS ..................................................................... 9
3. The impact of the Covid-19 shock on Italian households: preliminary evidence ............. 11
4. The impact of the Covid-19 shock and social insurance benefits on labour income ........ 11
4.1. Estimating the labour income loss at individual and family level.............................. 11
4.2. Results: the effects along the income distribution ...................................................... 13
4.3. The effects on inequality ............................................................................................ 14
4.4. Robustness checks ...................................................................................................... 15
5. Conclusion ......................................................................................................................... 16
References .............................................................................................................................. 18
Figures and Tables ................................................................................................................. 21
Appendix A - Additional Tables and Figures ........................................................................ 25
Appendix B - Main features of the Italian social insurance benefits before and during
the Covid-19 emergency.................................................................................................... 27
_______________________________________
* Bank of Italy, Structural Economic Analysis Directorate.1 Introduction1
The economic repercussions of the COVID-19 pandemic impacted workers asymmetrically. The
existing evidence points out that inequalities increased, since the shock mainly affected workers
with unstable and poorly protected jobs (see for instance Blundell et al., 2020).2 Quantifying
the distributive implications of the crisis and the effectiveness of the social insurance benefits
introduced to support labour income all around the world is therefore of primary importance.
Given the burden that such policies place on public finances, a timely analysis of their effects is
informative as to how best to address economic resources during the recovery and in the event
of new waves of infection.
This paper estimates the dynamics of the distribution of Italian households’ labour income
in the first half of 2020 and it assesses the short run effectiveness of the social insurance benefits
put in place to support income losses. We focus on Italy, which was the first European country
hit by the COVID-19 pandemic and that acted as a front runner in the implementation of
lock-down and income support measures. The policies adopted to contain the spread of the
pandemic were severe and let to the complete shutdown of many business activities. Many
individuals were unable to work, with potentially dramatic consequences for overall employment
and inequality. With the aim of limiting these losses, the Italian Government issued several
decrees that enhanced existing social insurance benefits and introduced new ones. Some form
of income support was basically guaranteed to all types of workers. This contributed to a
substantial increase in public spending: according to the latest European Commission autumn
forecast, current primary spending in 2020 will reach 828.8 billion euro (it was 748.3 billion in
2019).
The characteristics of the Italian labour market, with a relatively large share of self-employed
and temporary workers, and of its social insurance system, which typically gives more protection
to employees with permanent contracts, are such that the economic crisis due to COVID-19
might have triggered a rapid increase of income disparities and poverty. The incidence of poverty
in Italy largely increased with the financial and sovereign-debt crises and it was still very high,
in comparison with the European Union average, even before the COVID-19 emergency.3
For our analysis, we use data on the fourth quarter of 2019 from the Italian Labour Force
Survey (ILFS),4 the main database for the official labour market statistics. The ILFS contains
information on monthly net wages for employees. To get a measure of labour income for
self-employed individuals we follow the imputation methodology developed by Carta (2019),
1
The views expressed in the article are those of the authors only and do not necessarily reflect of the Bank of
Italy. We are grateful to Fabrizio Balassone, Andrea Brandolini, Francesco D’Amuri, Ruben Durante and Eliana
Viviano for their helpful comments. The usual disclaimer applies. All errors are ours.
2
Another strand of the literature has focused on how income poverty and inequality have contributed to increase
the infection rate (see Brown and Ravallion, 2020 among others).
3
According to the latest data released by Eurostat (2020), the share of people at risk of poverty or social exclusion
was 27.3% in 2018 in Italy, 5.5 p.p. more than the EU average.
4
Although we currently have the ILFS micro data for the first two quarters of 2020, we need to simulate the
Government’s intervention on the basis of the pre-COVID labour income, for this reason we use data for the
last quarter of 2019. An alternative way to proceed is to use the panel component of the data. We prefer
not to take this route this since the sample size is much smaller and, as reported by Istat, the impossibility to
run the survey through in-person interviews reduced – presumably in a non-random way – the total number of
interviews collected in 2020 by about 10% with respect to 2019. However, we employ the cross-sectional data
for the first two quarter of 2020 to run robustness checks for the validity of our simulations.
5which exploits both the richness of the ILFS and external data sources. In particular, we
impute employees’ wages to self-employed workers by means of a simple linear regression model
as in Mincer (1974). Then, we rely on the Survey on Household Income and Wealth (SHIW,
run by the Bank of Italy) – that provides self-employed incomes but with a significant delay
with respect to the reference period – to adjust the average income of self-employed persons to
take into account that it might differ statistically from employees’ wages even when controlling
for observable characteristics. Finally, we focus on the subset of Italian households that is more
likely to rely on labour income as its main income source, i.e. households whose reference person
is 15-64 years old and where there are no retirees. These households represent about 60% of
Italian families (70% of the overall population) and for them labour income is about 80% of
disposable income. This selection allows us to avoid the misclassification of households with
no labour income as zero-income families, which would greatly affect the inequality measures
and undermine the possibility to use them as proxies for the overall income inequality (Carta,
2019).
Based on the individual and family labour incomes computed for the last quarter of 2019,
we simulate the average labour income losses for workers and their families in the first two
quarters of 2020, in the absence of any income support programme. We introduce hypotheses
on: i ) the reduction in hours worked per sector, calculated on the basis of the information about
the sectorial drop in value added recorded in the first six months of 2020 and by applying an
elasticity of hours worked to GDP consistent with that observed at the aggregate level from the
National Account data; and ii ) the growth rate of hourly wages, which we assume to follow that
observed for negotiated wages in the first two quarters of 2020. Then, we assess how the social
insurance benefits in place before the COVID-19 emergency, and those specifically introduced
to face the pandemic, are able to absorb the labour income losses, and what their implications
are in terms of inequality. Starting from March 2020, the Italian Government has acted in two
main directions to support workers:5 on the one hand, it banned dismissals of all employees
and it strongly increased the sectorial coverage of short-time work scheme programmes, which
before the COVID-19 emergency were mainly available to firms with at least five employees or
to companies operating in the industrial sector. On the other hand, it introduced a lump sum
bonus, of the average amount of about 600 euro, for almost all self-employed workers who were
not protected by any social insurance programme before the emergency.
We find that, in the absence of social insurance benefits, the crisis would have had a
significant effect on the distribution of labour income. First, lock-down measures affected poorer
families the most, as members of lower income households were more likely to be employed in
non-essential sectors and to have, on average, fewer possibilities to work from home. The
share of household members who, at the end of 2019, were employed in locked-down sectors is
higher in households in the bottom 20% of the equivalized labour income distribution, and it is
decreasing along the distribution. On the contrary, the share of household members employed
in occupations that can be carried out from home increases along the equivalized labour income
distribution. Moreover, younger individuals with temporary or seasonal contracts, who earn
5
In this paper we focus only on social insurance programmes for workers and we neglect other types of income
support programme, like the minimum guaranteed income (the “Citizenship income”).
6lower wages on average, were hit hardest by the crisis as they experienced the largest employment
losses. Therefore we estimate that, in the absence of social insurance benefits, inequality would
have increased significantly: the Gini index on equivalized labour income would have risen by
4.0 percentage points in the first semester of 2020, from 34.8% in 2019.
Moreover, we find that, in the short term, the social insurance benefits available compensated,
at least partially, for income losses and for the increased inequality, especially thanks to the new
measures specifically introduced by the Government to face the COVID-19 emergency. When
taking into account the newly adopted social insurance benefits, the Gini index on equivalized
labour income would have gone back to the pre-crisis levels. This result suggests that in the
short term the policies implemented to support workers were, on average, effective and helped
low-income households to a relatively greater extent. We find that most of the relief, relative to
the pre-COVID safety nets, came from the lump sum bonus given to all self-employed individuals
during the spring months of the emergency. This represents a substantial difference with respect
to the pre-COVID safety nets scenario, since self-employed are traditionally not insured against
cyclical income losses in Italy. The extension of short-time work schemes was also important,
but it is less visible when we compare the scenario with COVID-19 instruments with that with
the pre-existing safety nets. In the latter scenario, employees not covered by short-time work
schemes access unemployment benefits, which provide quite similar income support. Differences
between obtaining income support through unemployment benefits or through short-time work
schemes arise in the longer term: while the latter preserve job matches during temporary
downturns, they may create inefficiencies in the medium to long run (Giupponi and Landais,
2018). To assess the medium term consequences of the COVID crisis and the effectiveness of
the safety nets introduced to face it in reducing labour income inequality, it therefore remains
crucial to monitor the ability of the labour market to reabsorb displaced workers.6
The ILFS is not generally used for the analysis of income inequality, but – for the scope
of our analysis – it has a clear advantage with respect to standard household income surveys.
The ILFS is released on a quarterly basis, with a delay of about 5-6 months with respect to
the reference period; standard household income surveys (like the European Union Statistics
on Income and Living Conditions, SILC) have a delay of about 2-3 years. For this reason,
the latter are not ideal for the study of more recent developments in inequality, which call for
prompt government action, as the COVID-19 crisis does. To provide nowcasted estimates of
inequality and poverty it is instead becoming popular to use microsimulation models, which are
based on standard household income surveys and update past income information in the light
of changes in macroeconomic conditions and in the social benefit system (see Navicke et al.,
2014, among others). However, these models do not properly capture heterogeneous changes in
labour market conditions occurring in the years not covered by the survey. The ILFS makes
it possible to obtain a timelier measure of family and equivalized labour income, as developed
in Carta (2019); in this way, we have information on inequality trends more than 12 months
earlier than in standard household income surveys. Our microsimulation exercise is limited to
only two quarters, rather than referring to 2-3 years.
Our paper contributes to several strands of the existing literature. First, to the growing
6
For a comprehensive description of the channels affecting inequality in the long term see Blundell et al. (2020).
7evidence of the impact of COVID-19 on the labour market and on the labour income distribution
(see among the others Adams-Prassl et al., 2020, Han et al., 2020 and Aspachs et al., 2020).7 We
contribute to this literature by developing a simulation exercise able to provide timely estimates
of the impact of the pandemic – and of the measures introduced by the Government – on the
main inequality indices. Our methodology distinguishes us from the existing papers because it
relies on a dataset, the Labour Force Survey, which is easily available with little delay in almost
all countries around the world and, differently from most of the recently used private sector
real time income data, it is representative of the entire population. Furthermore, our data
contain very detailed information on individual past working experience, and therefore allow
us to swiftly and accurately simulate the extent to which individuals are possibly eligible for
the different policy instruments. We can thus assess which policy is more effective in absorbing
the effects of the crisis, and which features of the design of these measures could possibly limit
their effectiveness.8 Our data moreover allow us to focus on the household dimension rather
than on individual workers, and therefore to take into account intra-family transfers and the
household composition. Finally, they allow us to include self-employed workers as well, that
are often neglected in analyses on earnings inequality because of the difficulty in providing a
reliable labour income measure (see, for instance Brandolini et al., 2012). Although we impute
self-employed income, some robustness checks support the validity of our measure. In addition,
our paper contributes to the existing literature because it considers a country, Italy, whose labour
market features and institutions are similar to those of other countries in Continental Europe,
and that was one of those hardest hit by the COVID-19 pandemic. We therefore believe that
our results can provide useful insights also for other European economies that may experience
the need to implement similarly extreme measures to contain the spread of the pandemic. As
for Italy, to our knowledge this is the first paper using timely income data to evaluate the effect
of the COVID-19 pandemic on labour income inequality in the first two quarters of 2020 (for
analyses of the effects of the COVID-19 crisis relying on past income data and usually only
focusing on the first three months of lock-down, see also Guiso and Terlizzese, 2020; Figari and
Fiorio, 2020; IRPET, 2020; Gallo and Raitano, 2020 and MEF, 2020). Bonacini et al. (2020)
also study the possible consequences of the COVID-19 pandemic on income inequalities in Italy,
but they only explore the role of an increase in the number of working-from-home jobs; they
find that there is a high risk of exacerbating existing inequalities.
More generally, our paper also contributes to the literature that studies the impact of
economic downturns on labour market outcomes (for instance, among many, Hoynes et al., 2012
and Elsby et al., 2010, for Italy see D’Amuri, 2011), as well as to the studies that analyze the
7
The literature on the immediate impact of the COVID-19 pandemic is flourishing and looks at several outcomes.
For reviews see for example Brodeur et al. (2020); Boissay et al. (2020). Chetty et al. (2020) provide a broad
analysis on many economic outcomes (spending, business revenues and employment rates) and the mechanisms
through which the COVID-shock impacted the economic activity, by using private sector real time data. They
conclude that social insurance policies are more effective than traditional macroeconomic tools (stimulus for
aggregate demand, liquidity provision) when consumer spending is constrained by health concerns.
8
In line with Han et al. (2020), we use non-standard data sources to gather information on updated trends
in inequality and poverty. Similar attempts belong to the growing literature aimed at “nowcasting” main
macroeconomic outcomes with the use of timelier-non standard datasets (see for example Banbura et al.,
2013). Alternatives methods are developed with microsimulation models; see for example Navicke et al. (2014);
Stoyanova and Tonkin (2016); Gasior and Rastrigina (2016).
8importance of different social insurance policies in smoothing temporary economic shocks. For
instance, we speak to the literature about short-time work schemes (Giupponi and Landais, 2018;
Cahuc et al., 2018), as one of the main policies implemented by the Italian Government during
the COVID-19 emergency was a generous extension of the short-time work scheme programme,
and to the literature on the role of unemployment benefits in buffering economic shocks (see for
instance Rothstein, 2011; Hagedorn et al., 2019; Boone et al., 2020).
The paper is organized as follows. Section 2 describes the characteristics of the data we
use. In Section 3 we provide preliminary evidence of the impact of the COVID-19 crisis on
employment across sectors. Section 4 illustrates the assumptions and results of our simulations
according to different scenarios. Finally, Section 5 concludes.
2 Measuring family labour income in the ILFS
The ILFS is released on a quarterly basis, with a delay of about 5-6 months with respect to
the reference period; standard household income surveys (like the SILC or the SHIW) feature
a delay of about 2-3 years. For this reason, the latter are not ideal for the study of more
recent developments in inequality, which call for prompt government action, as in the case of
the COVID-19 crisis.
For our analysis we follow the methodology developed by Carta (2019) in order to estimate
in the ILFS data a measure of individual and family monthly labour income on a quarterly or
yearly basis. Indeed, as the author shows, the ILFS-based inequality indicators, provided for
a certain sub-sample of Italian households, represent a good and timelier (of about 12 months
earlier) proxy for overall disposable income inequality.
Carta (2019)’s approach builds on three main steps. First, she shows that labour income
inequality is a good proxy for disposable income inequality, especially when focusing on those
households most attached to the labour market – where the reference person is 15-64 years
old and there are no retirees. Although the importance of income sources other than labour –
such as social transfers or capital income that are not measured in the ILFS – has increased
over time, labour income still represents a significant fraction of Italian households’ disposable
income: 60% for the entire population of households; 80% for the sub-sample of families mostly
attached to the labour market (Bank of Italy, 2018, SHIW). Moreover, labour income inequality
is the main driver of disposable income inequality, accounting for more than 50% of it (see also
Raitano, 2016).
Second, following the previous point, she develops her analysis on the sample of Italian
households that are more likely to rely on labour as their main income source. The sample is
selected excluding families in which the Reference Person (RP) is not of working age (younger
than 15 or older than 64) and in which there is at least one retiree. This selection aims at
avoiding classifying a household that for instance receives some pension income as a no-income
household.9 The households selected represent about 60% of Italian households and 70% of all
9
The inclusion of these misclassified households would lead to an overestimation the number of individuals and
families without income, undermining the possibility of using the distributional indices computed on labour
income as timely indicators for overall income inequality (Carta, 2019). Eurostat, in calculating the share of
people living in jobless households, which is an indicator of income poverty, applies a similar selection, considering
9individuals; almost all minors live in these households. As expected, given the adopted selection
rules, the reference person in the selected sample is younger than in the full sample; the average
size of households is larger mostly owing to the presence of children.
Third, since the ILFS data do not provide self-employed incomes (relevant for 23% of
Italian workers), Carta (2019) relies on a standard imputation methodology that exploits
contemporaneous information on employees’ wages. Considering that even in standard household
income surveys self-employed incomes are not measurable in a reliable way and are therefore
often excluded from the analysis on income inequality (Brandolini, 2000), the inclusion of
self-employed workers in the analysis is an advantage of our approach.
Carta (2019) imputes employees’ hourly wage10 to self-employed workers by means of a
simple linear regression model as in Mincer (1974). In particular, the logarithm of hourly wage
for the employees is regressed on a set of standard variables relating to the individual (i.e.
sex, age, level of education, civil status and citizenship), to their working status (working time
schedule, sector) and to their family background (number of children, province of residence).
The coefficients of the Mincerian regression estimated on the ILFS for the employees are used to
impute hourly wages for self-employed workers. Since the resulting distribution is less dispersed
than that of the original wages of the employees, an error term is added in order to restore
this variability.11 Then, in order to take into account that, also controlling for observable
characteristics, the average self-employed hourly income might statistically differ from that
of the employees, Carta (2019) also estimates a Mincer equation model – similar to the one
employed in the ILFS – for all workers using the SHIW data, which also include information
on self-employed incomes. She then corrects the predicted hourly income of the self-employed
in the ILFS with the estimated coefficient in the SHIW associated with being self-employed.
Finally, given the predicted hourly labour income, the monthly income of the self-employed is
obtained as the product of the predicted hourly income and the amount of hours worked in one
month, as reported in the ILFS.12 Some robustness checks that compare the imputed labour
income measure with the observed one in the SHIW confirm the goodness of the imputation
(see her paper for more details).
Finally, individual incomes are aggregated at the household level and, by applying the
modified OECD equivalence scale,13 a measure of the equivalized labour income is obtained, so
as to allow comparisons across individuals taking into account the size and the age composition
of the household to which they belong.
The final dataset built following this methodology augments the standard ILFS data with
labour income measures, both at the individual and at the family level, for those households
where the reference person is of working age and there are not retirees (as in Carta, 2019). We
draw on them to perform our simulation analysis.
those households in which at least one 18-59 year-old lives who is not a full-time student.
10
This is obtained as the ratio between monthly wage and weekly working hours times the average number of
working weeks in one month, 4.3.
11
Her results are similar if the correction is based on the variance of self-employed income as measured in the
SHIW.
12
Unemployed and inactive individuals are attributed a zero labour income.
13
The modified OECD equivalence scale attributes a coefficient of 1 to the first adult in the family, 0.5 to
additional family members who are at least 14 years old and 0.3 to those younger than 14.
103 The impact of the COVID-19 shock on Italian households:
preliminary evidence
We now provide some first descriptive evidence on the possible impact of the COVID-19 shock
on the distribution of labour income across individuals and households.
The lock-down measures implemented in March suspended or reduced activity in sectors
that absorbed, in the last quarter of 2019, 44% of self-employed workers and 33% of employees
(about 34% of total employment). For both types of work, the suspension of activities affected
more low-wage/income individuals. In our data, the share of workers in locked-down sectors is
almost ten points higher in the bottom 20% of the individual labour income distribution than in
the top 20%, for both employed and self-employed workers. Furthermore, workers who belong
to the bottom 20% of the labour income distribution have fewer chances to do remote working14
than workers in richer quintiles. 15
We observe similar patterns when we look at households rather than at individuals. In
38% of the households considered in our sample, there is at least one worker affected by the
lock-down measures. Also in this case, households at the bottom of the equivalized labour
income distribution are hit the most (Figure 1): the share of family members working in
locked-down sectors over the number of employed individuals in the family is around 37%
in the lowest 20% of the distribution, 29% in the highest 20%. Since in the bottom 20% the
average number of employed individuals in each family is equal to one, many households could
end up having no labour income.
Furthermore, even at the family level, the share of members employed in occupations with
a greater possibility of working from home is larger for higher income households (Figure 2): in
the top 20% of the distribution of equivalized income, the share of jobs that could be performed
from home is about 30 percentage points higher than that observed for the bottom 20%.
4 The impact of the COVID-19 shock and social insurance
benefits on labour income
4.1 Estimating the labour income loss at individual and family level
In our simulations, we start from the ILFS micro data referring to the fourth quarter of 2019
and we simulate the labour market dynamics of the first two quarters of 2020. We carry out
our simulation exercises under three different scenarios: i) a scenario in which there are no
social insurance benefits and no dismissal ban (baseline scenario); ii ) a scenario with the social
insurance benefits in force before the outbreak of the pandemic (pre-COVID benefits scenario);
and iii ) a scenario that also takes into account the social insurance benefits and the dismissal
ban introduced to face the COVID-19 emergency (post-COVID benefits scenario).16
14
Information on the possibility to work from home is obtained from Basso et al. (2020).
15
This evidence is also observed in Bonacini et al. (2020).
16
In the simulations, we focus on the properly anticyclical social safety nets, aimed at smoothing income drops
due to the loss of employment; we do not therefore consider minimum guaranteed income schemes like the
Citizenship income recently introduced in Italy. Moreover, in the ILFS, some information needed to evaluate
the eligibility of a household for the Citizenship income, like the amount of assets and the other income sources,
11To simulate our baseline scenario, we start from our measure of monthly labour income
observed in the fourth quarter of 2019 and we introduce assumptions on: i) the reduction in
hours worked at the sectorial level, which is determined on the basis of the estimated sectorial
drop in value added observed in the first and second quarter of 2020,17 to which we apply an
elasticity of working hours to value added of about 100%, consistent with what observed in
the data;18 and ii) the hourly wage growth, which we assume to be in line with the increase
observed in negotiated wages in the first two quarters of 2020 (0.6% with respect to the same
period in 2019).
In the baseline scenario (i.e. in the absence of the dismissal ban and of any social insurance
measure), we assume that the average reduction in hours worked per sector occurs entirely
through employment losses and not through reductions in hours among the employed. With this
aim, we need to simulate which worker – within each sector – loses his (her) job. We first assume
that temporary contracts expiring in the months of the lock-down are not renewed. Second, we
identify those workers who, within each sector, are more at risk of losing employment owing to
the COVID-19 shock. In particular, we estimate the probability of becoming unemployed within
the year based on some characteristics observed in the fourth quarter of 2019 (for example,
gender, marital status, type of contract, sector of employment, age, level of education).19 We
then assume that those individuals belonging to the share of the population with a value for
this probability above a certain threshold would lose their job. We define this threshold such
that, at the sectorial level, the overall drop in hours worked generated by these employment
losses, corrected by a factor that takes into account the average number of full-time equivalent
employment units (FTE) in each sector, is equal to the average drop in hours worked estimated
at sectorial level.
Appendix B provides details on the assumptions underlying each scenario for different types
of workers, as well as on the main policies in place before and after the outbreak of the COVID-19
emergency. In summary, the Italian social insurance system before the COVID-19 pandemic was
characterized by the presence of an unemployment benefit scheme, covering the large majority of
workers who loose their jobs because fired by their employer or because their contract expires.20
is not available.
17
To obtain an estimate of the drop in value added with the greatest possible sectorial detail, we start from
the average reduction observed at the macro-sector level (agriculture, industry, construction, services) from
the National Accounts statistics and we additionally assume that, within each macro-sector, the reduction in
economic activity in each lower-level sector is proportional to the share of value added attributable, before the
COVID emergency, to the activities suspended by the lock-down measures (we use the sectorial detail available
in the National Accounts). For example, within the industrial sector, once the average reduction in value added
is set equal to the National Account statistics, we attribute a greater decrease in activity to those sectors with
the largest share of value added produced by activities suspended during the health emergency (like metallurgy,
where this share is estimated at around 80 per cent).
18
The actual aggregate National Accounts data available for the first two quarters of 2020 confirm this assumption:
the sectorial drop in value added is almost equal to the observed average drop in working hours in each sector.
19
To identify the characteristics of the individuals most likely to lose their job, we used a probit model to analyse,
the characteristics observed most frequently among those who lost their jobs in 2019 (they were not employed
in the fourth quarter of 2019 but, according to the retrospective question contained in the questionnaire, they
were employed in the previous year). The variables used in this model are: the type of contract (fixed-term,
permanent or self-employed worker), the sector of employment (12 categories), sex, age, marital status, number
of children, level of education (three categories), the geographical area of residence (North, Centre and South).
20
Eligibility for the unemployment benefit scheme requires 13 weeks of paid contributions in the last 4 years
before the job loss.
12Moreover, firms with at least five employees or companies in the industrial sector were allowed
to use short-time work schemes programs, to avoid large employment adjustments when facing
temporary economic difficulties. Finally, no income support program was basically envisaged to
cover labour income losses of self-employed individuals, as well as of workers with very unstable
individual careers who do not reach eligibility for the unemployment benefit scheme.
The Government’s action during the months of the pandemic followed two main directions:
on the one hand, it introduced a dismissal ban and simultaneously expanded the coverage of
the short-time work schemes to almost all sectors. On the other hand, to protect workers who
were not covered by any social insurance benefit (self-employed individuals in particular), the
Government introduced a lump sum bonus, of about 600 euro on average, in the months of
March, April and May.21
In the simulations that consider the role of social insurance benefits (pre-COVID benefits
scenario and post-COVID benefits scenario), we assume that all individuals who meet the
requirements for applying for a specific benefit would submit an application and receive the
subsidy (full take-up), with the exception of the bonus for the self-employed, for which we have
information on the observed average take-up. Our estimates are therefore to be considered as
a lower bound of income losses. The hypothesis of full take-up appears realistic for workers in
the short-time work scheme (since it is requested by firms and not by individual workers), for
whom we assume they always access the programme in proportion to the loss of hours estimated
for their sector of employment. The full take-up assumption may instead be less realistic in
the case of unemployment benefits, since recent estimates show that it was around 50% in 2016
(Giorgi, 2019). However, it is likely that the take-up of this measure was higher during the
COVID-19 crisis, due to the deteriorated employment prospects and the reduced possibility of
finding employment in the short term. As for the bonus provided to self-employed workers,
we use the available information about the take-up, of about 70% on average, as estimated by
(Bovini et al., 2020).22
4.2 Results: the effects along the income distribution
According to our estimates, in the period March-May 2020, workers and households with at
least one employed individual at the end of 2019 experience, on average, significant earnings
reductions (Table 1). In the absence of any Government intervention (baseline scenario), the
drop is, on average, of 17% relative to the 2019 labour income, and it is concentrated among
temporary workers and self-employed individuals. The social insurance benefits in place before
the surge of the pandemic only partially mitigate the earnings losses, of about 10%, on average,
of the pre-crisis labour income. These “pre-COVID benefits” only smooth the earnings losses
of employees only, through the short-time works schemes (available mainly in the industrial
sector) and the unemployment benefit programme. The measures introduced by the Italian
21
The income support provided by the Government in March and April consisted in a 600 euro benefit, given
to all self-employed individuals independently of their previous income and of the income losses they actually
experienced during those months; in May, the benefit was instead only provided to self-employed individuals
who actually experienced at least a 33% revenue loss relative to 2019. See Appendix B for more details.
22
Labour income losses are lower once we relax this assumption and we assume a full take-up for the self-employed
bonus as well.
13Government to face the crisis further offset, on average, the fall in labour income: the expected
drop in earnings between March and May is 6% according to this scenario. The main difference
between the “post-COVID benefits scenario” and the pre-crisis one is given by the una tantum
benefit introduced for self-employed individuals in the months March-May, which reduces the
drop in income for this type of workers from 24 to 5%, on average. The extension of short-time
work schemes was also important and affected a large fraction of workers; however, its effect
in mitigating earnings losses is less visible when we compare the scenario with COVID-19
instruments with that with the pre-existing safety nets. In the latter scenario, employees not
covered by short-time work schemes have access to unemployment benefits, which provide fairly
similar income support. Temporary workers are those who end up being less protected by the
existing social insurance benefits and the newly introduced ones. Indeed, the COVID-specific
interventions did not operate explicitly to address their income losses.23
When we evaluate the effects of the crisis and the ability of the social insurance benefits to
smooth the earnings losses, we find that they are heterogeneous along the income distribution.
Although in absolute terms, the drop in family labour income increases along the equivalized
labour income distribution, the percentage loss with respect to the pre-crisis income level is
instead larger at the bottom of the distribution (Figure 3, panels 3a and 3b respectively).
However, “pre-COVID benefits” and especially “post-COVID benefits” are able to significantly
reduce the losses, mainly at the bottom of the equivalized labour income distribution. This is
due to the structure of social safety nets. First, as for the benefits in place before and after
the pandemic, the presence of some upper limits in the amount of the short-time work scheme
allowances and the progressivity in the computation of the amount of unemployment benefits end
up rewarding relatively more workers with a lower income. Second, the allowance introduced for
self-employed workers in the “post-COVID benefits scenario”, was paid to all workers in March
and April irrespective of their income losses and from their pre-COVID income. This represents
a significant gain which benefits relatively more lower income workers: in the bottom 20% of
the individual earnings, 600 euro are about 80% of the average labour income of self-employed
individuals. Even before the crisis, the share of self-employed workers who declared an income
of less than 600 euro exceeded 10% (Bank of Italy, 2018).
4.3 The effects on inequality
According to our simulations, in the absence of social insurance benefits (the baseline scenario),
inequality, as measured by the Gini index on equivalized labour income, rises from 34.8 in 2019 to
36.5% in the first quarter of 2020, and to 41.1% in the second quarter of 2020. These are highly
significant increases, although they should be interpreted with caution given the assumptions
23
For instance, the Government did not intervene with the aim of extending the duration of temporary contracts.
The main measures introduced by the recent decrees that were effective for temporary workers (even if targeted
to all employees, not specifically to them), were: (i) the 100 euro per month bonus given to those who could
not work from home, which represented a 10% increase in temporary workers’ monthly income and (ii) the
extension of the short-time work schemes – but only for the residual duration of the contract – that benefited
temporary workers relatively more because the way the short-time work scheme benefit is computed tends to
favour low wage workers more than the unemployment benefit scheme. The combination of these two measures
helped to reduce the income losses of temporary workers in the post-COVID benefits scenario, which, however
remained at 11% of the pre-crisis income due to the very high probability of temporary workers to losing their
jobs during the pandemic (because their contract expired) and becoming unemployed.
14introduced in Subsection 4.1. The overall increase in the Gini index in the first semester of
2020 (of 4.0 p.p.) is even larger than the one observed over the entire period of the double dip
recession (3.1 p.p. between 2009 and 2014).24 On applying the decomposition of the Gini index
proposed by Atkinson and Brandolini (2006), the increase in inequality is attributable by about
75% to the growth in the share of people belonging to households without labour income25
(about 4.1 points higher in the first semester of 2020, from 9.9% in 2019); the remaining 25% is
attributable to the increase in inequality between individuals living in households with positive
earnings. These dynamics are similar to those observed during the entire period of the Great
Recession and the sovereign debt crisis, but would occur in a much shorter time span.
Comparing the Gini index on individual and on equivalized labour income for a given
subgroup of the population allows us to assess the role of the family in smoothing earnings
differences among individuals and to get insights on the characteristics of those households
who suffered the most during the crisis. We focus on the working age population living in
the subsample of households considered in our analysis. Despite, on average, if one takes into
account the family dimension inequality on labour income is about 30% lower, the Gini index
on equivalized labour income increases relatively more than that on individual earnings between
2019 and the first half of 2020 (respectively by 12 and 9%). This is due to the fact that the
share of individuals without labour income increased much less than that of individuals living
in household with no earnings in the first two quarters of 2020 relative to 2019 (the share of
individuals with no labour income increased by 14.8%, while that of families with no labour
income increased by 41.3% in the same period). This suggests that during the COVID-19 crisis
income losses affected less heavily single person than multi-person households, who ended up
with no income at all.
Finally, we find that social insurance benefits are effective in significantly cushioning the
increase in inequality in the short term. Those designed to face the COVID-19 emergency
have more equalizing power than the social benefits in place before the pandemic: they restore
equivalized labour income inequality to pre-crisis levels, both in the first and in the second
quarters of 2020. Similar evidence is observed as for the share of individuals living in households
with no labour income.
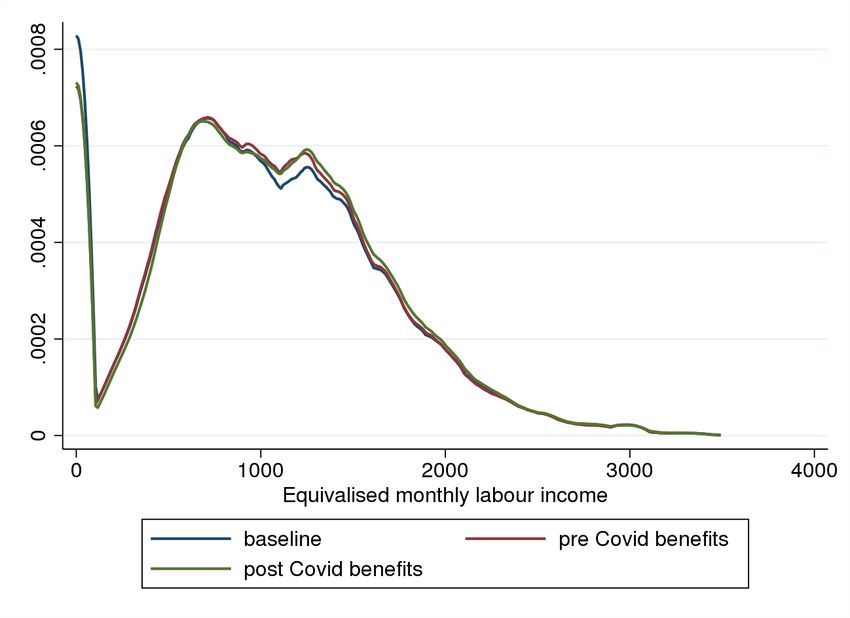
Figure 4 compares the distribution of equivalized labour income across our simulated scenarios,
with and without the social safety nets. We can see that the scenario with post-COVID benefits,
especially in the second quarter of 2020, is the one that better rebalances the distribution around
the mean values of equivalized labour income, implying also a lower level of inequality.
4.4 Robustness checks
In this section, we perform a set of robustness checks to evaluate the reliability of our simulation
exercise.
First, we use the available cross-sectional data of the ILFS for the first two quarters of 2020
to evaluate whether the labour income dynamics observed in the actual data are similar to
24
Other inequality indices, such as the income quintile share ratio (S80/S20 ratio), also suggest an increase in
inequality – even relatively larger – over the same period under the baseline scenario.
25
This is a similar indicator to the share of individuals living in jobless households, computed by Eurostat as a
proxy for poverty.
15those obtained through our simulations.26 Estimates of labour income are again obtained as
in Carta (2019) and provide a measure of observed labour income net of any kind of income
benefit. Thus, the actual data are comparable with the baseline scenario of our simulations,
with the difference that the actual data also reflect the dismissal ban introduced in March 2020,
while our baseline scenario simulates earnings by assuming the absence both of income benefits
and of the dismissal ban. However, this difference is important for employment and less so for
labour income dynamics; when excluding social benefits, both dismissed individuals and those
in a 100% short-time work scheme programme obtain zero income. We find that our simulation
of the baseline scenario captures the observed distribution of equivalized monthly labour income
quite precisely (net of any income benefit; see Figure A.1 in the Appendix). The increase in the
Gini index on equivalized labour income in the actual data is the same as that observed in our
simulations of the baseline scenario in both quarters; the rise in the share of individuals living
in households without labour income is also almost the same (4.3 rather than 4.1 percentage
points over the first half of 2020).
Second, we verify the reliability of our assumptions on the drop in hours worked needed to
simulate the loss in earnings. When we compare the aggregate reduction in hours worked in
the first two quarters of 2020 from the National Accounts data (with the maximum possible
sectorial detail available) with the results of our simulations, we find that our simulated results
are quite in line with the actual data. The average difference across macro-sectors between
our simulations and the actual data is about 2 percentage points (over an average reduction of
about 15 percentage points).27
Finally, we exploit a real time survey conducted by the Bank of Italy at the beginning of
April with the aim of timely evaluating the economic conditions of Italian households during the
pandemic (the Special Survey of Italian Households).28 The survey collects households’ opinions
on current and expected economic conditions relating to the COVID crisis. In Figure A.2 in
Appendix A, we display the share of individuals reporting that their income (including any
income support benefit) decreased, remained constant or increased as a result of the COVID-19
emergency. The figure shows that the crisis strongly hit families with lower earnings. Notice
that by the beginning of April, when the survey was run, the payment of most income benefits
to workers had not occurred yet. Therefore, the losses reported in the survey are similar to
those found in our baseline scenario (net of income support benefits to workers).
5 Conclusion
This paper estimates the effect of the COVID-19 pandemic on the distribution of Italian
households’ labour income in the first two quarters of 2020. Moreover, it assesses the short run
26
We do not employ the data for the first two quarters of 2020 in Section 4 since we need to simulate the
Government’s intervention – tailoring the amount of the benefits – on the basis of the pre-COVID labour
income. Alternatively, we can use the panel component of the survey. We do not opt for this since the sample
size is much smaller and, as reported by Istat, the impossibility to run the survey through in-person interviews
reduced – presumably in a non-random way – of about 10% the total number of interviews collected in 2020
with respect to 2019.
27
We cannot use the official data directly in our simulations because we need more disaggregated sectorial detail
for our analysis.
28
See https://www.bancaditalia.it/statistiche/tematiche/indagini-famiglie-imprese/indag-straord-famiglie-italiane
16effectiveness of the social insurance benefits put in place by the Government to support labour
income losses. In particular, the methodology relies on the Italian Labour Force Survey (ILFS)
data, the main database for the official labour market statistics, augmented with information
on individual and family labour incomes obtained following the methodology developed by
Carta (2019). We introduce some assumptions on the transmission of the COVID-19 shock to
employment, working hours and labour earnings.
We find that, in the absence of social insurance benefits, the crisis would have significantly
increased equivalized labour income inequality. This finding is grounded on three main observations.
First, workers belonging to lower income households were more likely to be employed in sectors
involved in the lock-down measures and, secondly, employed in occupations characterized, on
average, by fewer possibilities of working from home. Third, younger individuals with temporary
contracts, who earn lower wages on average, were hit hardest by the crisis as they experienced
the largest employment losses. We estimate that, in the absence of social insurance benefits,
the Gini index would rise by 4.0 percentage points in the first semester 2020, from 34.8% in
2019. This increase in inequality is substantial: it is larger than the one observed over the entire
period of the double dip recession (when the Gini index increased by 3.1 p.p. between 2009 and
2014).
Moreover, we find that in the short term, the pre-existing social insurance benefits were
able to compensate for income losses and for the increased inequality, but those specifically
introduced to face the COVID-19 emergency were significantly more. This result suggests that
in the short term, the effort made by the Italian Government to sustain Italian households was
effective on average. Relative to the pre-COVID safety nets, the main difference is due to the
lump sum bonus given to all self-employed individuals during the months of the emergency. The
long-run effects on inequality will depend on how long the Government will be able to support
the economy with social insurance policies and on the market’s ability to reabsorb the workforce
currently not used in the sectors mostly hit by the crisis. Moreover, our work points out that
the Italian social insurance system is highly fragmented and does not ensure the labour incomes
for all workers against economic shocks; in particular, it does not protect temporary employees,
usually the main margin of adjustment for firms, and self-employed individuals. Although there
is an economic rationale behind the different degrees of protection across workers, the severity
of the current crisis has shown the need to leave no one behind. It calls for a rethinking of the
existing social insurance system. For instance, it could be optimal to introduce policies that
incentivize self-employed individuals to ensure against adverse shocks or that directly provide
insurance, envisaging some form of experience ratings to avoid moral hazard behaviours.
17References
Adams-Prassl, A., T. Boneva, M. Golin, and C. Rauh (2020). Inequality in the impact of the
coronavirus shock: Evidence from real time surveys. Journal of Public Economics.
Aspachs, O., R. Durante, A. Graziano, J. Mestres, J. G. Montalvo, and M. Reynal-Querol
(2020). Real-Time inequality and the welfare state in motion: Evidence from COVID-19 in
Spain.
Atkinson, A. B. and A. Brandolini (2006). From earnings dispersion to income inequality. In
F. Farina and E. Savaglio (Eds.), Inequality and Economic Integration, pp. 35–62. London:
Routledge Siena studies in political economy.
Banbura, M., D. Giannone, M. Modugno, and L. Reichlin (2013). Now-casting and the real-time
data flow. In G. Elliott and A. Timmermann (Eds.), Handbook of Economic Forecasting,
Volume 2 of Handbook of Economic Forecasting, pp. 195 – 237. Elsevier.
Bank of Italy (2018). Survey on household income and wealth. Dataset.
Basso, G., T. Boeri, A. Caiumi, and M. Paccagnella (2020). The new hazardous jobs and worker
reallocation. Technical report, Institute of Labor Economics (IZA) No. 13532.
Blundell, R., M. Costa Dias, R. Joyce, and X. Xu (2020). Covid-19 and inequalities. Fiscal
Studies 41 (2), 291–319.
Boissay, F., P. Rungcharoenkitkul, et al. (2020). Macroeconomic effects of Covid-19: an early
review. Technical report, Bank for International Settlements.
Bonacini, L., G. Gallo, and S. Scicchitano (2020). Working from home and income inequality:
risks of a ‘new normal’ with COVID-19. Journal of Population Economics, 1–58.
Boone, C., A. Dube, L. Goodman, and E. Kaplan (2020). Unemployment insurance generosity
and aggregate employment. American Economic Journal: Economic Policy.
Bovini, G., D. Checchi, F. Di Nicola, E. Di Porto, P. Naticchioni, and E. Viviano (2020). Prime
evidenze sui pagamenti connessi al DL Cura Italia n.18/2020. Technical report, INPS note.
Brandolini, A. (2000). The problematic measurement of income from self-employment: a
comment. Technical report, In Seminar on household income statistics organized by Eurostat,
Luxembourg, 13-14 Dec 1999.
Brandolini, A., A. Rosolia, and R. Torrini (2012). Chapter 9 The EU-Wide Earnings
Distribution. Research on Economic Inequality, 205–235.
Brodeur, A., D. M. Gray, A. Islam, and S. Bhuiyan (2020). A Literature Review of the
Economics of COVID-19. IZA Discussion Paper 13411.
Brown, C. S. and M. Ravallion (2020). Inequality and the Coronavirus: Socioeconomic covariates
of behavioral responses and viral outcomes across US counties. Working Paper 27549, National
Bureau of Economic Research.
Cahuc, P., F. Kramarz, and S. Nevoux (2018). When Short-Time Work Works. CEPR
Discussion Papers 13041.
Carta, F. (2019). Timely Indicators for Inequality and Poverty Using the Italian Labour Force
Survey. Social Indicators Research, 1–25.
18Chetty, R., J. N. Friedman, N. Hendren, M. Stepner, et al. (2020). How did COVID-19 and
stabilization policies affect spending and employment? A new real-time economic tracker
based on private sector data. Technical report, National Bureau of Economic Research.
D’Amuri, F. (2011). The impact of the Great Recession on the Italian labor market. Research
in Labor Economics 32, 155–180.
Elsby, M., B. Hobijn, and A. Sahin (2010). The Labor Market in the Great Recession. Brookings
Papers on Economic Activity 2, 1–48.
Eurostat (2020). People at risk of poverty or social exclusion. Dataset.
Figari, F. and C. V. Fiorio (2020). Welfare resilience in the immediate aftermath of the Covid-19
outbreak in Italy. EUROMOD at the Institute for Social and Economic Research.
Gallo, G. and M. Raitano (2020). SOS Incomes: Simulated effects of COVID-19 and emergency
benefits on individual and household income distribution in Italy. Technical report, ECINEQ
Working Paper No. 566.
Gasior, K. and O. Rastrigina (2016). Nowcasting: timely indicators for monitoring risk of
poverty in 2014-2016. Working paper 1, EUROMOD.
Giorgi, F. (2019). La recente evoluzione dell’indennità di disoccupazione in Italia. Economia &
lavoro 53 (2), 83–100.
Giupponi, G. and C. Landais (2018). Subsidizing labor hoarding in recessions: The employment
and welfare effects of short time work. CEPR Discussion Paper DP13310.
Guiso, L. and D. Terlizzese (2020). Quanto pesa lo shock COVID-19 sulle famiglie. Mimeo.
Hagedorn, M., F. Karahan, I. Manovskii, and K. Mitman (2019). Unemployment Benefits and
Unemployment in the Great Recession: The Role of Macro Effects. Working Paper 19499,
National Bureau of Economic Research.
Han, J., B. D. Meyer, and J. X. Sullivan (2020). Income and Poverty in the COVID-19 Pandemic.
Working Paper 27729, National Bureau of Economic Research.
Hoynes, H., D. L. Miller, and J. Schaller (2012). Who suffers during recessions? The Journal
of Economic Perspectives 26 (3), 27–47.
IRPET (2020). Distanti e Diseguali. Il lockdown e le diseguaglianze in Italia. Technical report,
Note sugli effetti economici del Covid-19, Nota n. 6, Istituto Regionale Programmazione
Economica della Toscana.
MEF (2020). L’impatto del Covid-19 e degli interventi del Governo sulla situazione
socio-economica delle famiglie italiane nei primi tre mesi della pandemia. Technical report,
Note di lavoro - Analisi economica e Statistica, Nota n.3 October 2020.
Mincer, J. A. (1974). Schooling, experience, and earnings. NBER Books.
Navicke, J., O. Rastrigina, and H. Sutherland (2014). Nowcasting indicators of poverty risk
in the European Union: a microsimulation approach. Social Indicators Research 119 (1),
101–119.
Raitano, M. (2016). Income inequality in Europe since the crisis. Intereconomics 51 (2), 67–72.
Rothstein, J. (2011). Unemployment Insurance and Job Search in the Great Recession.
Brookings Papers on Economic Activity 2, 143–210.
19You can also read


