R 557 - The carbon footprint of Italian loans by Ivan Faiella and Luciano Lavecchia - Questioni di Economia e ...
←
→
Page content transcription
If your browser does not render page correctly, please read the page content below
Questioni di Economia e Finanza
 (Occasional Papers)

 The carbon footprint of Italian loans

 by Ivan Faiella and Luciano Lavecchia
April 2020

 557
 Number
Questioni di Economia e Finanza
(Occasional Papers)

The carbon footprint of Italian loans

by Ivan Faiella and Luciano Lavecchia

Number 557 – April 2020
The series Occasional Papers presents studies and documents on issues pertaining to
the institutional tasks of the Bank of Italy and the Eurosystem. The Occasional Papers appear
alongside the Working Papers series which are specifically aimed at providing original contributions
to economic research.

 The Occasional Papers include studies conducted within the Bank of Italy, sometimes
in cooperation with the Eurosystem or other institutions. The views expressed in the studies are those of
the authors and do not involve the responsibility of the institutions to which they belong.

 The series is available online at www.bancaditalia.it .

ISSN 1972-6627 (print)
ISSN 1972-6643 (online)

Printed by the Printing and Publishing Division of the Bank of Italy
THE CARBON FOOTPRINT OF ITALIAN LOANS

 by Ivan Faiella* and Luciano Lavecchia**

 Abstract
 There is a growing emphasis on the possibility that climate-related financial risks – such
as an abrupt transition to a low-carbon economy – might increase the financial vulnerability
of borrowers with consequences for lenders and, eventually, on the financial system as a
whole. This article presents a first insight on the carbon content of business loans in Italy,
proposing different approaches to measure the carbon content of Italian bank loans comparing
three methods of identifying the most exposed sectors. According to our estimates, the
exposure of the Italian financial system in 2018 ranged between 8 and 10.2 per cent of banks’
total assets. This information is the starting point from which to evaluate, within a climate-
scenario framework, how different climate policies could influence the stability of the
banking sector.

JEL Classification: Q54, G21, G28.
Keywords: climate change, financial stability, climate stress test, transition risk.
DOI: 10.32057/0.QEF.2020.557

 Contents
1. Introduction ........................................................................................................................... 5
2. Greenhouse gas (GHG) emissions in Italy ............................................................................ 6
3. The carbon content of Italian loans ....................................................................................... 9
 3.1 Data sources for the Italian credit system..................................................................... 10
 3.2 Climate-policy-relevant sectors (CPRS) ...................................................................... 10
 3.3 Loan carbon intensity (LCI) ......................................................................................... 11
4. A proposal for identifying carbon-critical sectors (CCrS) .................................................. 15
5. Conclusions and further research ........................................................................................ 18
References ................................................................................................................................ 21
Appendix .................................................................................................................................. 23

_______________________________________
* Bank of Italy, Directorate General for Economics, Statistics and Research and OIPE-Levi Cases.
**Bank of Italy, Rome Branch and OIPE-Levi Cases.
1. Introduction*
 Climate-related financial risks are now part of the agenda of central bankers around the world
(Campiglio et al 2018; Bolton et al, 2020). Climate modifications, in terms of gradual changes in
temperature and precipitation patterns as well as climate-related natural extremes (World Bank, 2019,
EEA 2019), and climate policies, affect the financial system through several channels (Carney, 2015;
Batten et 2018). More frequent and intense extreme natural events damage fixed capital (buildings,
machinery, and infrastructure) hindering the ability of creditors located in the affected areas to repay
their debt (physical risk). Energy and climate policies to achieve a transition to a carbon-free
economy may influence the value of the assets of the companies in the fossil-fuel business, especially
if these measures are implemented in a disorderly way (transition risk 1). Finally, a risk arises when
people harmed by climate change ask for compensation from those who are held to be responsible,
who in turn, could transfer this risk to the insurance system, if contracts have been signed to hedge
these responsibilities (liability risk).

 The quantification of these climate-related financial risks is still limited due to a severe
deficiency in data availability and to the need for a forward-looking approach in evaluating risks
(Bolton et al., 2020). Dietz et al. (2016) use a Value-At-Risk model to estimate the probability of
losses on global financial assets due to climate change and find a tail risk loss involving up to 16.9
per cent of total assets or USD 24.2 trillion. In the case of Italy, there is a scant literature on the
economic effects of climate-related financial risk, even though over one-third of Italian cities are
located in areas at high risk of landslides and flooding (MATTM, 2008) 2 and that even a modest rise
in sea level will induce severe territorial losses due to coastal erosion (Marsico et al. 2017). 3 A
partial exception is the work of Faiella and Natoli (2018) who remark that a fifth of all outstanding
loans in Italy are granted to firms located in areas that are heavily impacted by flooding: they find
that lending activity is negatively correlated with flooding risk, in particular for loans granted to small
and medium enterprises. Bernardini et al. (2019) focus on a sample of European electric utility
companies in order to assess how transition risk can affect asset prices and finds a premium for the
share prices of low-carbon utilities (known as a ‘greenium’). Cahen-Fourot et al. (2019a) estimate
* We would like to thank Marco Marinucci, Federica Zeni and participants at the Annual Seminar on Regional Economics (Bank of Italy, Rome,
20 December 2019). The views expressed are those of the authors and do not necessarily reflect those of the institutions to which they belong.
1
 The core concept of transition risk is the possibility that many carbon reserves may become unburnable under a strict
climate policy (McGlade and Ekins, 2015, TFCD, 2019, ClimateWise, 2019). Cui et al. (2019) estimate that in order to
limit temperature rise to 1.5°C, there should be no new coal power plants (and those currently under construction should
be abandoned) while the existing ones should be closed in the next 20 years.
2
 According to the latest estimates by the Italian Government, in the coming years, Italy will have to spend up to €26
billion to face multiple hydrogeological risks (ItaliaSicura, 2017) and global warming is estimated to raise significantly
the probability of large floods in the long run (Alfieri et al, 2015).
3
 Moreover, while extreme sea level events are projected to increase their frequency at least annually in many locations
by 2100, in the case of Italy this will happen by 2040, well in advance (SROCC, 2019).

 5
that, 2.1 per cent of Italy’s capital stock is at risk of being stranded, especially in the electricity and
industrial sectors. 4

 In practice, it is still not clear how these risks might affect financial stability, the resilience of
individual intermediaries, and, eventually, if they could disrupt the transmission channels of monetary
policy and interfere with the price stability target. To better understand how climate-related financial
risks might influence the Italian financial system, this article presents some evidence on the carbon
content of firms’ loans and proposes a simple method to spot the most exposed industries (the so
called ‘carbon-critical’ sectors). We have devised a simple and transparent method to define an
industry-level indicator for the exposure of firms’ credit to transition risk. While the sectoral approach
has the limit of not considering the actual exposure of the single lender, it overcomes many hurdles
and, in particular, the scarcity of information that often hampers a firm-level approach. In fact, at
present, the information on direct or indirect emissions of small and medium firms is in fact missing.
For a few larger firms, it is possible to use their ESG (Environmental, Social and Governance) scores,
provided by private firms using methods that are not always consistent (as a result, the ESG scores
of individual firms show a large heterogeneity across rating agencies). 5 In fact, there are neither
broadly accepted rules for ESG data disclosure by individual firms, nor auditing standards to verify
the reported data.
 Our approach also has the merit of making use of wider industry coverage than other similar
studies: considering all the sources of greenhouse gases (GHGs), and not only CO2 emissions (the
majority of which is linked to fossil fuels combustion), we are able to include sectors that are usually
disregarded (e.g. agriculture). Finally, our method is dynamic and takes into account the development
and intensity of emissions as well as the evolution of lending.
 The paper is structured as follows: Section 2 accounts for GHG emissions and GHG emission
intensity trends in the EU-28 and Italy. Section 3 presents different approaches to measure the carbon
content of Italian bank loans, in particular a Loan Carbon Intensity (LCI) indicator computed at the
sector level. To overcome some of the drawbacks of the LCI we propose, in Section 4, a different
method for identifying carbon-critical sectors. Section 5 concludes.

 2. Greenhouse gas (GHG) emissions in Italy
 Transition risks arise from the commitments made by the international community to stabilize
the atmospheric concentration of greenhouse gases. Climate policies will induce a shift to low-carbon

4
 This share will possibly increase in the future: for example the 2017 Italian National Energy Strategy established the
closure of all its 9 coal-powered power plants (8 GWe) by 2025, with an estimated cost of more than €16 billion.
5
 See, for example, Aiello and Manzelli (2020).

 6
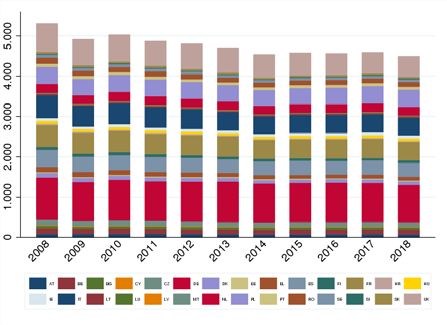
energy sources, introducing either limitation of the use of fossil fuels or a system to change energy
relative prices according to their carbon content (e.g. setting a carbon price or providing incentives
for low carbon energy sources).
 When these policies are implemented, the carbon-intensive businesses find themselves more
exposed to climate-related financial risks. A crucial way to start an analysis of the carbon content of
loans is to gather information on industry-specific GHG emissions.
 The official statistics on emissions follow the UN’s Framework Convention on Climate
Change, reporting guidelines on annual GHG inventories. 6 At the European level, Eurostat provides
a very wide array of data, namely the National Accounts Matrix including Environmental Accounts
(NAMEA), integrating National Accounts data with the information on GHG emissions by economic
activity (NACE Rev. 2 classification 7) with data from 2008. For Italy, there are emissions’ data for
63 divisions (out of 88), with several grouped at the section level.
 According to these data, in 2017 EU-28 emissions from firms’ and households’ activities
totalled more than 4,500 million tons (Mt) of carbon dioxide equivalent (CO2e), 8 less than one-eighth
of global emissions (Carbon Budget Project, 2019). Emissions from businesses account for about 80
per cent of the total (largely stable across time and countries; Fig. 1.a)

 Figure 1
 GHG emissions in EU-28
 (Mt of CO2e)
 a) EU-28 b) by country

 Source: Based on Eurostat data (table env_ac_ainah_r2).

6
 Time series on countries’ GHG emissions, with details on sector and gases, are available at the UNFCCC website.
7
 NACE Rev. 2 (ATECO 2007 in Italy) classification has a hierarchical structure consisting of first level sections
(alphabetical code), second level divisions (two-digit numerical code), third level groups (three-digit numerical code) and
fourth level classes (four-digit numerical code) – Eurostat, NACE Rev.2, Statistical classification of economic activities
in the European Community.
8
 CO2e expresses the impact of different greenhouse gases in terms of the amount of CO2 that would create the same
amount of warming. Each gas is converted using its global warming potential (GWP), which describes its total warming
impact relative to CO2 over a set period, usually a hundred years. GHG emissions include CO2, CH4, HFC, NF3, SF6, N2O
and PFC.

 7
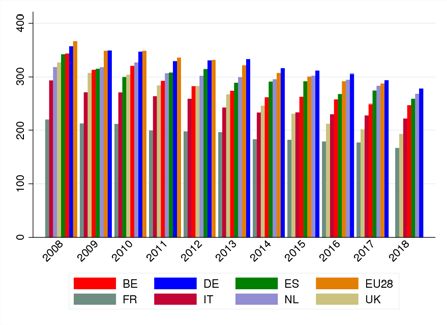
The interesting feature of the NAMEA is the possibility of linking this information to other
data on the sector coming from the National Accounts (such as value-added, employees, etc.).
Merging the information on emissions with the corresponding division-level allows us to compute
different estimates of GHG emission intensities. These intensities can be computed as the amount of
emissions needed to produce a unit of gross valued added (in constant terms), expressed in grams of
CO2e per euro (gCO2e/€), or the emissions associated with the use of a unit of labour input (grams
of CO2e per person employed or hours worked).
 Carbon intensity is a useful complement to emission data in assessing how each sector is
exposed to transition risk; stricter climate regulation (e.g. limits on the amount of CO2 emitted per
km on cars) or a higher carbon price would reduce the profitability of the firms operating in carbon-
intensive sectors (see for example Fig. 6 in Bernardini et al., 2019).
 During the decade 2008-18, in EU-28 the average carbon intensity of value added amounted
to 324 gCO2e/€, lower in France, Italy, UK and Spain (respectively, 193, 249, 260 and 295 gCO2e/€)
and almost the same in Germany (323 gCO2e/€; Fig. 2.a). Over time, it decreased by one fifth. In
Italy, carbon intensity, always lower than the EU-28 average, showed a similar reduction (Fig. 2.b).
 Figure 2
 Average carbon intensity of the value added in Europe
 (gCO2e/€, chain linked prices, base year 2010)
 a) by country b) EU-28 vs. Italy

 Source: Based on Eurostat data (Tables env_ac_ainah_r2 and nama_10_a64).

 In 2018, in Italy the five (ten) most emitting sectors contributed to 60 (82) per cent of overall
emissions (Table 1). Between 2008 and 2018, overall GHG emissions fell by a cumulative 26.1 per
cent, a drop of 115.2 Mt of CO2e. All but one of the 10 highest-emitting sectors reduced their
emissions, and cumulatively they represent almost 85 per cent of the overall decrease.

 8
Table 1
 Emission trends of the 10 highest emitting sectors in Italy in 2018
 (per cent, Mt of CO2e, gCO2e/€)
 Cum. GHG intensity of the value
 ∆ GHG Share of
 growth added (2016 at the sector
 Sector 2008-18 GHG
 2008-18 level)
 % Mt % gCO2e/€
 Electricity, gas, steam and air conditioning supply (D) -32.2 -44.1 28.4 4,941
 Crop and animal production, hunting and related service activities -5.0 -2.0 11.8 1,471
 (A01)
 Manufacture of other non-metallic mineral products (C23) -49.7 -23.5 7.3 2,664
 Sewerage, waste collection, treatment and disposal activities; -11.3 -3.0 7.2 3,515
 materials recovery and Remediation activities and other waste
 management services (E37-E39)
 Water transport (H50) -13.8 -2.9 5.5 4,675
 Manufacture of coke and refined petroleum products (C19) -35.3 -9.4 5.3 11,904
 Land transport and transport via pipelines (H49) -23.8 -4.7 4.6 417
 Manufacture of chemicals and chemical products (C20) 4.9 0.7 4.3 1,316
 Manufacture of basic metals (C24) -43.2 -9.9 4.0 1,245
 Wholesale trade, except of motor vehicles and motorcycles (G46) 8.3 0.9 3.6 134
 Total economy -26.1 -115.2 100 221
Source: Based on Eurostat data.

 The most exposed sector is Electricity, gas, steam and air conditioning supply (D, 28.4 per
cent of the overall emissions in 2018) followed by Crop and animal production, hunting and related
service activities (A01, 11.8 per cent) and Manufacture of other non-metallic mineral products (C23,
7.3 per cent). In terms of the carbon intensity of the value added, the national average was 221
gCO2e/€ (Fig. 2.b, Tab.1) and three sectors exhibit very large values 9: Manufacture of coke and
refined petroleum products (C19, almost 11,900 gCO2e/€), Electricity, gas, steam and air
conditioning supply (D, ~ 5,000 gCO2e/€) and Water transport (H50, almost 4,700 gCO2e/€).

 3. The carbon content of Italian loans
 To understand the exposure of the financial system, through its loans’ portfolio or, indirectly,
via securities holding (such as equity or bonds), a classification system is necessary to discriminate
between the banks’ assets. In 2016, the Netherlands Central Bank (DNB, 2016) surveyed a sample of
banks, pension funds and insurers, representing, on average, three quarters of their respective markets,
finding that 9 per cent of their assets (bonds, equities and loans) was invested in five carbon-intensive
sectors (agriculture, transport, basic industry, power generation and fossil fuels). Battiston et al.
(2017) mapped economic activities in five climate-policy-relevant sectors (more on this approach in
the following sections).
 In the following sub-sections, after a brief description of loan data sources in Italy, we explore
different methods to rank the loans of Italian firms according to their carbon content (a proxy of their
exposure to transition risk).

9
 Carbon intensities of valued added at sectoral level are only available up to 2016.

 9
3.1 Data sources for the Italian credit system

 We rely on the granular data from the Central Credit Register (Centrale dei Rischi), collected
by the Bank of Italy since 1962. The Central Credit Register gathers information on all loans,
guarantees and derivatives issued by banks and financial companies to all customers living in Italy. 10
We extract the outstanding volume of loans to domestic firms (including households acting as
entrepreneurs and excluding monetary financial institutions - MFIs) between 2010 and 2018.
 This information is merged with data on GHG emissions provided by Eurostat, obtaining a
joint database on loans and emissions, which is used to estimate the indicators of section 3.3 and 4.
In particular, to replicate the analysis of Battiston et al. (2017), we extract data on loans at NACE
level-4 (classes – see section 3.3) while, to develop alternative measures of the Loan carbon intensity
(section 4), we extract data at, at least, NACE level-2 (divisions).

3.2 Climate-policy-relevant sectors (CPRS)
 Battiston et al. (2017) build on a previous classification by the European Commission (2014)
of the sectors and sub-sectors deemed to be exposed to a significant risk of carbon leakage. These
sectors are assessed “on a number of quantitative and qualitative criteria”. Battiston et al (2017)
refine this assessment, defining a correspondence between sectors at the NACE level-4 and the 5
Climate-policy-relevant sectors (CPRS):
 1. energy-intensive (mining of metal ores and most of manufacturing activities);
 2. fossil fuel (mining and extraction of coal and petroleum, manufacturing of coke,
 refined petroleum products and chemicals, and specialized construction activities);
 3. housing (construction of buildings, including manufacturing of non-metallic mineral
 products and furniture);
 4. utilities (electric power generation, transmission and distribution, including
 construction of utility projects);
 5. transport (land, water and air transport, and some supporting activities).

 The authors address the direct and indirect exposures, focusing on the equity holdings of the
shareholders (banks, pension funds and individuals) of all EU and US listed companies, grouped by
climate-policy-relevant sector. As for the loans, given the lack of granular data, they resort to an
alternative (and coarser) classification at NACE 1 level (sections), estimating the exposure within the
financial sector to assess the indirect effects. ECB (2019) adopts this classification to estimate how
banks, insurers, and pension and investment funds, are exposed to transition risk, via their portfolio

10
 If the sum of all loans is over €30,000, then all loans, including those below this threshold, are reported.

 10
investments, in terms of equity and bonds. We replicate this analysis, using granular data on loans
from the Bank of Italy’s Central Credit Register, disregarding both interbank lending (not captured
by the Register) and equity and bonds held by banks.
 Loans granted by banks and other financial intermediaries potentially exposed to transition
risk according to this classification have been steadily decreasing since 2010, representing in 2018
just under half of total loans (Fig. 3.a). This trend is the result of a slight increase in the exposure of
non-bank financial intermediaries and a decrease in the share of loans granted by banks to CPRSs
(Fig. 3.b).
 Figure 3
 Exposure of the Italian financial system to transition risk
 (Climate-policy-relevant sectors - CPRS)
 (billions of euros, current prices)
 a) Banks and other fin. intermediaries b) Banks only

 Sources: Based on Eurostat and Bank of Italy Central Credit Register data.

3.3 Loan carbon intensity (LCI)
 An alternative classification builds on the NAMEA information to define the climate-exposed
sector and uses data on emissions at the industry level. The simplest approach is to link the
information on GHG emissions with that on the distribution of loans. We collapse the granular data
of the Central Credit Register at NACE level-2 on all the loans, both performing and non-performing,
provided to non-financial companies and producer households for each type of financial institution
between 2010 and 2018. 11 The information on loans, Ls,t (in current euros), is available for sector s
and year t, and merged with GHG emissions Es,t (in gCO2e), using s and t as keys.
 We define, for each year t, the Loan carbon intensity (LCI) as the amount of emissions per
each euro borrowed by sector s. This indicator answers a very simple question: how many grams of

11
 Our dataset is made up of around 1,200 observations (9 years, 63 NACE sectors, 2 types of financial institution – banks
vs. other financial institutions).

 11
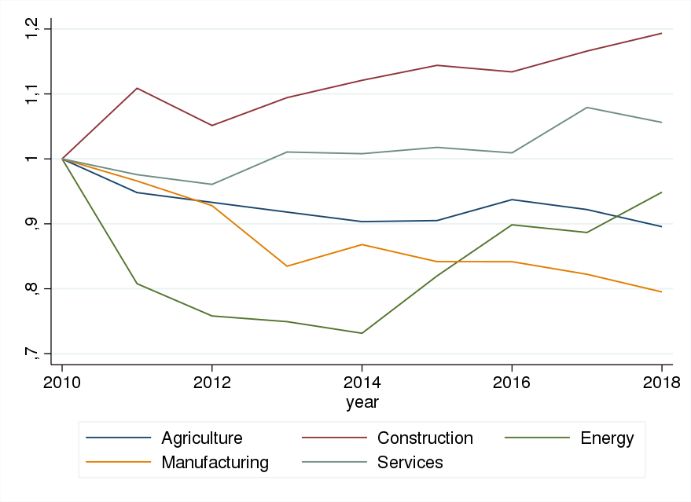
GHGs are emitted by sector s in year t for every borrowed euro? The answer is expressed in grams
of CO2e per euro (gCO2e/€):
 ,
 LCI , = (1)
 ,

 Between 2010 and 2018, the LCI averaged out to 330 gCO2e/€ (Table 2), with above-average
values for Agriculture, Manufacturing, and, not surprisingly, Energy (Fig 4.a).
 Table 2
 Loan carbon intensity (LCI) per year
 (gCO2e, billions of euro, gCO2e/€)

 Emissions (1012 gCO2e) Loans (109 €) LCI (gCO2e/€)
 (a) (b) (a/b)
 2010 392.0 1,116.2 351.2
 2011 384.6 1,139.3 337.6
 2012 367.3 1,104.0 332.8
 2013 339.5 1,050.5 323.2
 2014 326.4 1,024.9 318.5
 2015 329.6 1,015.0 324.7
 2016 329.0 1,006.4 327.0
 2017 331.9 999.1 332.2
 2018 326.3 997.6 327.1
 Sources: Based on Eurostat and Bank of Italy Central Credit Register data.

 Over the period considered, the LCI of Construction increased significantly (+19 per cent)
while there was a reduction in Manufacturing, Agriculture and Energy (-21, -11 and -5 per cent
respectively) (Fig 4.b).
 Figure 4
 LCI per main economic sector
 (gCO2e/€, base year 2010)

 a) LCI in selected years b) Trend 2010-18

 Sources: Based on Eurostat and Bank of Italy’s Central Credit Register data.

 12
Focusing on the 10 highest emitting sectors (Table 3), we find that, between 2010 and 2018,
the LCI was substantially stable in most sectors. It increased by more than 50 per cent in Water
transport (H50), because of a sizable rise in emissions, and by 30 per cent in Manufacture of coke
and refined petroleum products (C19), due to a sharp reduction in loans. It decreased by more than
30 per cent in Manufacture of basic metals (C24), and by 17 per cent in Manufacture of other non-
metallic mineral products (C23).
 Table 3
 LCI of the 10 highest emitting sectors
 (gCO2e/€)
 Sector 2010 2014 2018
 Electricity, gas, steam and air conditioning supply (D) 3.773 2.510 3.444
 Crop and animal production, hunting and related service activities (A01) 960 867 860
 Manufacture of other non-metallic mineral products (C23) 2.307 2.082 1.914
 Sewerage, waste collection, treatment and disposal activities; materials recovery and 3.120 2.920 3.069
 Remediation activities and other waste management services (E37-E39)
 Water transport (H50) 1.851 1.562 2.831
 Manufacture of coke and refined petroleum products (C19) 2.080 3.023 2.788
 Land transport and transport via pipelines (H49) 910 973 792
 Manufacture of chemicals and chemical products (C20) 1.340 1.351 1.411
 Manufacture of basic metals (C24) 1.110 882 747
 Wholesale trade, except of motor vehicles and motorcycles (G46) 118 135 126

 Total economy 351 318 327
Source: Based on Eurostat and Bank of Italy Central Credit Register data.

 This approach can be useful in order to compare the carbon exposure across European
countries, even if these comparisons should be considered with caution because bank funding is only
one of the possible sources of funding, although an important one according to the EU’s Financial
Accounts (European Commission, 2017). 12
 Using ECB Consolidated Banking data (CBD) it is possible to compute and compare LCI
across countries and sectors, merging the NACE level-1 information on loans with NAMEA. For
example in 2014, the LCI of German manufacturing was almost twice that of Spain and 4 times that
of Italy. In 2018, these differences decreased due to a steep reduction of the LCI in Germany (Fig.
5.a). The evidence for the agricultural sectors is similar (Fig. 5.b). 13

12
 This is especially true for large corporations, which can easily resort to other sources of funding such as equity or bonds.
13
 For a more comprehensive comparison, see Aiello and Manzelli (2020).

 13
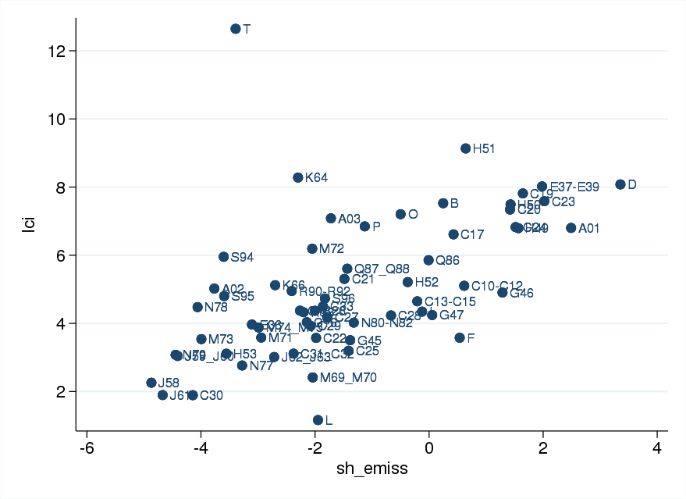
Figure 5
 LCI of manufacturing and agriculture in selected European countries
 (gCO2e/€)
 a) Manufacturing b) Agriculture

 Sources: Based on Eurostat and ECB data

 The LCI can be used to define a threshold to spot more exposed sectors: for example between
2010 and 2018, the industries with an above-the-median LCI accounted for 34 per cent of all loans
and 93 per cent of all emissions.
 The LCI is very straightforward to compute, but it suffers from two problems. One is the
difference in the underlying firms’ populations when one considers the estimates of emissions and
loans. As we mentioned previously, for European comparisons, not all the firms in a sector borrow
money from the financial system; therefore simply dividing the total emissions by the amount of
credit provides a biased LCI estimator, with a bias that grows with the firms’ propensity to finance
their activities using alternative funding sources. The use of Central Credit Register data partially
solves this problem, as it includes loans from all financial intermediaries (not only banks). Moreover,
a comparison of the number of employees working in the total private sector, complemented by a
further check on the figures for Non-construction industry and Construction, shows no significant
difference between data in the Central Credit Register and the official number published by Istat. 14
 The second issue is that the LCI mixes up two phenomena: the index can classify as carbon
intensive a sector with average emissions and a low volume of loans (for example sector T) while
ranking as insignificant an industry with high emissions and a very significant volume of loans (for
example sector F – Fig. 6).

14
 At present, the quality of the information in the Central Credit Register at a more detailed sectoral level is more difficult
to assess and beyond our scope.

 14
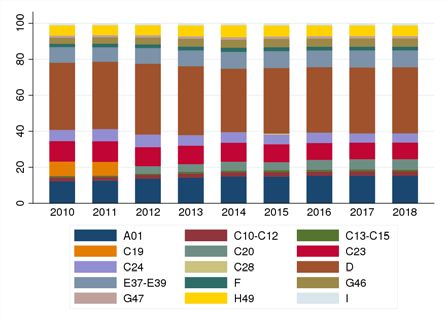
To overcome this limit, we propose a method that takes into account at the same time the
contribution of a sector in terms of its GHG emissions and loans, a sector that we deem as “Carbon-
Critical” (CCrS).
 Figure 6
 Loan carbon intensity, emissions and loans in 2016
 (logs of LCI and logs of share of emissions and loans)

 a) LCI vs. share of emissions b) LCI vs. share of loans

Sources: Based on Eurostat and Bank of Italy Central Credit Register data. The legend of the sectors is in the Appendix.

 4. A proposal for identifying carbon-critical sectors (CCrS)
 In order to spot carbon-critical sectors (CCrS), we create two separate rank variables that
provide information on sectors’ share of total emissions - � , � - and total loans - � , �.
We took the simple average of these ranks, obtaining a measure of the relevance of each sector in
terms of emissions and exposure to the financial sector ( _ , ). There is a significant degree
of concentration, with only a fifth of the sectors considered capturing half of the loans and 80 per cent
of emissions (Fig. 7.a and 7.b). Therefore, we define as carbon-critical sectors (CCrS) those whose
simple average of the aforementioned ranks is in the first fifth of the distribution of _ , . 15
 The rationale of this approach is to focus, each year, only on those sectors that are more critical
in terms of emissions and loan exposure. Using the notation adopted before:

 CCrS = average � � , �, � , �� < 1 , (2)

where 1 is the first quintile of the distribution of avg_rank.

15
 Between 2010 and 2018 these are: A01, C10-C12, C13-C15, C23, C24, D, E37-E39, F, G46, G47, H49 and I. C19
between 2010 and 2011; C20 between 2012 and 2018; C28 only in 2015. For the legend of the sectors see the Appendix.

 15
Figure 7
 Loans and emissions: carbon-critical vs. other sectors
 (percentage points)
 a) Loans b) Emissions

Sources: Based on Eurostat and Bank of Italy Central Credit Register data.

 Among the carbon-critical sectors (CCrS, Construction (F), Manufacture of machinery and
equipment (C28) and Wholesale and retail trade (G46+G47) account for one third of the loans (Fig.
8.a) but less than 6 per cent of GHG emissions (Fig. 8.b). On the opposite side, the three most emitting
sectors, account for half of the emissions but only a tenth of loans. 16
 Figure 8
 Loans and emissions: carbon-critical sectors in detail
 (percentage points)
 a) Loans b) Emissions

Sources: Based on Eurostat and Bank of Italy Central Credit Register data. The legend of the sectors is in the Appendix.

16
 They are Electricity, gas, steam and air conditioning supply – D; Agriculture - Crop and animal production, hunting
and related service activities – A01; Manufacture of other non-metallic mineral products – C23.

 16
Overall, the exposure of the financial system towards CCrSs amounts to 53 per cent of total
loans (Fig. 7.a); while the exposure of the banking system has been (slightly) decreasing, that of the
other financial intermediaries has been continuously increasing (Fig. 9.a and 9.b)
 Figure 9

 Exposure of the financial system to the transition risk – by type of intermediary
 (percentage points)

 a) Banks b) Other financial intermediaries

Sources: Based on Eurostat and Bank of Italy Central Credit Register data.

 In order to check the robustness of our indicator, we rank the sectors using GHG emissions
per unit of gross value added instead of GHG emissions (CCrSbis , see eq. 3).

 CCrS = average � � , / , �, � , �� (3)

 Using one or the other indicator leaves the ranking substantially unchanged (Fig. 10), thus
giving the user the freedom to choose one or the other according to data availability.
 Figure 10
 Two different indicators of carbon-critical sectors (year:2016)

Sources: Based on Eurostat and Bank of Italy Central Credit Register data. See the Appendix for the legend of the sectors.

 17
5. Conclusions and further research

 There is a growing appetite for understanding the exposure of the financial sector to climate-
transition risk. This is a key starting point in order to evaluate, within a climate-scenario framework,
how different climate policies (e.g. different hypotheses of carbon taxation) might impact the
financial sector. Some supervisors have started to publish some analyses (DNB, 2016; ECB, 2019)
but the different approaches remain rather fragmented.
 To the best of our knowledge, this is the first exercise that assesses total loan exposure, from
banks and other non-bank financial intermediaries, whereas previous works focused on equity and
bonds (mostly referring to the classification proposed in Battiston et al, 2017, i.e. Climate-policy-
relevant sectors (CPRS) or just a sample of loans (DNB, 2016).
 Our focus on loans should provide a fair proxy of the exposure of the entire Italian financial
system. The exposure of banks’ via their portfolios (equity and bonds issued by climate-exposed
sectors) is not particularly significant in Italy and so it is not included. In the end, we disregard around
a tenth of total assets, given the predominance of loans and sovereign bonds in banks’ balance sheets
(68 and 11 per cent of their assets, respectively, at the end of 2018). 17 In particular, loans to firms
totalled slightly less than one third of all banks’ total assets at the end of 2018. We also ignore
interbank lending, that again represents a small share of banks’ balance sheets (less than 3 per cent
of total assets).
 We analyse different approaches to measure the carbon content of Italian bank loans,
comparing three methods to identify the most exposed sectors: the Climate-policy-relevant sectors
(CPRS), those with an LCI greater than the median, and carbon-critical sector (CCrS) indicator
computed at the sector level.
 The CPRS approach is a good starting point because it is widely adopted in the financial
community but it does not consider some sectors (e.g agriculture) that contribute significantly to total
emissions. The Loan carbon intensity (LCI) is very straightforward to compute and it provides
industry-level data on the emissions embedded in each euro borrowed. To overcome some of the
drawbacks of the LCI method, we propose a simple and transparent alternative to define a set of
carbon-critical sectors (CCrS).

 According to our estimates, the exposure of the Italian financial system in 2018 ranged
between 37 (LCI) and 53 (CCrS) per cent of total loans, representing 9.9, 12.9 and 14.4 per cent of
banks’ total assets (for LCI, CPRS and CCrS respectively; Table 4).

17
 According to ECB evaluations, banks’ portfolio exposure to CPRS (equity and bonds only) for the euro area as a whole
is around 1 per cent of total holdings (ECB, 2019).

 18
Table 4
 Exposure of the Italian financial system at the end of 2018
 (billions of euros and percentage points)
 Outstanding loans Share of total loans Loans as a
 share of total
 Method Total Banks only Total Banks only assets
 CPRS 473.9 323.9 47.5 45.6 12.9
 LCI > median 364.2 273.4 36.5 38.5 9.9
 CCrS 528.0 372.8 52.9 52.4 14.4

 Sources: Based on Eurostat, and Bank of Italy Central Credit Register data and Financial accounts.

 What does our evidence mean for the resilience of the Italian financial system to climate risk?
We think there is light and shadow.
 In Italy the implicit level of carbon pricing is already high (Faiella and Cingano, 2015): one
can imagine that the level of carbon taxation needed to achieve the new ambitious European targets 18
would take its toll on the real economy. Indeed, increasing energy prices further could in turn reduce
firms’ competitiveness (Faiella and Mistretta, 2015; Faiella and Mistretta, 2020) and increase the
share of energy-poor households (Faiella and Lavecchia, 2015).
 However, there are also reasons to be more optimistic about the resilience of the Italian
economy in adapting to these new challenges. Italy has already significantly reduced its emissions, 19
reaching all its 2020 climate and energy targets (PNEC, 2019). The carbon footprint of Italy’s energy
system is quite small compared with other EU countries, also thanks to the fact it has one of the
smallest energy intensities in the OECD countries (IEA, 2016) and it will get smaller. 20 Finally, as
the LCI shows, in Italy the carbon content of loans is rather small compared to the LCI of other EU-
peers.
 Finally some methodological considerations. We are aware of the limits of sectoral data, and
in particular that they do not allow us to take into consideration the large differences in production
processes and technologies, and that they are an imperfect substitute for firms’ actual emissions
(ECB, 2019). Nevertheless, we think that industry-level information can be a valuable starting point
given the lack of good quality and comparable firm-level data; the high costs of acquiring such data

18
 The new targets of the European Green Deal imply a significant reduction of the emissions: between 2020 and 2030
Italy should double its efforts, reducing its yearly emissions by 16 MtCO2e, compared to 7 MtCO2e for the previous
target.
19
 In 2017 Italy total emissions were 105 Mt lower than the reference year (1990), a reduction by 20.44 per cent
(UNFCCC, - link)
20
 Italy has planned to shut-down its coal-powered power stations by 2025; the Italian cars are among the most efficient
in Europe with a significant penetration of natural gas in the transport sector (including the plan to use biogas and to
extend gas use in tracks and shipping); there is a big potential for improving energy efficiency and renewable deployment
in the building sector.

 19
(Monnin, 2018); and the limitations of using ESG scores as proxy information for climate risk (IMF,
2019).
 LCI and CCrS have the merit of being built using a standard method of classification (the
NACE codes) available at EU level; moreover, they take into account all sources of greenhouse gases
(GHGs) in addition to CO2 from fossil fuel combustion; finally, they are dynamic considering directly
the evolution of emissions and emission intensity. There is only a partial overlap between the sectors
considered - CCrS and those with an above-the-median LCI. We have a preference for the CCrS
approach because it contains information on the importance of both loans and emissions.
 Further refinements of these indicators could include an evaluation of the sectors most
exposed to carbon content along the value chain (e.g. using input-output matrices as described in
Cahen-Fourot et al., 2019b) and a correction that considers that not all the emissions produced by a
sector correspond exactly to the sectors’ loans (e.g. because the financing of the underlying activity
uses different sources of funding). Moreover, to consider the total exposure of the banking system as
a whole, the exposure via equity and bonds held by each bank in the critical sectors should be
included.

 20
References

Aiello M. and G. Manzelli (2020) “Cambiamento climatico e rischio di transizione – prime evidenze per il
sistema bancario italiano”, Bank of Italy, mimeo.
Alfieri, L., Burek, P., Feyen, L. and Forzieri, G., 2015, “Global warming increases the frequency of river floods
in Europe”, Hydrology and Earth System Sciences 19(5), 2247–2260 (DOI: 10.5194/hess-19-2247-2015).
Batten S. (2018), “Climate change and the macro-economy: a critical review”, Bank of England, Working
paper n. 706, January 2018 (link).
Battiston, S, Mandel A., Monasterolo I., Schutze F., Visentin G., “A climate stress-test of the financial system”,
Nature Climate Change, volume 7, pages 283–288 (2017).
Bernardini E., Di Giampaolo J., Faiella I. and Poli R. (2019), “The Impact of Carbon Risk on Stock Returns:
Evidence from the European Electric Utilities”, Journal of Sustainable Finance & Investment, DOI:
10.1080/20430795.2019.1569445.
Bolton P., Despres M., Pereira Da Silva L. A., Samama F., Svartzman R. (2020), “The Green swan - Central
banking and financial stability in the age of climate change”, Bank for International Settlement (link).
Cahen-Fourot L., Campiglio E., Dawkins E., Godin A. and Kemp-Benedict E. (2019a) “Capital stranding
cascades: The impact of decarbonisation on productive asset utilization”. Ecological Economic Papers, 18.
WU Vienna University of Economics and Business, Vienna (link).
Cahen-Fourot, L., Campiglio, E., Dawkins E, Godin A. and E. Kemp-Benedict (2019b), “Looking for the
inverted pyramid: An application using input-output networks”. Ecological Economic Papers, 25. WU Vienna
University of Economics and Business, Vienna. (link).
Campiglio, E., Dafermos, Y., Monnin, P. et al. Climate change challenges for central banks and financial
regulators. Nature Clim Change 8, 462–468 (2018) doi:10.1038/s41558-018-0175-0 (link)
Carney M. (2015), “Breaking the tragedy of the horizon – climate change and financial stability”, Speech by
Mr Mark Carney, Governor of the Bank of England and Chairman of the Financial Stability Board, at Lloyd’s
of London, London, 29 September 2015 (link).
Carbon Budget Project (2019), “Global carbon budget 2018”, the Global Carbon project (link).
Cui R.Y. et al (2019), “Quantifying operational lifetimes for coal power plants under the Paris goals”, Nature
Communications, 10, Article number: 4759 (2019) (link).
ClimateWise (2019), “Transition risk framework: Managing the impacts of the low carbon transition on
infrastructure investments”, February 2019, (link).
Dietz S., Bowen A., Dixon C., and Gradwell P. (2016), "Climate value at risk’ of global financial assets",
Nature Climate Change, ISSN 1758-678 X (link).
DNB (2016), “Time for transition”, De Nederlandsche Bank, Occasional Studies, Vol.14-2 (link).
ECB (2019), “Climate change and financial stability”, special feature of the Financial Stability Review May
2019 (link).
EEA (2019), “Climate change threatens future of farming in Europe”, European Environment Agency, Sept.
4th, 2019 (link).
European Commission (2014), “Commission decision of 27 October 2014 determining, pursuant to Directive
2003/87/EC of the European Parliament and of the Council, a list of sectors and subsectors which are deemed
to be exposed to a significant risk of carbon leakage, for the period 2015 to 2019”, 2014/746/EU (link).
European Commission (2017), “Commission staff working document: Economic analysis accompanying the
mid-term review of the capital markets union action plan”, SWD(2017) 224 final (link).
Faiella I. and Mistretta A. (2015), “Spesa energetica e competitività delle imprese italiane”, Economia
Pubblica, 3/2015, pp. 85-121 (link).

 21
Faiella I. and Mistretta A. (2020), “Energy costs and competitiveness in Europe”, Banca d’Italia, Working
Papers (Temi di discussione) No. 1259, February 2020 (link).
Faiella I. and Lavecchia L. (2015), ”La povertà energetica in Italia" Politica economica, Società editrice il
Mulino, issue 1, pages 27-76 (link).
Faiella I. and Cingano F. (2015), “La tassazione “verde” in Italia: l’analisi di una carbon tax sui trasporti”,
Economia Pubblica, No. 2 (link).
Faiella I. and Natoli F. (2018), “Natural catastrophes and bank lending: the case of flood risk in Italy”, Banca
d’Italia, Questioni di economia e finanza No. 457, October 2018 (link).
IEA (2016), “Energy Policies of IEA Countries: Italy 2016 Review”, International Energy Agency, Paris
(link).
IMF (2019), “Global Financial Stability Report”, October 2019, International Monetary Fund. (link)
ItaliaSicura (2017), “Italia Sicura il piano nazionale di opere e interventi e il piano finanziario per la riduzione
del rischio idrogeologico”, Presidenza del Consiglio dei Ministri, 2017 (link).
Marsico A. et al (2016), “Flooding scenario for four Italian coastal plains using three relative sea level rise
models”, Journal of Maps, Vol. 13, 2016- Issue 2 (link).
McGlade C. and Ekins P. (2015), “The geographical distribution of fossil fuels unused when limiting global
warming to 2 °C”, Nature volume 517, pages 187–190 (08 January 2015) (link).
MATTM (2008), Il rischio idrogeologico in Italia, Ministero dell’Ambiente, Roma (link).
Monnin P. (2018), “Integrating Climate Risks into Credit Risk Assessment: Current Methodologies and the
Case of Central Banks Corporate Bond Purchases”, CEP Discussion Notes, 21 December.
PNEC (2019), “Piano nazionale integrato per l’energia e il clima”, Governo italiano (link).
SROCC (2019), “Special Report on the Ocean and Cryosphere in a Changing Climate”, IPCC, September
2019 (link).
TCFD 2019, “Task Force on Climate-related Financial Disclosures: Status Report”, June 2019, (link).
World Bank (2019), “Harvesting prosperity through innovation and technology in agriculture”, World Bank
blogs, Sept. 16th, 2019 (link).

 22
Appendix

NACE code Description
A01 Crop and animal production, hunting and related service activities
A02 Forestry and logging
A03 Fishing and aquaculture
B Mining and quarrying
C10 Manufacture of food products
C11 Manufacture of beverages
C12 Manufacture of tobacco products
C13 Manufacture of textiles
C14 Manufacture of wearing apparel
C15 Manufacture of leather and related products
C16 Manufacture of wood and of products of wood and cork, except furniture; manufacture of articles of straw and plaiting materials
C17 Manufacture of paper and paper products
C18 Printing and reproduction of recorded media
C19 Manufacture of coke and refined petroleum products
C20 Manufacture of chemicals and chemical products
C21 Manufacture of basic pharmaceutical products and pharmaceutical preparations
C22 Manufacture of rubber and plastic products
C23 Manufacture of other non
C24 Manufacture of basic metals
C25 Manufacture of fabricated metal products, except machinery and equipment
C26 Manufacture of computer, electronic and optical products
C27 Manufacture of electrical equipment
C28 Manufacture of machinery and equipment n.e.c.
C29 Manufacture of motor vehicles, trailers and semi
C30 Manufacture of other transport equipment
C31 Manufacture of furniture
C32 Other manufacturing
C33 Repair and installation of machinery and equipment
D Electricity, gas, steam and air conditioning supply
E36 Water collection, treatment and supply
E37 Sewerage
E38 Waste collection, treatment and disposal activities; materials recovery
E39 Remediation activities and other waste management services
F Construction
G45 Wholesale and retail trade and repair of motor vehicles and motorcycles
G46 Wholesale trade, except of motor vehicles and motorcycles
G47 Retail trade, except of motor vehicles and motorcycles
H49 Land transport and transport via pipelines
H50 Water transport
H51 Air transport
H52 Warehousing and support activities for transportation
H53 Postal and courier activities

 23
I Accommodation and food service activities
J58 Publishing activities
J59 Motion picture, video and television programme production, sound recording and music publishing activities
J60 Programming and broadcasting activities
J61 Telecommunications
J62 Computer programming, consultancy and related activities
J63 Information service activities
K64 Financial service activities, except insurance and pension funding
K65 Insurance, reinsurance and pension funding, except compulsory social security
K66 Activities auxiliary to financial services and insurance activities
L Real estate activities
M69 Legal and accounting activities
M70 Activities of head offices; management consultancy activities
M71 Architectural and engineering activities; technical testing and analysis
M72 Scientific research and development
M73 Advertising and market research
M74 Other professional, scientific and technical activities
M75 Veterinary activities
N77 Rental and leasing activities
N78 Employment activities
N79 Travel agency, tour operator and other reservation service and related activities
N80 Security and investigation activities
N81 Services to buildings and landscape activities
N82 Office administrative, office support and other business support activities
O Public administration and defence; compulsory social security
P Education
Q86 Human health activities
Q87 Residential care activities
Q88 Social work activities without accommodation
R90 Creative, arts and entertainment activities
R91 Libraries, archives, museums and other cultural activities
R92 Gambling and betting activities
R93 Sports activities and amusement and recreation activities
S94 Activities of membership organisations
S95 Repair of computers and personal and household goods
S96 Other personal service activities
T Activities of households as employers; undifferentiated goods

 24
You can also read