Second Quarter 2021 EARNINGS RELEASE - log in - Mziq
←
→
Page content transcription
If your browser does not render page correctly, please read the page content below
EARNINGS RELEASE

         Second Quarter
                   2021
                2Q21 Results Conference Call
                   Tuesday, august 17th, 2021
                        11h00 (Brasilia Time)

                         To watch, click here

log in
Index

             2Q21 Highlights
             Message from the Administration

             01     Covid-19

             02     Asset Portfolio

             03     Operational Performance

             04     Consolidated Financial Performance

             05     Other Highlights of the Balance Sheet

             06     Reserves certification

             07     Safety, Health, Environment and Sustainability (SSMS)

             Annex 1 - Balance Sheet

             Annex 2 - Income Statement

             Annex 3 - Cash Flow Statement

02
Mata de São João, August 16, 2021 – PetroReconcavo S.A. (“PetroReconcavo” or “Company”)
        (B3: RECV3) today announces its results for the second quarter of 2021 (2Q21). The following
        information is presented in a consolidated manner in thousands of Reais (R$) in accordance
        with international standards of financial statements (IFRS) and in accordance with accounting
        practices adopted in Brazil, except where otherwise specified.

        2Q21 Highlights
           • Growth of 34.3% and 10.4%, respectively, in net revenues and EBITDA in the second
             quarter of 2021, when compared to the same period of 2020. Net income in the
             quarter of R$94.5 million;
           • Growth of 11.3% in total production in the second quarter of 2021, when compared
             to the same period of 2020 and 4.0% when compared to 1Q21;
           • On May 22, we reached a historic milestone of 1.000 days without lost time
             accidents in the Recôncavo District;
           • Net cash position of more than R$450 million, after the completion of the Initial
             Public Offering of primary distribution of common shares issued by the Company;
           • In May 2021, the ANP approved the assignment of the concession contracts of
             Remanso Cluster. For the closing of the transaction, the title of environmental
             licenses must still be transferred;
           • In June 2021, the subsidiary Potiguar E&P took over the operations of the
             Sabiá da Mata and Sabiá Bico-de-Osso fields, located in the Potiguar District,
             which were previously operated by Sonangol Hidrocarbonetos do Brasil. The
             subsidiary participates in these fields under consortium with a 70% stake in these
             concessions;
           • In June 2021, the concession contract for the POT-T-702 exploratory block in the
             Potiguar District was signed;
           • As a subsequent event, the subsidiary Potiguar E&P was declared the winner
             of the Process of Public Call for Supply of Natural Gas - 2022/2023 of Potigás –
             Companhia Potiguar de Gás, for having presented a more competitive proposal
             and better commercial conditions; and
           • Also, as a subsequent event, the Company began its 2021 Drilling Campaign in the
             Potiguar District, having drilled, until the date of this release, three wells, not yet
             completed.

Index

 03
2Q21 Highlights                                                                                                                                      Earnings Release | 2nd Quarter 2021

                         Key Indicators (in thousands of R$, except as otherwise noted)
                                                                                                           2Q21              2Q20                 ∆%                1S21                1S20        ∆%

                         Net revenue                                                                      249,110           185,488             34.3%           494,898                381,036      29.9%

                         Net Income (Loss) for the period                                                  94,566            (15,156)              n.m.             81,676             (151,197)     n.m.

                         Net margin         1
                                                                                                           37.96%             -8.17%               n.m.            16.50%             -39.68%        n.m.

                         EBITDA       2
                                                                                                           131,354           118,967             10.4%           262,986              224,296       17.2%

                         EBITDA Margin3                                                                    52.73%            64.14%             -17.8%             53.14%              58.86%       -9.7%

                         (Net Cash) Net Debt4                                                           (469,531)           869,164                n.m.         (469,531)              869,164       n.m.

                         Net Debt/ EBITDA last 12 months                       5
                                                                                                          -0.92 x              2.76 x              n.m.           -0.92 x                 2.76 x     n.m.

                         Average gross production (boe per day)                                             12,059            10,832              11.3%             11,829                11,244     5.2%

                         Average production cost per boe in R$6                                         R$ 67.22           R$ 51.63             30.2%           R$ 67.83             R$ 56.36       20.3%

                         Gross production (in boe)                                                      1,097,332            985,711              11.3%         2,141,060           2.046,333       4.6%

                         Average Brent Oil Spot Price                   7
                                                                                                           $68,83             $29,20            135,7%            $64,86                 $39,73     63,3%

                         Average exchange rate R$/US$ average                             8
                                                                                                          R$ 5.29           R$ 5.39               -1.7%           R$ 5.38              R$ 4.92       9.4%

                         Average production cost per boe at US$9                                            $12.70             $9.58            32.5%              $12.60                 $11.45    10.0%

                      Notes:
                      (1) Net margin corresponds to net income/(net loss) for the period divided by net income for the period.
                      (2) We calculate EBITDA in accordance with the Securities and Exchange Commission Instruction (“CVM”) No. 527 of October 4, 2012, as amended (“CVM Instruction
                      527”) and consists of adjusted net income (loss) (plus) for financial income, income tax and social contribution on income and depreciation, amortization and depletion
                      (“EBITDA”). EBITDA is not an accounting measure recognized by the Accounting Practices Adopted in Brazil (“BRGAAP”) or by the International Financial Reporting
                      Standards (IFRS) issued by the International Accounting Standards Board (“IASB”) are not audited or reviewed by the Company’s independent auditors, and does not
                      represent cash flow for the periods presented and should not be considered as substitutes for net profit (loss) as indicators of the Company’s operating performance
                      and, therefore, are not substitutes for cash flow, indicator of our liquidity or as a basis for the distribution of dividends. EBITDA has no standardized meaning, and our
                      definition of EBITDA may not be comparable to those used by other companies.
                      (3) EBITDA margin corresponds to EBITDA for the period divided by net revenue for the period. The EBITDA Margin is not a measure of financial performance accord-
                      ing to the Accounting Practices Adopted in Brazil or the International Financial Reporting Standards (IFRS) nor should it be considered in isolation, as a measure of
                      operating performance, or an alternative to operating cash flows as a measure of liquidity or as an indicator of financial returns.
                      (4) Represents total bank indebtedness, represented by loan and financing balances in current and non-current liabilities, minus cash balances and cash equivalents
                      and financial investments present in current and non-current assets.
                      (5) Represents the balance of the debt l atthe end of the period divided by the accumulated EBITDA of the last twelve months in each period. Net Debt/EBITDA is not
                      an accounting measure recognized by accounting practices adopted in Brazil (“BR GAAP”) or by the International Financial Reporting Standards (“IFRS”), issued by the
                      International Accounting Standards Board (“IASB”) is not audited or reviewed by the Company’s independent auditors. The netD ívida/EBITDA has no standardized
                      meaning, the utras companies may calculate differently from the Company.
                      (6) Represents the total costs of the services provided and sales, excluding royalties to depreciation, amortization and depletion, divided by total gross production in
                      boe in the period. In the second quarter of 2020, due to the Covid-19 pandemic, the Company reduced non-critical activities, resulting in cost reduction in that period.
                      More detailed explanations of cost variations can be found in topic “5. Consolidated Financial Performance”.
                      (7) Brent is quoted in dollar per barrel. Source: U.S. Energy Information Administration (EIA).
                      (8) The average exchange rate for the period corresponds to the average exchange rate on each business day in theperiods presented, disclosedby the Central Bank of Brazil.
                      (9) Represents the total costs of the services provided and sales, excluding royalties, depreciation, amortization and depletion, divided by the total gross production in
                      boe in the period, divided by the average exchange rate of the period.

Index

 04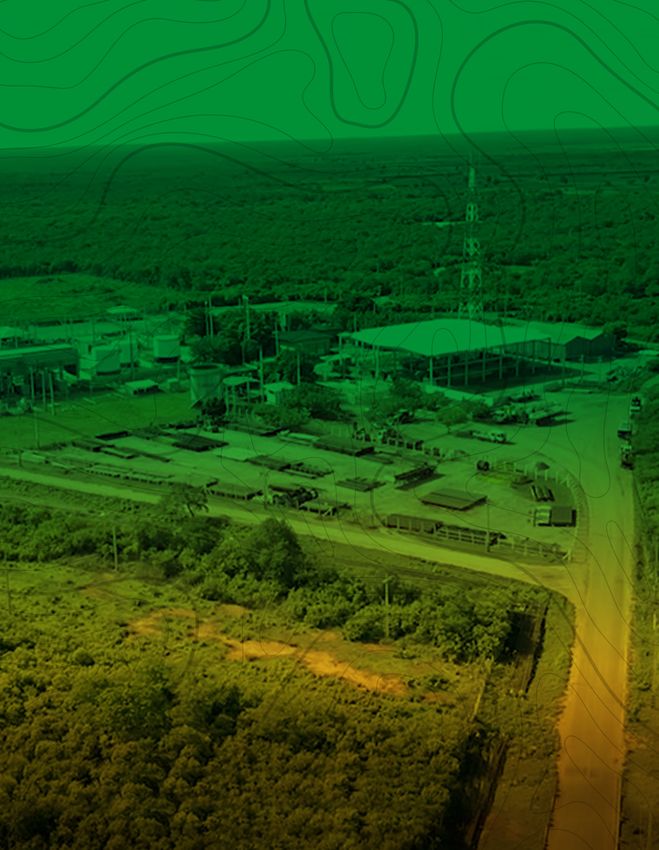
Message from
        the Administration

Index

 05
Message from the Administration                                                      Earnings Release | 2nd Quarter 2021

                     In this second quarter of 2021 we continue to pursue with effort our vision of leading
                     the transformation of the onshore industry in Brazil.

                     As of June 1st, 2021, we took over the operation of the Fields of Sabiá da Mata and
                     Sabiá Bico de Osso, both in the Potiguar Basin, in which we hold a 70% (seventy per-
                     cent) stake. Resulting from more recent discoveries than the other 30 fields already
                     operated by the Company in this basin and still with good potential for primary
                     development, these assets should receive a significant portion of our investment
                     in the coming months, including drilling of new wells, workover interventions and
                     facilities projects that will allow the proper processing and delivery of the expected
                     additional volumes of oil and gas.

                     After the IPO implementation and with the proximity of the closing of the Remanso
                     and Miranga Clusters, we have dedicated ourselves to creating the necessary capa-
                     bilities and structures for an acceleration in the pace of development of the operated
                     fields. In the coming months we will mobilize and put into operation two new
                     workover rigs and a light rig, in addition to contracting two other workover rigs with
                     service providers.

                     In July 2021, we started our drilling campaign in the Potiguar district, using our inter-
                     nalized equipment and teams. Also in July, we were declared winners in the process
                     of Public Call for Supply of Natural Gas - 2022/2023 of Potigás - Companhia Potiguar
                     de Gás, for having presented a more competitive proposal and better commercial
                     conditions. With this contract, once again demonstrating the Company’s pioneering
                     role, we have the prospect of significantly expanding the monetized value of the gas
                     molecule produced by the Company, validating our business model, and generating
                     expectations of higher returns for our projects to expand the production, treatment,
                     and commercialization of natural gas. This is a first step towards diversifying the
                     Company’s customer base.

                     We also continue to focus our attention on evaluating opportunities for acquisi-
                     tions of new assets in mature onshore basins and expanding our operations in the
                     natural gas chain. Externally, we see a more positive scenario with the expansion
                     of vaccination against Covid-19 and forecasts of significant economic growth in
                     the country and in the world that will boost demand for oil and gas in the coming
                     months and years.

                     Once again, we thank the trust of investors and the dedication of our employees.
                     Together we will continue to develop opportunities in the oil and gas industry,
Index                turning resources into value and dreams into reality.

 06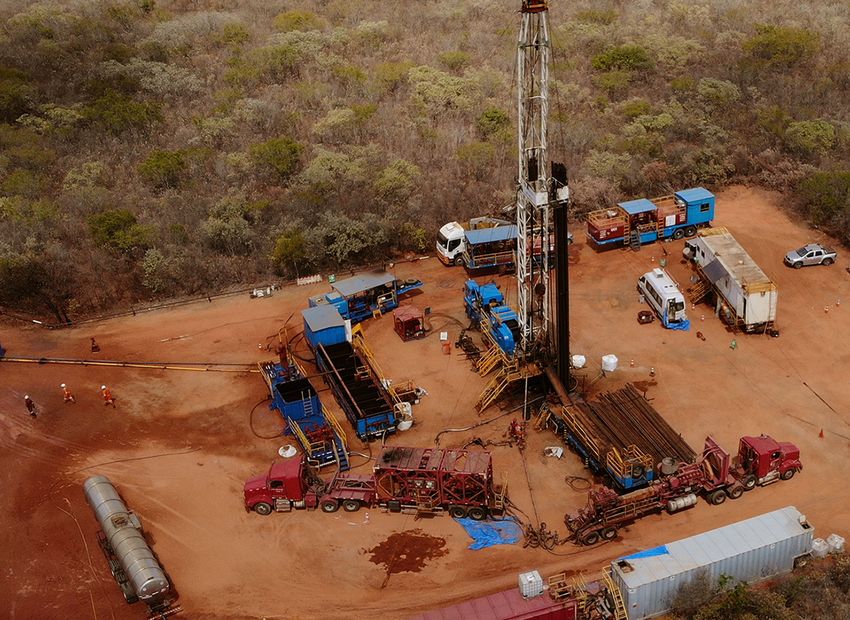
Earnings Release | 2nd Quarter 2021

01      Covid-19

        The Company continues to operate following the rules defined by the committee
        set up to manage the health crisis. The main objectives of the committee are to
        maintain the health of employees and contractors, to maintain the Company’s
        activities without impacts on operational safety or the environment, and, at the
        same time, to evaluate the consequences of the crisis in the business plan.

        The Company recommended that its employees and contractors not essential to
        the operation work remotely, in addition to increasing the spacing of people in the
        work environment and temporarily suspending non-essential trips, visits, face-
        to-face training and commuting. At this time, employees may voluntarily return to
        the offices adapted to the protection measures recommended by the committee,
        among them the performance of frequent tests. Employees of the risk groups
        continue to work remotely.

        The Company revised its projection for operating income and cash flows for 2021
        and did not verify the need to recognize a loss on recoverable value in fixed assets,
        deferred taxes and accounts receivable. Considering the unpredictability of the
        evolution of the outbreak and its impacts, the current estimate of the financial
        effect of the outbreak on projected operating revenues and cash flows may be
        revised according to new events related to this pandemic.

Index

 07
Earnings Release | 2nd Quarter 2021

02      Asset Portfolio

        Oil and gas production assets operated or where the Company holds economic
        interests.
        On June 30th, 2021, we operated or were concessionary of the following oil and gas
        producing assets:

        Potiguar District
        On December 9th, 2019, PetroReconcavo, through the subsidiary Potiguar E&P, car-
        ried out the acquisition of Petrobras’ stake in the Riacho da Forquilha fields, the first
        transaction completed involving land fields in mature basins of Petrobras’ diinvest-
        ment plan. The Cluster, located in the state of Rio Grande do Norte, is composed
        of 34 concessions, of which 30 are 100% owned by Potiguar E&P and operated by
        Potiguar E&P, two in partnership with Sonangol Hidrocarbonetos Brasil Ltda, which
        began to be operated by Potiguar E&P from June 2021, and two with Partex Brasil
        Ltda and operated by them.
        The map below represents the location of the Potiguar Basin, with an emphasis on
        the fields operated by PetroReconcavo its subsidiary Potiguar E&P.

        Of the 34 current concession agreements, 22 expire in 2025 and the other 12
        between 2032 and 2039, all with the possibility of extension for an additional 27
        years, as provided for in the concession contracts with the ANP. Potiguar E&P has
        already submitted to the ANP the extension request and the new development
Index   plans, including the proposal to reduce royalties on incremental production, to 12
        fields from the round zero and awaits the statement of the Regulatory Agency.

 08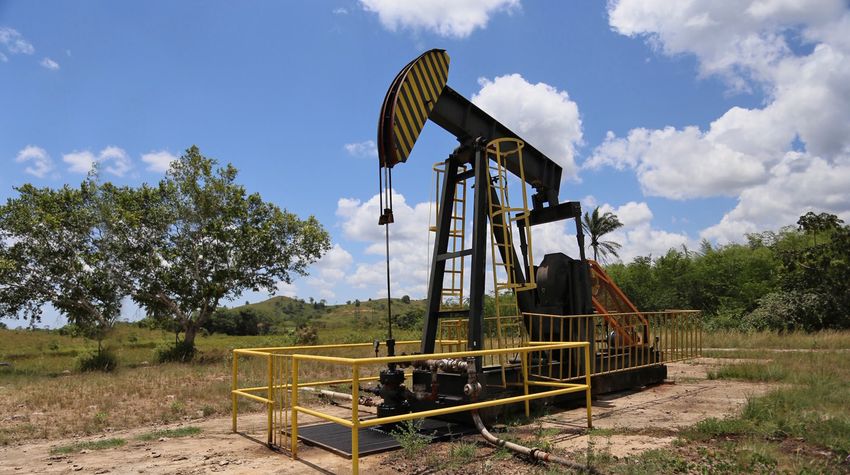
Asset Portfolio                                                                      Earnings Release | 2nd Quarter 2021

                      Potiguar E&P signed on June 28th, 2021, a concession contract for the exploration and
                      production of oil and natural gas, related to the POT-T-702 exploratory block, leased
                      in the 2nd Cycle of Permanent Offer held by the National Agency of Petroleum,
                      Natural Gas and Biofuels. The concession contract comprises an area of 17,178 km²,
                      and a Minimum Exploratory Program (“MEP”) composed of 1,000 Units of Work,
                      corresponding to a value of R$ 6,000,000.00 (six million reais), which has a period
                      of five years for its execution and will consist of a single period. The MEP value
                      was guaranteed by means of Warranty Insurance issued in favor of the ANP effec-
                      tive during the exploratory period and will be returned as soon as the exploratory
                      commitment is fulfilled. The acquired area is adjacent to blocks already operated by
                      Potiguar E&P, and its exploratory program will consist of drilling at least one well in
                      order to evaluate the existence of accumulations in reservoirs similar to those exist-
                      ing in the neighboring concessions of the Block.

Index

 09
Asset Portfolio                                                                       Earnings Release | 2nd Quarter 2021

                        Recôncavo District
                        On December 23rd, 2020, we signed a contract for the purchase of Petrobras’ entire stake
                        in the 12 onshore fields of Brejinho, Canabrava, Cassarongongo, Gomo, Fazenda Belém,
                        Mata de São João, Norte Fazenda Caruaçu, Remanso, Rio dos Ovos, Rio Subaúma, São
                        Pedro and Sesmaria, which constitute the Remanso Cluster, in the Recôncavo basin,
                        Bahia state. The value of the acquisition is $30.0 million. Of this amount: (I) US$4.0
                        million, equivalent to R$20.6 million, were paid on the day of signature, on December
                        23rd, 2020; (II) US$21.0 million will be due and paid at the close of the transaction,
                        adjusted by the cash generation of the asset and other conditions of price adjustment, to
                        be presented by Petrobras, from July 2020 until the closing date; and (III) $5.0 million will
                        be paid in twelve months after the closing of the transaction, which is expected to occur
                        throughout 2021.
                        The National Agency of Petroleum, Natural Gas and Biofuels (“ANP”) unanimously
                        approved, at a Board Meeting No. 1050, held on May 27th, 2021, the assignment of
                        concession contracts of Remanso Cluster from Petróleo Brasileiro S.A – Petrobras to
                        the Company. For the closing of the transaction with Petrobras (“Closing”), ANP must
                        still approve the proposal for the constitution of the instruments of the deactivation
                        and abandonment guarantees presented by the Company and the transition schedule
                        of the operation, and the title of the environmental licenses, must be transferred by the
                        enviromental agency. The Company currently believes that the Closing of this transaction
                        may take place by the end of September 2021.
                        The map below represents the location of the Recôncavo Basin, with emphasis on
                        the Fields Operated by PetroReconcavo and the fields of the Miranga Cluster, which
                        acquisition was signed by the Company on February 24th, 2021:

Index

 10
Asset Portfolio Earnings Release | 2nd Quarter 2021
We operate the fields of this Cluster through a Risk Production Agreement signed
with Petrobras, their concessionaire, since February 1st, 2000. Thus, this agreement,
which is valid until August 2025, shall be terminated on the date of Closing the
purchase transaction of Remanso Cluster, when these fields will be operated as
own concessions. The concessions of this Cluster are the so-called “round zero”
that currently expire in August 2025 and can be extended the period of the same
for up to 27 additional years, upon specific request to the ANP and submission of
a Development Plan, and this extension is subject to the approval of the regulatory
agency.
In addition, between 2003 and 2007, Recôncavo E&P, a subsidiary of
PetroReconcavo, acquired, through ANP Bidding Rounds, five areas in the northern
part of the Recôncavo Basin, corresponding to the Fields of Lagoa do Paulo, Lagoa
do Paulo Sul, Lagoa do Paulo Norte, Juriti and Acará-Burizinho. The concessions of
these fields expire between the years 2029 and 2031 and may also be subject to the
extension request.
Acquisition of Miranga Cluster
On February 24, the Company, through the subsidiary SPE Miranga, signed a contract
for the purchase of all Petrobras’ stake in the nine land fields of Apraiús, Biriba,
Fazenda Onça, Jacuípe, Miranga, Miranga Norte, Rio Pipiri, Riacho de São Pedro and
Sussuarana that constitute the Miranga Cluster, in the Recôncavo basin, in Bahia.
The value of the acquisition is up to US$220.1 million, of which: (i) US$11.0 million has
already been paid on the signing day of subscription, on February 24, 2021; (ii) $44.0
million will be paid on the closing date of the transaction, without price adjustment;
(iii) $20.0 million that will be paid in twelve months after the transaction closes; (iv)
$20.0 million that will be paid in twenty-four months after the transaction closes;
(v) $40.1 million to be paid in thirty-six months after the transaction closes; and (vi)
up to US$85.0 million in contingent payments provided for in the contract, linked to
different possible bands of the oil reference price (Brent) in the period between the
calendar years 2022, 2023 and 2024.
The average production of the Miranga Cluster in 2020 was approximately 899
barrels of oil per day (bopd) and 377,000 m³ of gas per day. As in the other fields,
there is the possibility of extending the term of the concessions, which currently
expire in 2025, for 27 additional years, which will be requested through a protocol
Index of a development plan before the ANP and will be subject to the approval of the
regulatory agency.
11Earnings Release | 2nd Quarter 2021
03 Operational Performance
Average daily production increased 11.3% in the second quarter of 2021 when com-
pared to the same period of 2020, from 10,832 boe in 2Q20 to 12,059 boe in 2Q21,
being: (i) the average daily production of the Potiguar District increased 24.8% from
6,704 boe in 2Q20 to 8,364 boe in 2Q21; and (ii) the average daily production in the
Recôncavo District reduced 10.5%, from 4,128 boe in 2Q20 to 3,694 boe in 2Q21.
Average Daily Gross Production (in barrels of oil equivalent per day - BOED)
2Q21 2Q20 ∆% 1S21 1S20 ∆%
Recôncavo District 3,694 4,128 -10.5% 3,735 4,468 -16.4%
Potiguar District 8,364 6,704 24.8% 8,094 6,776 19.5%
Average Daily Gross Production 12,059 10,832 11.3% 11,829 11,244 5.2%
Potiguar District
In the second quarter of 2021, the Production of the Potiguar District followed its
upward trajectory, which has been observed since we took over operations in
December 2019, having grown 24.8%, compared to the second quarter of 2020, 14.8%
growth in oil production and 84.2% growth in natural gas production. The chart below
shows the production history of the Potiguar District.
Potiguar District - Average production in barrels of oil equivalent
per day (boed)
8,364
7,821
7,433
6,847 7,021 1,784
6,704 1,496
1,229
1,083 968 1,139
5,764 5,735 5,882 6,204 6,325 6,580
Index
Source: ANP
1Q20 2Q20 3Q20 4Q20 1Q21 2Q21
Oil Gas
12Operational Performance Earnings Release | 2nd Quarter 2021
The volumes shown in the table above represent the total production of
the Potiguar District, including the 30 fields operated by the Company and
PetroReconcavo’s participation in the four fields operated by partners until May
2021. From June, the Company also started operating the fields of Sabiá da Mata and
Sabiá Bico-de-Osso, previously operated by the partner Sonangol Hidrocarbonetos
do Brasil.
The gradual increase in natural gas production is aligned with the improvement in
the commercialization conditions reported in the 1Q21 Earnings Release and in the
Company’s strategy for monetization of the product. As a subsequent event, the
Company through its subsidiary, Potiguar E&P, informed the market on July 31st, 2021,
that it was declared the winner in the Public Call for Natural Gas Supply – 2022/2023
from Potigás - Companhia Potiguar de Gás. The contract for the sale of natural gas
with POTIGÁS is expected to last two years for delivery of 236,000 m3/day, starting
January 2022.
For Potiguar E&P, the contract represents an important step towards enabling its
strategy of monetizing its gas production, with an increase of approximately 150% on
the value of the gas molecule. The Company, which concludes its first contract with
a state gas distributor, must also contract with Petrobras the flow and processing
of its gas in UPGN Guamaré, as well as contract access to the transporting network
operated by TAG, allowing the transportation of natural gas from UPGN Guamaré to
the delivery points (city gates) determined by Potigás.
The indicated processing enables the specification of natural gas for sale according
ANP regulations (dry gas). As a result of the processing, the Company will also
be entitled to the natural gas liquids extracted at the plant, which are Liquefied
Petroleum Gas (LPG) and C5+, also known as natural gasoline. The commercialization
of these products will add even more value to the natural gas monetization strategy.
Index
13Operational Performance Earnings Release | 2nd Quarter 2021
It should also be emphasized that the contract with Potigás is the first step taken
by the Company in its strategy of maximizing the value of its commodity, but the
Company is currently participating in other Public Call processes in progress, as well
as following the movements associated with the creation of Free Consumer of
Natural Gas figure realization in the states covered by the TAG transportion network.
Making zoom in production only for the 30 fields operated by the Company since
December 2019, the production increases are even more significant. The average daily
production of oil and gas in boe in June 2021 was 78% higher than the volume that
was produced when we assumed the operation of these fields, being 70% higher in
oil and 105% in natural gas.
30 Fields Potiguar - Average daily production of oil and natural gas
(boed)
7,683
1,901
5%
10
4,326
927
5,781
%
70
3,398
Source: ANP
Dec/19 Jun/21
Oil Gas
The Company continues with its verticalization strategy with efforts to expand the
amount of active assets of Rigs and other Oilfield, expanding its execution capacity.
In the second quarter of 2021 we had a 76% increase in active rigs, compared to
Index the same period a year earlier. In April, one of the rigs underwent scheduled for
annual maintenance for about 15 days.
14Operational Performance Earnings Release | 2nd Quarter 2021
Potiguar District - Average number of active rigs, Workovers
and Stimulations
2.8
1.6
5
11 10
2Q20 2Q21
#Workovers #Stimulations #Average number of active rigs
In the second quarter of 2020, return-to-production work was carried out, which
consists of reactivating wells with economic potential. In the second quarter of 2021,
projects of greater complexity were carried out, which require higher capex and
execution time, with emphasis on the campaign of conventional hydraulic fracturing
in Riacho da Forquilha field (RFQ).
It is currently underway the evaluation of the production potential of deeper areas
with low permeability of the Pendencia Formation in the RFQ field, which, despite
presenting some historical tests, were never adequately developed in the region. In
order to map and develop this accumulation, the initial potential of a well available
in the RMU was evaluated, which we designated “deep RFQPD” which presented gas
and condensate production. The next step in the evaluation of this RMU consists in
conducting technical studies to design a conventional hydraulic fracturing work and
replacement of lifting equipment.
Glossary
Reservoir Management Unit - RMU: Is an assigned reservoir management unit defined to centralize the studies of a group of wells in a field. The information generally
considered for the grouping and definition of an RMU is the geographical location of the wells, the structural geology of the reservoirs, the production profile of the
wells and the history of reservoir pressure, with the possibility of an RMU characterizing a hydraulically isolated block from the other ones in the field or being just a
management tool.
It is from an initial visualization of all this information from the RMU that a preliminary diagnosis of the production behavior is made, the main events that affected
production during the evaluation period are mapped and, consequently, the water injection guidelines for pressure revitalization in the reservoirs are defined and the
Index need for adjustment of the production/injection mesh is identified to increase the reservoir drainage efficiency.
Stimulation: Increases the productivity of an oil and gas producing well or the efficiency of the injectors by changing the original permeability of the reservoir-rock.
This allows the oil to reach the surface more easily by eliminating heavy particles of oil, sand, paraffin, calcifications etc.
Conventional fracturing: Stimulation technique that allows the rupture of low permeability rocks, increasing the productivity of the field. PetroReconcavo has its own
hydraulic fracturing unit that injects fluid usually containing sand or bauxite at high pressures, thus breaking the rock.
15Operational Performance Earnings Release | 2nd Quarter 2021
Recôncavo District
In the second quarter of 2021, production in the Recôncavo District decreased by
10.5% compared to the second quarter of 2020.
The investment strategy in 2Q21 focused on the realization of some projects aimed
at increasing production by conventional hydraulic fractures in some wells in the
Norte Fazenda Caruaçu field and some return-to-production projects totaling a
CAPEX of about R$6.1 million and an estimated daily production increase from these
projects of 156 boed.
In contrast, in the second quarter of 2021, the district’s production was mainly
impacted by the failure of some high-flow wells that totaled an average of 215 boed
in production losses. These well failure and subsequent repairs, also affected the
costs of the period.
The chart below shows the production history of the Recôncavo District.
Recôncavo District - Average daily oil and natural gas production (boed)
4,808
494 4,128
3,794 3,857 3,776 3,694
468
444 477 523 561
4,314 3,660 3,350 3,380 3,253 3,133
Source: ANP
1Q20 2Q20 3Q20 4Q20 1Q21 2Q21
Oil Gas
Regarding equipment availability, in the second quarter of 2021 we had the aver-
age number of active rigs 129% higher than the same period of 2020, even with the
stop of PR 02 for 36 days for annual maintenance between the months of April
and May 2021.
We are gradually resuming our investment program in the District, which in the
Index second quarter of 2020 did not record workover interventions due to the low eco-
nomic attractiveness of projects because of the low price of Brent in the period.
During this period, the rig worked exclusively on well-service projects.
16Operational Performance Earnings Release | 2nd Quarter 2021
Recôncavo District - Average number of active rigs, Workovers
and Stimulations
1.6
0.7
2
There were no
Workovers and
Stimulations in 7
the period
2Q20 2Q21
#Workovers #Stimulations #Average number of active rigs
The average consolidated production cost in the quarter was$12.70/boe. Despite
representing an increase, when compared to 2020, the costs are much lower
than those observed in the years 2018 and 2019. It should be noted that, due
to the Covid-19 pandemic, and its impacts on international Brent oil prices,
the Company significantly reduced non-critical activities, especially in the sec-
ond quarter of 2020, so that the comparison base is not very representative.
More details on cost variations in the quarter can be obtained in the topic
“Consolidated Financial Performance” below.
Index
17Operational Performance Earnings Release | 2nd Quarter 2021
Average production cost of PetroReconcavo Consolidated (in US$/boe)
21.72 22.22
20.06 20.13
15.30
14.40
8.49 9.13
8.19
20,06
10,50
12,60
12,70
21,11
2018 2019 2020 2Q21 1S21
Consolidated Recôncavo Potiguar
The large difference in average production costs between districts stems mainly
from the differences in reservoir maturity between districts. For example, the
Recôncavo District is already in a more advanced phase of secondary recov-
ery from water injection, which can be verified by the differences in Water/Oil
Ratio (“WOR”) produced. In the Recôncavo, the WOR is approximately 30 while
in Potiguar it is approximately 8. This means that for each barrel of oil produced
in the Recôncavo District, approximately 30 barrels of water are produced,
while Potiguar produces 8 barrels of water for each barrel of oil. The main costs
impacted by this higher production of fluid (water + oil) are electricity and cost
with chemical additives. In addition, the higher volume of oil production in
Potiguar provides a greater dilution of fixed costs.
With the start of the Miranga Cluster operations in the Recôncavo Basin, which
will be operated in an integrated manner with the Remanso Cluster, we aim to
capture operational and financial synergies, with potential reduction of average
production costs.
Index
18Earnings Release | 2nd Quarter 2021
04 Consolidated Financial
Performance
Consolidated DRE (in thousands of R$)
2Q21 2Q20 ∆% 1S21 1S20 ∆%
Net revenue 249,110 185,488 34.3% 494,898 381,036 29.9%
Costs and expenses (117,756) (66,521) 77.0% (231,912) (156,740) 48.0%
EBITDA 131,354 118,967 10.4% 262,986 224,296 17.2%
Depreciation, amortization
(68,381) (53,107) 28.8% (129,433) (106,377) 21.7%
and depletion
Operating profit 62,973 65,860 -4.4% 133,553 117,919 13.3%
Net financial result 63.670 (85.454) n.m. (31.115) (342.345) n.m.
Current taxes (17,986) (5,316) 238.3% (20,149) (12,670) 59.0%
Deferred taxes (14,091) 9,754 -244.5% (613) 85,899 -100.7%
Net income 94,566 (15,156) n.m. 81,676 (151,197) n.m.
Net Revenue
The Company’s net revenues grew 34.3%, from R$185.488k in the second quarter of
2020 to R$249,110k in the second quarter of 2021.
Net revenue (in thousands of R$)
2Q21 2Q20 ∆% 1S21 1S20 ∆%
Recôncavo District 82,004 50,841 61.3% 164,881 127,500 29.3%
Revenue from the provision
68,918 42,447 62.36% 141,451 110,166 28.40%
of services in oil production
Revenue from the provision of
services in the production of 8,588 5,591 53.60% 14,909 11,956 24.70%
natural gas
Oil sales revenue 3,663 1,576 132.42% 6,772 3,092 119.02%
Other revenue stemming from
835 1,227 -31.95% 1,749 2,286 -23.49%
the provision of services
Potiguar District 258,066 77,248 234.1% 476,429 199,571 138.7%
Oil sales revenue 243,459 77,109 215.73% 452,178 199,160 127.04%
Natural gas sales revenue 14,607 139 10408.63% 24,251 411 5800.49%
Index Derivative financial
(20,744) 78,827 -126.3% (17,204) 109,161 -115.8%
instruments
Gross income 319,326 206,916 54.3% 624,106 436,232 43.1%
Revenue taxes (70,216) (21,428) 227.7% (129,208) (55,196) 134.1%
Net Revenue 249,110 185,488 34.3% 494,898 381,036 29.9%
19Consolidated Financial Earnings Release | 2nd Quarter 2021
Performance
We highlight in net revenue the increase of 234.1% in sales from the Potiguar
District, which went from R$77,248k in the second quarter of 2020, to R$258,066k
in the second quarter of 2021. In addition to the 24.8% increase in production for
the period, as seen in the topic “Operating Performance”, the average value of a
barrel of Brent oil was 135.7% higher in the second quarter of 2021, when compared
to the same period of 2020. Additionally, although natural gas represents a lower
percentage in the District’s revenues, in 2021 we obtained a new sales contract,
with an average price much higher than the values practiced in 2020.
It should be noted that in the second quarter of 2020, due to the Covid-19
pandemic, international oil prices reached the lowest point in the year, with the
month with the lowest average price being April 2020, with an average price of
US$18.55 per barrel.
On the other hand, the appreciation of the value of the Brent crude barrel resulted
in a loss in derivative financial instruments settled in the period. In the second
quarter of 2021, we recorded a loss of R$20,744k under this heading, while in the
same period of 2020, the result was positive by R$78,827k. During this quarter,
hedging contracts with a volume of 504k barrels of oil were settled, at an average
price of$58.86/bbl. In the second quarter of 2020, the volume settled was 456k
barrels, at an average price of US$63.75/bbl. The average price of a barrel of Brent
oil in the second quarters of 2021 and 2020, respectively, was $68.83 and$29.20.
Index
20Consolidated Financial Earnings Release | 2nd Quarter 2021
Performance
Operating costs and expenses
The table below presents some breakdown and comparisons of our costs and
expenses in 2020 and 2021, which should be interpreted with caution, considering
that, due to the Covid-19 pandemic and its impacts on international Brent oil
prices, the Company significantly reduced non-critical activities as of the second
quarter of 2020.
Costs and Expenses (in thousands of R$)
2Q21 2Q20 ∆% 1S21 1S20 ∆%
Recôncavo District 36,685 23,061 59.1% 81,580 59,303 37.6%
Personnel 10,267 7,223 42.14% 19,223 14,703 30.74%
Well repair costs 10,983 4,352 152.37% 23,194 15,778 47.00%
Electrical energy 8,407 7,308 15.04% 16,362 16,736 -2.23%
Royalties 323 132 144.70% 690 352 96.02%
Other costs and expenses 6,705 4,046 65.72% 22,111 11,734 88.44%
Potiguar District 61,280 33,238 84.4% 120,097 74,531 61.1%
Personnel 10,391 5,946 74.76% 19,355 13,306 45.46%
Well repair costs 6,444 5,579 15.52% 14,266 12,468 14.42%
Electrical energy 4,210 3,094 36.07% 8,522 7,661 11.24%
Environmental licensing 3,574 2,185 63.57% 7,460 5,478 36.18%
Royalties 23,861 7,748 207.96% 44,073 18,418 139.29%
Other costs and expenses 12,800 8,686 47.35% 26,421 17,200 53.61%
Corporate 19,791 10,222 93.6% 30,235 22,906 32.0%
Total 117,756 66,521 77.0% 231,912 156,740 48.0%
Costs and expenses grew 77.0%, or R$51,235k from R$ 66,521k in the second quarter
of 2020 to R$117,756k in the second quarter of 2021. The cost increase is explained
in the topics below:
Index
21Consolidated Financial Earnings Release | 2nd Quarter 2021
Performance
Recôncavo District
Costs and expenses in the Recôncavo District grew 59.1%, from R$23,061k in the
second quarter of 2020 to R$36,685k in the same period of 2021. The main points
that explain these variations are:
(a) Personnel costs increased 42.14%, from R$7,223k in the second quarter of
2020 to R$10,267k in the same period of 2020. This increase stems from the
reduction of non-critical activities in the second quarter of 2020, due to the
Covid-19 pandemic. Among the measures taken by the Company, in order to
preserve jobs, we temporarily suspended the employment contract of some
employees in the period, reducing personnel costs. Additionally, the Company
is preparing to become a concessionaire of the Remanso Cluster fields and for
the takeover of the Miranga Cluster;
(b) Well repair costs grew 152.37%, from R$4,352k in the second quarter of 2020
to R$10,983k in the same period of 2021. With the Covid-19 pandemic, and the
consequent fall in the price of a barrel of Brent-type oil seen in the second
quarter of 2020, it became uneconomic to repair some wells that broke
throughout the quarter. Thus, well repair costs were lower in the second
quarter of 2020;
(c) Electricity costs increased 15.04%, from R$7,308k in the second quarter of 2020
to R$8,407k in the same period of 2021. In 2020, due to the impacts generated
by the Covid-19 pandemic, tariff impacts on electricity were postponed. This
postponement was compensated in 2021. In addition, in 2020 we stopped the
production of some wells in the district that had high production costs. With
the recovery of Brent-type oil prices on international markets, we resumed
production of some of these wells throughout 2021. As a consequence of the
above, energy costs were lower in 2020 and increased in 2021.
Index
22Consolidated Financial Earnings Release | 2nd Quarter 2021
Performance
Potiguar District
Costs and expenses in the Potiguar District grew 84.4%, from R$33,238k in the second
quarter of 2020 to R$61,280k in the same period of 2021. The main points that explain
these variations are:
(a) Personnel costs increased 74.76%, from R$5,946k in the second quarter of 2020
to R$10,391k in the same period of 2021. At the beginning of 2020, the Potiguar
District was still in the process of structuring and mobilizing personnel to start
the asset maintenance program. With the Covid-19 pandemic, we ended up
postponing the mobilization of personnel, reflecting lower costs in the first
months of 2020. In addition, the Company chose to internalize some functions
that were initially contracted as external services;
(b) Well repair costs grew 15.52%, from R$5,579k in the second quarter of 2020
to R$6,444k in the same period of 2021. With the Covid-19 pandemic, and the
consequent fall in the price of a barrel of Brent-type oil seen in the second
quarter of 2020, it became uneconomic to repair some wells that broke
throughout the quarter. Thus, well repair costs were lower in the second quarter
of 2020;
(c) Electricity costs increased 36.07%, from R$3,094k in the second quarter of
2020 to R$4,210k in the same period of 2021. In addition to the tariff impacts,
explained in the variations of the Recôncavo District, and this variation follows
the increase in the level of production and active wells in the Potiguar District in
the second quarter of 2021;
(d) Environmental licensing costs increased 63.57%, from R$2,185k in the second
quarter of 2020 to R$3,574k in the same period of 2021. With the Covid-19
pandemic, there was a postponement in the payment of environmental permits
in the second quarter of 2020;
(e) Royalty costs jumped 207.96%, from R$7,748k in the second quarter of 2020
to R$23,861k in the same period of 2021, following the evolution in district
revenues; and
(f) Finally, the other costs and expenses presented a variation of R$ 4,113k, from
R$8,686k in the second quarter of 2020 to R$12,800k in the same period of
2021. With the improvement in the prices of the gas contract for Petrobras from
January 2021, we started a process of revitalization of gas compression and flow
systems in the district in order to allow a reduction in gas production, impacting
the production cost of the period. In addition, the line was impacted by the
Index extraordinary payment of R$ 3,000k to Sonangol Hidrocarbonetos do Brasil, as
financial compensation for the transfer of operations in the Sabiá da Mata and
Sabiá Bico-de-Osso fields.
23Consolidated Financial Earnings Release | 2nd Quarter 2021
Performance
Corporate
Corporate costs and expenses grew 93.6%, from R$10,222k in the second quarter
of 2020 to R$19,791k in the same period of 2021. In the second quarter of 2021,
the Company paid approximately R$4,919k, including social charges, referring to
extraordinary bonuses to the Company’s executives and strategic employees due
to the opening of capital and approximately R$2,000k was paid in consultancies
related to mergers and acquisitions processes. Additionally, the Drilling Rig did not
operate in the quarter, which resulted in a cost of R$1,630k in the quarter. Finally,
the increase in the corporate structure was expected and reflects the structure
necessary to meet the new requirements that arise after the IPO.
Net financial result
Net financial results in the second quarter were positive at R$63,670k, compared to a
negative net result of R$85,454k in the same period of 2020.
Financial result, net (in thousands of R$)
2Q21 2Q20 ∆% 1S21 1S20 ∆%
Financial revenues 5,335 4,035 32.2% 20,878 4,437 370.5%
Financial expenses (30,962) (33,412) -7.3% (54,023) (61,591) -12.3%
Exchange variation
118,579 (56,784) -308.8% 31,280 (286,223) -110.9%
on financing
Other exchange
(29,282) 707 -4241.7% (29,250) 1,032 -2934.3%
variations
Financial result, net 63,670 (85,454) n.m. (31,115) (342,345) -90.9%
The main reason for the observed changes in financial results is in the lines of
exchange variation lines. The exchange rate on June 30, 2021, decreased 12.3%
compared to March 31, 2021. In the same period of 2020, the exchange rate
increased. The variations are shown in the table below.
R$/US$
exchange 30/06/2021 ∆% 31/03/2021 30/06/2020 ∆% 31/03/2020
Index rate 5.00 -12.3% 5.70 5.48 5.4% 5.20
24Consolidated Financial Earnings Release | 2nd Quarter 2021
Performance
Therefore, the Company showed a positive exchange rate variation of R$118,579k
in financing balances in foreign currency, while in the second quarter of 2020 this
change was negative by R$56,784k.
On the other hand, the Company maintains financial investments in foreign
exchange funds in order to track the change in the dollar against the real, since
much of the Company’s liabilities are in dollars, thus aiming to protect itself from
exchange variation.
Income tax and social contribution on net income
Income tax and social contribution (in thousands of R$)
2Q21 2Q20 ∆% 1S21 1S20 ∆%
Currents (17,986) (5,316) 238.3% (20,149) (12,670) 59.0%
Deferred (14,091) 9,754 -244.5% (613) 85,899 -100.7%
Income tax and
(32,077) 4,438 -822.8% (20,762) 73,229 -128.4%
social contribution
Because of the higher result observed in the second quarter of 2021, current taxes
were 238.3% higher than in the same period of 2020, from R$5,316k to R$17,986k.
In the deferred tax line, the main variation is observed in the line of accumulated
tax losses. The subsidiary Potiguar E&P used part of its accumulated tax losses,
resulting in a negative change of R$ 12,568k in deferred taxes for the period.
Index
25Consolidated Financial Earnings Release | 2nd Quarter 2021
Performance
Consolidated cash flow statement (in thousands of R$)
2Q21 2Q20 ∆% 1S21 1S20 ∆%
Profit (loss)
126,643 (19,594) -746.3% 102,438 (224,426) -145.6%
before taxes
Depreciation,
amortization and 68,381 53,107 28.8% 129,433 106,377 21.7%
depletion
Interest and exchange
(102,997) 77,641 -232.7% 872 326,270 -99.7%
variations, net
Asset and rental losses 24,470 3,044 703.9% 56,740 23,521 141.2%
Gold adjustments and
2,830 (813) -448.1% 8,586 9,787 -12.3%
variations
Change in assets and
16,825 2,877 484.8% (8,492) (31,980) -73.4%
liabilities
Interest paid (15,564) (22,144) -29.7% (31,331) (32,129) -2.5%
Cash generated by
120,588 94,118 28.1% 258,246 177,420 45.6%
operating activities
Additions to property,
(61,073) (10,352) 490.0% (187,078) (61,070) 206.3%
plant and equipment
Financial investments (872,773) (73,957) 1080.1% (870,548) (130,591) 566.6%
Cash invested in
(933,846) (84,309) 1007.6% (1,057,626) (191,661) 451.8%
investment activities
Borrowings - - n.a. 60,479 - n.a.
Amortization of
financing and market (73,480) (7,676) 857.3% (134,653) (10,785) 1148.5%
leases
Increase in share
capital, net of cost for 1,111,648 1,015 109422.0% 1,111,648 3,375 32837.7%
issuance
Cash generated
(applied) in financing 1,038,168 (6,661) -15685.8% 1.037,474 (7,410) -14101.0%
Index activities
Increase (decrease) in
cash balance and cash 224,910 3,148 7044.5% 238,094 (21,651) -1199.7%
equivalents
26Consolidated Financial Earnings Release | 2nd Quarter 2021
Performance
The cash generated from operating activities increased R$26,470,000, or 28.1%,
in the second quarter of 2021, influenced not only by higher EBITDA, which was
R$12,387k higher in the period, but also by the reduction in the balance of accounts
receivable by R$12,055k in the period, because of receipts that were outstanding as
of march 2021 and were received during current quarter.
The cash invested in investment activities increased by 1,007.6%, or R$849,538k, in
the second quarter of 2021, as a combination of the following factors:
(I) The Company invested R$61,073k in additions to the fixed assets and
intangible assets, generating an increase of R$50,721k, when compared to
the second quarter of 2020, mainly due to the resumption of the Company’s
investment program, which was reduced in the second quarter of 2020 due
to the Covid-19 pandemic;
(II) In the second quarter of 2021, we made financial investments of R$872,773k,
a number of R$798,816k higher than that applied in the same period of 2020.
This variation stems from the application of part of the resources obtained
from the company’s IPO, which occurred in May 2021.
The cash generated in the financing activities was R$1,044,829k in the second
quarter of 2021, while in the same period of 2020 R$6,661k was invested. This
variation is mainly due to the resources raised at the Company’s IPO, which
occurred in May 2021.
Because of the items listed above, the increase in cash balance and cash
equivalents in the second quarter of 2021 was R$224,910 million, while in the
second quarter of 2020 there was an increase of R$ 3,148k.
Index
27Earnings Release | 2nd Quarter 2021
05 Other Highlights of the Balance Sheet
Cash position (cash and cash equivalents and financial investments)
On June 30th, 2021, the Company recorded a cash position, which represents the
sum of cash and equivalent balances and financial investments, of R$1,274,514k, an
increase of 668.4% when compared to the balances at December 31st, 2020.
Most of the Company’s resources were invested in foreign exchange funds (56%),
because the Administration chose to invest part of the funds raised in its Initial Public
Offering in this type of investment as a way to protect itself from exchange variation,
considering that its bank debts (and its Subsidiaries debts) and remaining payments
to Petrobras related to asset acquisitions are denominated in U.S. dollars. The
other financial investments refer to fixed income transactions (CDB - Bank Deposit
Certificate), maintained with first-tier banks.
Net indebtedness (in thousands of R$)
2Q21 2Q20 ∆%
FINEP 2,307 3,320 -30.5%
Bank loans 831,307 1,084,034 -23.3
Costs to be amortized (28,631) (42,803) -33.1%
Gross debt 804,983 1,044,551 -22.9%
Cash and cash equivalents 268,955 34,614 677.0%
Financial investments 1,005,559 140,773 614.3%
(Net cash) Net debt (469,531) 869,164 n.m.
EBITDA of the last 12 months 513,095 314,611 63.1%
(Net cash) Net Debt/EBITDA last 12 months -0.92 x 2.76 x -3.68 x
The Company had net cash of R$469,531k in the second quarter of 2021, compared
to a net debt of R$869,164k in the same period of 2020. This variation is basically due
to the resources obtained from the IPO, explained in previous topics.
Index
28Other highlights of Earnings Release | 2nd Quarter 2021
the balance sheet
The movements of loans and financing balances in the semester are shown below:
Movement of loans and financing (in thousands of R$)
Balance at December 31, 2020 894,040
Borrowing 60,479
Principal payments (123,437)
Interest paid (31,331)
Accrued interest 29,716
Amortization of acquisition cost 6,796
Exchange variation (31,280)
Balance at June 30, 2021 804,983
Considering the outstanding payments to Petrobras related to the assets acquired
and to the assets which are in the transition phase between signing and closing,
excluding the effects of the purchase price adjustments, the Company has a
balance of $291.3 million in payments to be made distributed over the next 4 years,
of which US$ 85.0 million are contingents depending on the average value of Brent.
2021 2022 2023 2024 2025
Q1 Q2 Q3 Q4 Q1 Q2 Q3 Q4 Q1 Q2 Q3 Q4 Q1 Q2 Q3 Q4 Q1
Potiguar 56.2 56.2
Remanso 26.0 21.0 1 year 5.0
(at closing1,2)
Miranga 124.1 44.0 1 year 20.0 1 year 20.0 1 year 40.1
(at closing1)
Miranga Earn-outs 85.0
27.5 27.5 30.1
Q1 Q2 Q3 Q4 Q1 Q2 Q3 Q4 Q1 Q2 Q3 Q4 Q1 Q2 Q3 Q4 Q1
2021 2022 2023 2024 2025
Notes: (1) Expected closing dates. To be confirmed. (2) Price adjustment at closing.
Earn-outs Miranga (US$ MM)
Average Brent 2022 2023 2024 Total
Below $50 - - - - Contingent payments according to
Between $50 and $55 10.0 10.0 5.0 25.0 the average value of Dated Brent ICE
oil in each year as per table, payable
Index Between $55 and $60 15.0 15.0 10.0 40.0
in March of the following year.
Between $60 and $65 20.0 20.0 15.0 55.0
Above $65 27.5 27.5 30.0 85.0
29Other highlights of Earnings Release | 2nd Quarter 2021
the balance sheet
Derivative financial instruments
The Company constantly evaluates the possibility of carrying out hedging operations
of future oil production in order to increase predictability and protect future cash
flow. The Company contracted commodity forward contracts to manage commodity
price risk associated with future transactions of up to 36 months.
The following table describes the commodity forward contracts outstanding as of
June 30th, 2021, as well as the information related to their corresponding hedged
items:
Average strike Quantity Fair value of the
Instruments of hedge open
price 30/06/2021 hedging instruments
contracts
30/06/2021 30/06/2021
US$/barrel In barrels R$ thousand
Less than 3 months 58.52 527,860 (41,914)
From 3 to 6 months 57.82 557,240 (40,252)
From 6 to 12 months 56.10 993,200 (69,518)
From 1 to 2 years 51.85 1,784,567 (132,766)
From 2 to 3 years 53.13 1,281,000 (63,879)
Total 54.32* 5,143,867 (348,329)
*Average strike of fixed-term contracts not yet settled as of June 30, 2021.
Index
30Earnings Release | 2nd Quarter 2021
06 Reserves certification
This section contains a summary of the Reserve Reports prepared by
independent expert Netherland, Sewell & Associates, Inc. (NSAI). The Reserve
Reports were prepared based on an analysis of our concessions and of some
Petrobras’ fields located in the Recôncavo basin in the State of Bahia, and in the
Potiguar basin in the State of Rio Grande do Norte, as of December 31st, 2020. The
evaluation of the Company’s Reserves and Resources was completed on January
20th, 2021, for the Company and its subsidiary, Potiguar E&P S.A. The Miranga
contingent resources assessment was completed on February 22nd, 2021.
Below is a summary table of the Company’s net reserves and contingent
resources, as of December 31st, 2020, prepared according to the reports on
reserves and contingent resources. The net reserves and contingent resources
represent the portions of the reserves and contingent resources of referred
concessions owned by or contractually attributed to the Company, discounted by
the participations of any third parties and the Government’s royalties.
Index
31Booking Certification
Earnings Release | 2nd Quarter 2021
F l u x o d e Ca i x a
B a rri s d e Ól e o ( P e t ró l e o c o m o ( Gá s c o m o %
P e t ró l e o e Li q u i d o s d e Gá s N a t u ra l Gá s D e sc o n t a d o - 1 0 %
% do Tota l )
E q u i v a l e n t e s ( 1) do Tota l )
( M U S $) ( 2)
R e c o n c a v o ( 3) P o t i g u a r ( 4) M i r a n g a ( 5) su b -t o t a l R e c o n c a v o ( 3) P o t i g u a r ( 4) M i r a n g a ( 5) su b -t o t a l Tota l
( e m m i l h a re s
( e m m i l h a r e s d e b a r r i s) ( e m m i l h õ e s d e p é s c ú b i c o s)
R e se r v a s L í q u i d a s d e b o e s)
Reservas provadas em produção 2.739,1 7.626,1 n.a. 10.365,2 1.903,2 6.901,7 n.a. 8.804,9 11.832,7 87,6% 12,4% 153.131,9
Reservas provadas desenvolvidas, porém não
1.370,5 2.437,3 n.a. 3.807,8 590,0 6.725,3 n.a. 7.315,3 5.027,0 75,7% 24,3% 74.803,7
em produção ("shut in" ou "behind pipe")
Reservas provadas não desenvolvidas 929,2 6.112,6 n.a. 7.041,8 266,7 2.328,7 n.a. 2.595,4 7.474,4 94,2% 5,8% 136.366,9
T o t a l d e r e se r v a s p r o v a d a s ( 1 P ) 5. 038, 9 16. 176, 0 n .a . 21. 214, 9 2. 760, 0 15. 955, 7 n .a . 18. 715, 7 24. 334, 1 87, 2% 12, 8% 364. 302, 5
Total de reservas prováveis 438,1 5.468,1 n.a. 5.906,2 244,1 2.384,1 n.a. 2.628,2 6.344,2 93,1% 6,9% 99.947,6
T o t a l d e r e se r v a s p r o v a d a s + p r o v á v e i s ( 2 P ) 5. 477, 0 21. 644, 1 n .a . 27. 121, 0 3. 004, 1 18. 339, 8 n .a . 21. 343, 8 30. 678, 3 88, 4% 11, 6% 464. 250, 1
Total de reservas possíveis 391,2 2.139,5 n.a. 2.530,6 38,4 564,0 n.a. 602,4 2.631,0 96,2% 3,8% 34.946,3
T o t a l d e r e se r v a s p r o v a d a s + p r o v á v e i s +
5. 868, 1 23. 783, 5 n .a . 29. 651, 6 3. 042, 4 18. 903, 8 n .a . 21. 946, 2 33. 309, 3 89, 0% 11, 0% 499. 196, 5
p o ssi v e i s ( 3 P )
R e c u s r s o s Co n t i n g e n t e s
Menor Estimativa (1C) 9.041,7 19.181,2 18.639,9 46.862,8 4.029,0 28.963,0 175.918,7 208.910,7 81.681,2 57,4% 42,6% 438.136,1
Melhor Estimativa (2C) 13.918,9 26.097,3 22.309,6 62.325,8 5.694,1 37.304,8 217.971,7 260.970,7 105.821,0 58,9% 41,1% 531.636,2
Maior Estimativa (3C) 17.010,3 30.227,6 23.193,3 70.431,2 7.175,7 40.482,7 222.590,9 270.249,3 115.472,8 61,0% 39,0% 587.980,8
T o t a l ( 1 P + 1 C) 14. 080, 5 35. 357, 2 18. 639, 9 68. 077, 6 6. 789, 0 44. 918, 7 175. 918, 7 227. 626, 4 106. 015, 4 64, 2% 35, 8% 802. 438, 7
T o t a l ( 2 P + 2 C) 19. 395, 9 47. 741, 4 22. 309, 6 89. 446, 9 8. 698, 2 55. 644, 6 217. 971, 7 282. 314, 5 136. 499, 3 65, 5% 34, 5% 995. 886, 4
T o t a l ( 3 P + 3 C) 22. 878, 4 54. 011, 2 23. 193, 3 100. 082, 9 10. 218, 1 59. 386, 4 222. 590, 9 292. 195, 5 148. 782, 1 67, 3% 32, 7% 1. 087. 177, 2
Notes:
(1) Gas volumes were converted into boe at the ratio of 6k cubic feet of gas to 1 boe.
(2) Cash flow before financial expenses and income tax and social contribution discounted at an annual rate of 10%p.a.
(3) Reconcavo’s reserves include: (I) holdings (approximately 85%) company’s company through the Risk Clause Production Agreement (CPCR) in the 12 fields of Remanso Cluster; and (II) 100% participation
in the fields of Lagoa do Paulo, Lagoa do Paulo Sul, Lagoa do Paulo Norte, Juriti and Acará-Burizinho. All these fields located in the state of Bahia. Contingent resources refer to: (I) residual participation
(approximately 15%) currently held by Petrobras in the CPCR; and (II) the volumes of oil and gas to be produced after the deadlines of the concessions currently in force. Such resources are contingent
only on regulatory approvals of the acquisition of Remanso Cluster and its subsequent closure, and the extension of concessions.
Index (4) Potiguar’s reserves are composed of the 34 fields of The Riacho da Forquilha, of which 30 are 100% owned by Potiguar E&P and operated by Potiguar, 2 in partnership with Sonangol Hidrocarbonetos
Brasil Ltda (approximately 70% Potiguar E&P and 30% Sonangol) and 2 with Partex Brasil Ltda (50% Poti Eguar E&P and 50% Partex) , all located in the state of Rio Grande do Norte. Contingent resources
refer to the volumes of oil and gas to be produced after the concession deadlines currently in force. Such resources are contingent only on the extent of concessions. The values presented in the tables
reflect only the participation (working interest) of the Company in these concessions.
(5) Miranga’s contingent resources include a 100% stake in the 9 fields of the Miranga Cluster, all located in the state of Bahia. Such resources are contingent only on regulatory approvals of the acquisi-
tion of the Miranga Cluster and its subsequent closure, and the extension of concessions.
(6) The total values may not reflect the exact account due to possible rounding of numbers.
(7) The different classifications of oil accumulations have varying degrees of technical and commercial risk that are difficult to quantify; reserves, contingent resources and prospective resources should
not be aggregated without a broad consideration of these factors. This table shows the sum of the reserves and contingent resources shown in the NSAI reports without adjustments to these factors;
these somas are shown in this table for convenience purposes only.
32Earnings Release | 2nd Quarter 2021
07 Safety, Health, Environment
and Sustainability (SSMS)
For PetroReconcavo, safety is a non-negotiable value and a commitment made in
our Strategic Planning, which guide our daily operations and those who relate to
us. We develop our activities in accordance with applicable laws and regulations
in the places where we operate, in addition to complying with our own internal
guidelines and procedures based on best market practices
Our business requires an excellent performance based on responsible
management of the impacts that our activity generates on people, communities,
and the environment. To mitigate these impacts, we apply tools to identify the
risks associated with the activities and verify if the barriers we adopt are sufficient
to keep them under control. In the second quarter of 2021, we had 661,314 hours
worked with zero lost time incidents.
To strengthen our HS&E culture, throughout the second quarter, we continued
the Safe Leader Program, training our high and medium leadership. Through this
Program, the Company seeks to develop its leaders to be the protagonists of the
Safety Culture, stimulating its perception of risks, in order to interrupt the chain that
generates the accident.
In April, the Company launched the “ABRIL VERDE” campaign, promoting awareness
of continuous improvement in occupational safety and occupational health issues.
On May 22, we reached a historic milestone of 1. 000 days without Lost Time
Incidents in the Recôncavo District. On this date we celebrate and recognize the
main leaders who stood out in the themes of Health and Safety. As os June 30th,
2021, we continued without lost time incidents in the Recôncavo District.
We also carried out the “MAIO AMARELO” Campaign for the prevention of traffic
accidents, involving the entire Company. During the campaign, theoretical and
practical training was carried out, in which 197 workers participated, corresponding
to a total of 1,182 hours of training.
Index
33You can also read