Embassy Office Parks REIT - Initiating Coverage - Axis Direct
←
→
Page content transcription
If your browser does not render page correctly, please read the page content below

Initiating Coverage

Embassy Office Parks REIT

                          23 DEC 2019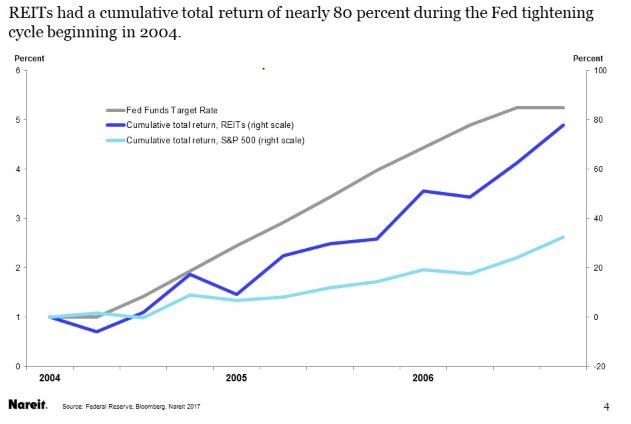
23 DEC 2018 Company Report
BUY
Target Price: Rs 495
Current Market Price : 420
Potential Upside : 18%
Stock data
No. of share (Cr) : 77.2
Market cap (Rs.Cr.) : 33181.6
Embassy Office Parks REIT
52 week high/low : 462/300
Avg. daily vol. (6mth) : 551210
Bloomberg code : EMBASSY IN
Commercial Real Estate Shareholding Pattern :
Sponsor Group : 70%
FII/DII : 16%/1%
REIT way is the right way Retail : 13%
Price performance*
160
120
80
40
Apr-19 Jun-19 Aug-19 Oct-19 Dec-19
BSE Sensex Embassy Off.REIT
Financial Summary Key Drivers
Revenue NOI NDCF EV/EBITDA DPS Metric FY 19 FY 20E FY 21E FY 22E
Y/E March Debt/Equity
(Rs Cr) (Rs Cr) (Rs Cr) (x) (Rs)
NOI Growth - 20% 16% 13%
2019 1,877 1,574 - 4.9 17% 0.0
2020E 2,304 1,890 1,814 5.9 17% 22.5 Occupancy 94% 95% 96% 97%
2021E 2,611 2,193 2,062 21.4 20% 24.5
2022E 2,956 2,483 2,285 19.1 23% 26.7 Rentals (in Rs/psf) 63 67 71 75
Source: Company, Axis Securities, CMP as on Dec 20, 2019, *Price Performance is normalized to 100 for better comparison
Ankit Suchanti – Manager - Research Analyst | ankit.suchanti@axissecurities.in | (+91 22 4267 1778)
23 DEC 2018 Company Report
Embassy Office Parks REIT
REITs offer Stable Debt like Cash Flows with (Equity Like) Growth… Sector: Commercial Real Estate
What are REIT’s?
REIT’s are an asset class that owns income producing real estates like offices, hotels, warehouses, apartments, shopping centers etc. This
asset class has been in existence for over four decades in developed countries
REIT was approved in the Budget of 2014 and SEBI (Real Estate Investment Trust) Regulations, 2014 provides detailed requirements and
guidelines of listing and operating REIT
Investing in REIT is like investing in a collective investment scheme (much like mutual fund), where money is pooled from many investors to
invest in income generating, high-end real estate assets (primarily commercial real estate). The income generated is then distributed to REIT
holders at regular intervals which is mandated by regulation
What are the benefits of REIT’s to investors? Annualized returns by economic cycle (1991-2018)
REITs, across the globe, have performed at comparable levels to 30
broad equity indices. For ex. REITs have averaged 11.1%, while 22.8
the S&P 500 has averaged 9.8% over the last 28 years. They 20 15.6
have shown low volatility and recession protection similar to 11.3 11.1
10.6 9.8
defensive equity stocks 10 7.1
REITs have also shown lower correlation with other asset classes
like Equity, Debt, Commodities. Thus, providing an excellent
0
choice for diversification -0.2
REIT’s provide downside protection during economic downturns
(10)
as the underlying cash flow is contractually bound by long term -9.6
leases thereby ensuring a steady dividend yield at all times.
(20)
Overall, REIT’s provide characteristics of both debt and equity. -17.7
Equity Characteristics: Short term volatility due to market price Early Cycle Mid Cycle Late Cycle Recession All Periods
movement, capital appreciation, growth levers built in lease US REITS S&P 500
contracts. Debt Characteristics: Stable dividend yields backed by
cash flows from long term leases (7-9 years) of tenants, high
correlation to inflation hence providing inflation protection
REIT’s have shown lower volatility & higher return compared to S&P 500
Sources: The Conference Board, National Bureau of Economic Research (NBER), Thomson Reuters, Cohen & Steers, Betas, NYU Stern, SEBI, Axis Securities
323 DEC 2018 Company Report
Embassy Office Parks REIT
Embassy REIT Overview Sector: Commercial Real Estate
Embassy Office Parks is the owner of premium office portfolio in India that serves as corporate infrastructure to multinational tenants. Company’s
Portfolio comprises of seven Class A office parks and four city-center office buildings totaling 33 msf (million square feet) of total area. They provide
strategic amenities, including 2 completed and 2 under-construction hotels totaling 1,096 keys, food courts, childcare and employee transportation
facilities
Their Portfolio is strategically located in India’s four key office markets of Bengaluru, Pune, Mumbai and Noida which are amongst the top-performing
in India and account for 72% of total Grade A office stocks. In the last 5 years these markets have seen one of the highest absorption of premium
office space in the world beating New York, San Francisco, Shanghai, Central London and Tokyo
Their Occupancy is at 94.7% with weighted average lease expiry of 7.2 years. They have 165 tenants comprising a mix of blue-chip multinational
and Indian corporates, such as JP Morgan, DBS, Swiss Re, Google, McKinsey, IBM and L&T Technology Services. Approximately 45% of Gross
Rentals come from Fortune 500 companies. Nearly, 53% of our Gross Rentals are derived from tenants in technology sector, with the remainder
coming from various industries including financial services, healthcare and telecommunications. Embassy REIT is backed by strong sponsors; Blackstone
LLP, the largest alternative investment firm in the world and Embassy Group which is a local expert and has developed 45 msf of real estate in India
Assets Tenant Metrics
Locations
Noida
33msf Largest REIT in Asia 165 Blue Chip MNC’s
11 Best-in-Class Properties 45% Rent from Fortune 500
Premium Hotel Room
1096 Mumbai 53% Rent From Tech. Services
Keys
100Mw Solar Power 94.7% Occupancy
Bengaluru
Pune
Sources: Company, Axis Securities
423 DEC 2018 Company Report
Embassy Office Parks REIT
Investment Rationale Sector: Commercial Real Estate
Embassy Office Parks REIT, is the owner of premium office portfolio in India that serves as corporate infrastructure to multinational tenants.
It is the largest REIT in Asia and the first REIT to get listed in India. Its primary source of revenue is through long term rental contracts from
world class tenants which makes the cash flows for the company quite stable. Embassy REIT’s business has multiple growth levers
(discussed in detail in later sections) that is supported by a strong services sector and a growing, tech-savvy, low cost human capital.
Embassy REITs operational execution is one of the best amongst REIT’s the world over due to its highly experienced management team that
has global experience in property management. Embassy REIT is backed by strong sponsors; Blackstone LLP, the largest alternative
investment firm in the world and Embassy Group which is a local expert and has developed 45 msf of real estate in India. Additionally,
REIT as an asset class has shown comparable returns to broad equity markets (and low correlations) with downside protection during
recession making it an attractive investment class
We expect revenues/earnings to grow at CAGR of 16% / 41.5% respectively over FY19-22E driven by
Present in Key Highly
office markets Marquee, Sticky Strong
Significant and Tenant profile Financials with Experienced
with proxy play Management
on multiple Growth implies stable superior
Levers long term cash operational backed by
high growth world Class
technology, flows efficiency
Sponsors
services sector
We initiate coverage with “BUY” rating and a target price of Rs 495, implies a 18% upside
Source: Company, Axis Securities
523 DEC 2018 Company Report
Embassy Office Parks REIT
Macro Drivers: Attractive Commercial Real Estate Market Sector: Commercial Real Estate
Indian Commercial Real Estate has one of the lowest rents globally Lower rents make it favorable to set up offices for MNC’s in India
12000 300000
Indian markets charge 1/5h to 1/7th of the rent charged in
other major office markets, making it extremely attractive for 8000 200000
global players to set up offices here 4000 100000
The Capital values are also very low (1/5th of global values), 0 0
NCR
Munich
Tokyo
San Fransisco
Bengaluru
Pune
Sydney
London
Mumbai
Los Angeles
New York
Hong Kong
Beijing
Shanghai
Singapore
which makes investment in office real estate very cost effective
India also has abundant English speaking talent at 1/10th the
cost of a developed country employee which provides the fuel
Rs psf/year Avergae Capital Values (Rs psf)
to drive the services industry
Higher Capitalization rates implies superior operating margins
High Cap rates, as compared globally, makes it an attractive business
India 8% High Capitalization Rates or operating income yield vis-a-vis
Australia 5%
estate values for Grade A offices is 1.75 – 5.75% higher than
US 5%
other major markets
UK 4%
High cap rates coupled with low capital values gives superior
China 4%
return opportunities for investors in commercial real estate in
Germany 4%
Japan
India
3%
Hong Kong 3%
Singapore 3%
0% 2% 4% 6% 8% 10%
Source: Company, Axis Securities
623 DEC 2018 Company Report
Embassy Office Parks REIT
Macro Drivers: Present in Key Office Markets of India Sector: Commercial Real Estate
Embassy REIT Markets have been leading office absorption Office stock absorption of select global commercial hubs- India Leading
Favorable rental profiles, high cap rates and favorable 60 50%
demographics has led to the highest absorption of Grade A 40
25%
office stocks in last five years as compared to major Grade A 20
office markets in the world 0 0%
Mumbai…
Embassy REIT is present in four key office markets of India (i.e.
Tokyo
Munich
Bengaluru
San Fransisco
London
Pune
Delhi NCR
Beijing
Sydney
Hong Kong
Los Angeles
New York
Singapore
Shanghai
Bengaluru, Pune, Mumbai, NCR) which cover nearly 3/4th of
the total Grade A office market in India
Last 5 year average absorption as % of total stock stood at
35% for Embassy REIT Markets as compared to only 12% for
rest of the major global markets Additionally, office absorption Cumulative Absorption in msf (2013-2018)
in Bengaluru alone is higher than combined absorption of Last 5 years' absorption as a % total stock
Shanghai, Beijing and Hong Kong
Strong Demand-Supply Fundamentals favor a growing rental Embassy REIT properties have a superior demand outlook as
market compared to its markets
40 25%
Embassy REIT’s markets have witnessed strong absorption with
20%
30
limited supply. The average absorption as percentage of supply
15%
20 stood at 99.7%
10%
10
Consequently, vacancy has decline steadily by 540 bps from
5%
CY2014 to CY2019
0 0%
2014 2015 2016 2017 2018 2019E 2020E This trend is likely to continue and will keep demand for Grade
Supply (msf) Absorption (msf) Vacancy (%)
A office space on a strong footing across REIT markets
Source: Company, Axis Securities
723 DEC 2018 Company Report
Embassy Office Parks REIT
Macro Drivers: Superior growth of services sector Sector: Commercial Real Estate
Embassy REIT’s tenant profile is dominated by services sector (contributing to 90% of gross rentals) with technology sector contributing nearly
53% to Gross Rentals. Hence, services sector growth becomes an important proxy parameter for Embassy REITs rental growth
The services sector is the key driver of the Indian economy with contribution of 54% to FY19 GVA (Gross Value Added). Led by technology
and financial services, it has grown by 7.5% in FY19 contributing to 60% of GVA growth. While Technology sector alone has grown by
8.3% in FY19. Below Info graphics present factors that will keep driving demand of services sector
Factors that give a significant advantage to services sector in India Additional Expected Office Demand (in msf) from services sector
(2019-22E)
Services sector is driven by human capital and India 300
Large and has the largest talent pool in the world with with 35% 2
growing, of population in the age bracket of 15-34 years 250
16
English India has been leading new generation technology
Speaking businesses with 8K+ digital solution providers
200 52
talent pool employing ~ 5mn employees (i.e. ~75% of the
global digital talent base.)
150
81
100
Due to lower salary levels and more affordable real
estate, India-based technology services are
Competitive approximately 7 times cheaper compared to the US- 50 102
Cost based technology services
Advantage India’s cost competitiveness has amounted to more 0
than US$ 200 bn in cost savings for clients in the Technology Financial Media and Ent Telecom Pharma R&D
past 5 years Services Network and IT
vendors
Source: Company, Axis Securities
823 DEC 2018 Company Report
Embassy Office Parks REIT
Multiple Growth Factors Sector: Commercial Real Estate
Building new properties
Rental Growth
on vacant areas
Re-leasing of expired RoFO assets:
contracts at mark to First right to sale of
market rate assets by its sponsors
Hospitality and
Lease up of vacant space
other Value added services
Embassy REIT has multiple sources of growth
Source: Company, Axis Securities
923 DEC 2018 Company Report
Embassy Office Parks REIT
Rental Growth ensures revenue growth in all market situations… Sector: Commercial Real Estate
Embassy REIT assets have a built in contractual escalation of 10-15% with its clients every 3-5 year
Embassy REIT focuses on quality assets and best-in-class service and has been able to achieve 270 bps higher rental in FY19 as compared
to market rents
The superior quality of its tenant amenities has also enabled them to achieve an average occupancy of 94% consistently
over FY16-19
Management expects, contractual rent escalations to contribute ~36% of the total increase in revenue from operations over FY20E-21E.
In H1FY20, contractual escalations have contributed to 37% of revenue growth (YoY basis) and will be one of the most consistent sources of
revenue growth every year
Superior rental growth of Embassy REIT portfolio vis-à-vis markets Consistently higher committed occupancy for REIT portfolio
135
130
100%
Occupancy
95%
125
+270 bps 90% +950 bps
120
85%
115
110 80%
105 75%
100 70%
FY2014 FY2015 FY2016 FY2017 FY2018 FY2019 CY2014 CY2015 CY2016 CY2017 CY2018 Q12019
Market Rent Embassy REIT Portfolio Rent Embassy REIT Market
Source: Company, Axis Securities
1023 DEC 2018 Company Report
Embassy Office Parks REIT
Re-leasing at Mark to Market provides ~30% upside Sector: Commercial Real Estate
Due to long dated contracts, typically of more than 7 years, there is an inherent mark to market (MTM) opportunity on expiry of contracts
This would give a revenue boost to Embassy REIT as and when leases come up for expiry and are re-leased at then prevailing market rates
Embassy REIT have re-leased 3.1 msf area at an average spread of ~42% above in place rents from FY2016 to FY2019
5.2 msf area is expected to expire between FY20E to FY23E, with an average re-leasing spread of 30% above in place rents giving a
~10% contribution in revenue growth from re-leasing
Embassy achieved ~42% average re-leasing Leasing-up at market rents on lease 20% of Gross Rent expires between
spread between FY16-19, indicating the managements expiry could provide 30% upside to FY20E–23E, which should contribute
ability to lease-up at market or higher rents on lease expiry revenue as per current rental trends to ~10% revenue growth in 4 years
9% 8.50%
60.70% Gross Rent Expiring
100 8%
Rs 86
80 7%
Rs 66
6%
60 4.90%
35.30% 34.90% 5%
26.60% 40 4% 3.50% 3.30%
8.5 20
49 3%
2%
0
1%
0%
In-Place Rent Market Rent FY2020E FY2021E FY2022E FY2023E
FY2016 FY2017 FY2018 FY2019
Year FY16 FY17 FY18 FY19 Year FY20E FY21E FY22E FY23E
Area Re-leased (in msf) 0.3 1.1 0.5 1.2 MTM upside 50% 16% 65% 49%
Source: Company, Axis Securities
1123 DEC 2018 Company Report
Embassy Office Parks REIT
De-risked New Leases minimizes vacancy risks… Sector: Commercial Real Estate
Embassy REIT’s new properties have shown de-risked development with high pre-leasing trend
Embassy REIT has a vacant space of about 8 msf, which it has plans to build and lease up in the coming years
Embassy management focuses on de-risked brownfield expansion on existing land by pre-leasing properties ahead of development. For
example Embassy Oxygen, which completed in Nov’ 18, was 92% pre leased.
Approximately, 2.3 msf is at various stages of development (see chart below) and is expected to complete by FY22E. Of this 1.4 msf of office
development is tracking two quarters ahead of schedule due to strong demand from tenants.
Pre-leasing trends in the upcoming (1.4 msf space) have also shown strong traction with c23% already pre-leased.
Further, development work has already started in Embassy Manyata (1 msf) and Embassy Techzone (0.9 msf) ahead of schedule.
Development history; schedule – Tracking ahead of plan Filling up of vacant office space is near term priority for Embassy
1.6 Embassy REIT’s 5% vacancy is concentrated in three properties,
1.4 msf
1.4 development namely Embassy Techzone in Pune (~13% vacancy), Embassy
1.2 tracking ahead of Oxygen in Noida (~15% vacancy) and FIFC in Mumbai (~22%
schedule
1 vacancy).
(msf)
0.8
1.4
0.6 1.3 The high vacancy is because these buildings are either
0.4 0.9 0.8 0.9 constructed recently (Embassy Oxygen) or there is a transitory
0.6
0.2 0.5 vacancy due to upgrades and repositioning
0
FY2014 FY2016 FY2018 FY2019 FY2020E FY2021E FY2022E This is expected to be leased up in the next year and a half and
would provide ~ Rs 110 cr of revenue increase in FY19-21.
Manyata Oxygen Techzone
Sources: Company, Axis Securities
1223 DEC 2018 Company Report
Embassy Office Parks REIT
Significant Greenfield Expansion scope and focus on Value Added Services… Sector: Commercial Real Estate
ROFO assets give long term growth visibility with 43 msf area identified for expansion
Embassy REIT has a Right of First Offer (ROFO) on assets owned by Embassy Sponsors. This gives them opportunity to expand to new markets
and diversify geographically
They have identified 4 such properties in Chennai (1) and Bengaluru (3) totaling an area of 43 msf
In Q2FY20, Embassy REIT received a ROFO notice for Embassy TechVillage in Bengaluru. This consists of 6.2 msf of completed area which
already has tenants in place and has 2.5 msf of under construction area
If the ROFO asset proves to be yield accretive (current yield ~5.6%) for REIT unit holders, management will go ahead and acquire the property.
Management discussed that they have a lower cost of equity v/s cost of debt and will find the optimum mix to invest in this property
We estimate that this acquisition, if materializes, could add to 20-25% to its NOI. We believe such regular acquisition of assets through ROFO
opportunities will keep boosting the unit price of stock. We have not accounted for ROFO acquisition impact in our estimates
Focus on Value Added Services and Best-in-Class facilities
Embassy REIT focuses on superior tenant experience through
value added services
Two revenue generating VAS sources are 1) Hotels 2) Solar
Power
Hilton at Embassy Golflinks (with 72% occupancy) and Four
Seasons at Embassy One (completed May 2019) together
have 477 keys
Embassy REIT plans to add 619 keys more to its portfolio for
business executives comfortable stay in FY22E
Add-on services and others contributed 26% to revenue growth
in H1FY20, on a YoY basis Hilton at Embassy Golflinks, 247 Keys, Five Solar Plant with 100 MW capacity serving
star property with 72% average occupancy Bengaluru properties
Sources: Company, Axis Securities
1323 DEC 2018 Company Report
Embassy Office Parks REIT
Global Tenant profile with long term “stickiness” Sector: Commercial Real Estate
Sector Mix Gross Rentals (%) and Top tenants
Embassy REIT’s cash flows are backed by marquee tenant base
that have stayed with Embassy REIT for long periods of time. Some
Others
key highlights of the tenant profile are: 10%
Telecom
165 multinational tenants of the highest quality 5%
Technology
Healthcare 53%
45% Rental from Fortune 500 Companies 6%
Top 10 Companies contribute 43% to Gross Revenues. Retail
7%
Achieved same store rental CAGR of ~7% in 2016-2019
Research,
Consulting &
Tenant Retention rate of 78% implies that most tenants want to
Analytics
8%
continue with Embassy REIT.
Financial
A weighted average lease expiry of 7.2 years for the portfolio Services
11%
implies stability of revenue for the foreseeable future
Since tenants typically undertake significant Tenant
Improvement capex at their own expense in India, often
equivalent to 4-7 years of rent, they have significantly higher
“stickiness” due to high moving costs.
Sources: Company, Axis Securities
1423 DEC 2018 Company Report
Embassy Office Parks REIT
A notch above competitors across Asia… Sector: Commercial Real Estate
A comparison with REIT’s in the Asian markets clearly shows that Embassy REIT has higher dividend yield of 6-7% v/s other REIT’s yield
around or below 5% mark.
Another important differentiator is the significant revenue growth outlook for Embassy REIT as compared to its peers. CAGR Growth for
Embassy REIT in FY19-22E is expected to be 16.3% with long term growth pegged at above 10% whereas for other REITs it is around 5%.
Embassy REIT’s NOI margin profile of 85% is one of the best among REITs globally and nearly 10% higher than Ascendas India Trust which
also operates in Indian office space.
Debt to TEV (Total Equity Value) of Embassy REIT at ~11% (leverage ratio) is the lowest among global REITs, with averages ranging from
18% for US based REITs to 37% in European REITs. This also gives significant headroom to raise capital for growth.
Embassy REIT’s comparison on key metrics with Asian Peers
Revenues
Total Area NOI Margin CAGR Growth Div Yield %
REIT Name Country (in mn $) EV/EBITDA
(msf) (FY2020E)) % (FY19-22E) (FY20E)
(FY20E) (FY20E)
Ascendas India Trust Singapore 18.2 702 75% 3.5 5.59 15.89
Capitaland Singapore 3.9 298 71% 1.9 4.57 19.90
Champion REIT Hong Kong 2.9 417 84% 5 4.41 18.57
Keppel REIT Singapore 3.7 126 65% 2.4 4.60 74.33
Embassy Office Parks REIT India 33 314 85% 16.3 6.5 19.1
Suntec REIT Singapore 3.9 277 80% 1.5 5.04 35.50
Source: Consensus, Reuters, Axis Securities
1523 DEC 2018 Company Report
Embassy Office Parks REIT
Highly experienced Management and Board Sector: Commercial Real Estate
Michael Holland Vikaash Khdloya Bhhavesh Kamdar Sachin Shah Anuj Puri Dr. Punita Kumar Sinha
CEO Deputy CEO / COO President, Leasing CIO Independent Independent Board
Board Member Member
20+ Years Experience 11+ Years Experience 26+ Years Experience 17+Years Experience 30+Years Experience 30 +Years Experience
Former Country Former Former Deputy Key person of Group Chairman Portfolio manager,
Manager and MD,Blackstone Real General Manager – Samsara Fund and founder of Oppenheimer Asset
Managing Director Estate Leasing and Advisors Private ANAROCK Management
of JLL India Former VP at Marketing Limited Board member of CFA charter holder,
Former CEO of PiramalFund (Commercial) at Former VP of Jagran Prakash and served on the
Assetz Property Management Larsen & Toubro Acquisitions at Limited, Music Board of Governors
(erstwhile IndiaREIT) Starwood Capital Broadcast Limited, for CFA Institute
ANAROCK
Investment advisor
Sources: Company, Axis Securities
1623 DEC 2018 Company Report
Embassy Office Parks REIT
Strong Sponsors: Perfect combination of global and Local Expertise Sector: Commercial Real Estate
Extensive expertise with One of the world’s
area developed across 54+ msf $153.6 bn largest real estate
south western India, Serbia, (AUM) investors in Real Estate
Eastern Europe and across equity and debt.
Malaysia.
The team consists of
Experience of end to end 527 over 527 real estate
commercial development
right from land
25+ Years EMBASSY professionals, professionals
11 offices in 11 offices around the
identification to building the OFFICE PARKS globe which manage the
property to marketing and
selling the property best and biggest real
estate projects
Holds an extensive land
bank of 1,000+ acres
across the country ensuring 1000 + 50 mn sqft Largest owner of Class A
supply of land will not be a office space in India,
hindrance.
acres with a portfolio spanning
. across key office markets
and IT hubs.
Source: Company, Embassy Group, Blackstone LLP, Axis Securities
1723 DEC 2018 Company Report
Embassy Office Parks REIT
Assets Profile, Metrics - Bengaluru Sector: Commercial Real Estate
Embassy Manyata- 14.2 msf
Rs 16,800 Cr 52% ~60%
Gross Asset Value GAV of total portfolio Of Total Gross Rentals
17.2 msf 68 Rs/psf pm 42%
Total Area In place rent MTM upside
97.1% 8.2 years ~10.3%
Embassy One - 0.3 msf Embassy Golflinks-2.7 msf
Occupancy WALE Last five year
Rental CAGR
Market Outlook and Growth Drivers (FY19-22E)
Leader in office absorption globally
Healthy hiring and abundant availability of talent
Improved connectivity with rapidly developing metro
Competitive and quality office with limited supply
Sources: Company, Axis Securities
1823 DEC 2018 Company Report
Embassy Office Parks REIT
Assets Profile, Metrics - Mumbai Sector: Commercial Real Estate
FIFC - 0.4 msf
Rs 5,076 Cr 16% ~18%
Gross Asset Value GAV of total portfolio of Total
Gross Rentals
2 msf 165 Rs/psf pm 5%
Total Area In place rent MTM upside
Express towers - 0.5 msf Embassy 247 -1.2 msf
90.5% 4.6 years ~ -1.3%
Occupancy WALE Last five year
Rental CAGR
Market Outlook and Growth Drivers (FY19-22E)
Global financial and legal services hub
9% vacancy in REIT markets implies ample opportunity
Limited supply with re-kindling of demand in sub-markets
Improved connectivity with developing metro
Sources: SEBI, Company, Axis Securities
1923 DEC 2018 Company Report
Embassy Office Parks REIT
Assets Profile, Metrics - Pune Sector: Commercial Real Estate
Embassy Quadron- 1.9 msf
Rs 4,590 Cr 14% ~14%
Gross Asset Value GAV of Of Total
total portfolio Gross Rentals
8.8 msf 42 Rs/psf pm
15%
Embassy Techzone - 5.5 msf Total Area In place rent MTM upside
92.1% 5.8 years ~ 7.5%
Occupancy WALE Last five year
Rental CAGR
Embassy Qubix-1.5 msf
Market Outlook and Growth Drivers (FY19-22E)
Hub of SEZ’s around Pune provide for high office demand
Abundant availability of technically savvy talent
Rapid infrastructure development and seamless connectivity
Low property prices with ample space to grow
Sources: Company, Axis Securities
2023 DEC 2018 Company Report
Embassy Office Parks REIT
Assets Profile, Metrics – Delhi NCR Sector: Commercial Real Estate
Embassy Oxygen - 3.3 msf
Rs 2,957 Cr 9% ~8%
Gross GAV of Of Total
Asset Value total portfolio Gross Rentals
4.6 msf 40 Rs/psf pm 28.6 %
Total Area MTM upside
In place rent
91.3% 8 years ~ 10%
Embassy Galaxy - 1.4 msf
Committed WALE Last five year
occupancy Rental CAGR
Market Outlook and Growth Drivers (FY19-22E)
Near the capital of India, with multiple MNC headquarters
Healthy hiring and abundant availability of talent
Top class connectivity through roadways and metro
Competitive and quality office with SEZ benefits
Sources: Company, Axis Securities
2123 DEC 2018 Company Report
Embassy Office Parks REIT
Solid H1FY20 Performance with focus on growth and distribution… Sector: Commercial Real Estate
17% growth with 99.5% of NDCF payout to unit holders Leasing Highlights of H1FY20 – Long contracts at high spreads
H1FY20 H1FY19 % change New Lease Analysis H1FY20
Embassy Office Parks REIT
(in Rs cr) (in Rs cr) YoY
Total Lease-up Area (msf) 1.19
Revenue from Operations 1055.7 898.6 17%
Area Re-leased (msf) 0.89
Property Tax and Insurance -35.8 -34.4
Re-leasing Spread (%) 66.50%
Direct Operating Expense -128.7 -108.6
Net Operating Income 891.2 755.6 18% New Leasing to Existing Portfolio Tenants 75.90%
Other Income 44.2 84.9 WALE on new lease-up (years) 9.3
Property Management Fees -23.4 -16.0 Renewal Analysis H1FY20
Indirect operating Expenses -35.3 -55.5 Area Renewed (msf) 0.307
EBITDA 876.7 769.0 14%
Renewal spread (%) 22.10%
Working Capital Adjustment 110.2 -23.6
Cash Taxes -68.2 -100.9 Key Tenant Additions H1FY20 – Quality on focus
Other Adjustments -59.0 -77.2 Tenant Asset City Area (msf)
HCL Embassy Techzone Pune 0.236
Cash Flow from Operations 859.7 567.3 52% NTT Data Embassy Golflinks 0.205
Bengaluru
NDCF at SPV level after Debt Repayment 805.1 Infosys BPM Embassy Techzone Pune 0.128
Distribution from SPV to REIT 799.8 L&T Infotech Embassy Techzone Pune 0.128
Facebook Embassy Golflinks Bengaluru 0.104
Distribution from Embassy Golflinks 96.0
Google India FIFC Mumbai 0.061
REIT Management Fees -10.3 Dell Embassy Golflinks Bengaluru 0.054
Other Inflows at REIT level -1.3 NTT Data Embassy Oxygen Noida 0.053
Access Healthcare Embassy Techzone Pune 0.044
NDCF at REIT Level 884.2
The Executive Centre FIFC Mumbai 0.022
Payout Ratio Multiple Multiple Multiple 0.155
Distribution 879.7
99.5% Total Area Leased 1.19
Source: Company, Axis Securities
2223 DEC 2018 Company Report
Embassy Office Parks REIT
Valuation Sector: Commercial Real Estate
Valuation
We have used a balance sheet based 10-year DCF valuation and a cap rate based terminal value to allow for cash flow stabilization to
arrive at a target price of Rs 495. The details of assumptions built-in are as below. Also, ROFO acquisitions can provide considerable upside
to value of stock not built into the valuations.
Key Assumptions Growth Drivers
Revenue CAGR Growth Next 3 Years 16.3% Metric FY 19 FY 20E FY 21E FY 22E
Revenue Growth 3 to 10 Years 10% NOI Growth - 20% 16% 13%
WACC 11.3% Occupancy 94% 95% 96% 97%
Capitalization Rate 6.5% Rentals (in Rs/psf) 63 67 71 75
Rental CAGR (FY19-22E) is 5.81% while inflation is expected to remain lower than this level implying rental
growth to protect against inflation.
Key Risks
Tenant concentration risk: Tenants in the technology and financial services sector amount to ~64% of gross rentals and any adverse impact
on these sectors will impact Embassy REIT.
Property Concentration Risk: High revenue concentration remains in one integrated office parks (~41% of revenue from operations from one
Bengaluru property: Embassy Manyata). Any impact on Embassy Manyata will impact overall performance significantly.
Inability to lease at market prices: Leasing & rental growth depends on supply-demand conditions in micro-markets, portfolio attractiveness
and landlord reputation among other factors. Any impact on these, will affect growth adversely.
Regulatory Changes: Any adverse alterations on taxation of interest and dividends will have an impact on company’s operations and return
expectations of investors.
Source: Company, Axis Securities
2323 DEC 2018 Company Report
Embassy Office Parks REIT
Financials Sector: Commercial Real Estate
Profit & Loss (Rs Cr) Balance Sheet (Rs Cr)
Y/E March FY19 FY20E FY21E FY22E Y/E March FY19 FY20E FY21E FY22E
Net sales 1,877 2,304 2,611 2,956
Total assets 36,695 33,288 33,551 33,724
Other operating income 154 138 157 177
Net Block 21,084 21,435 21,642 21,732
Total income 2,031 2,443 2,768 3,134
CWIP 122 125 128 132
Cost of goods sold 517 592 621 704 Investments 1,499 1,282 1,419 1,400
Contribution (%) 72.4% 74.3% 76.2% 76.2%
Wkg. cap. (excl cash) 4,961 795 399 335
Cash / Bank balance 329 329 329 329
Operating Profit 1,514 1,851 2,146 2,430
PBIDT 1,514 1,851 2,146 2,430 Other Non Current Assets 8,699 9,322 9,634 9,796
Depreciation 356 550 592 611
Capital employed 36,695 33,288 33,551 33,724
Interest & Fin Chg. 706 370 434 507
Equity capital 22,904 22,904 22,904 22,904
E/o income / (Expense) 115 138 157 177
Pre-tax profit 567 1,070 1,277 1,490 Reserves (9) (791) (1,585) (2,382)
Tax provision 201 134 198 246 Pref. Share Capital 0.0 0.0 0.0 0.0
Associates 0 0 0 0
Current Liabilities 2,512 2,545 2,767 2,826
Other Comprehensive Income 0.1 0.0 0.0 0.0
Borrowings 7,146 4,234 4,908 5,679
Adjusted PAT 291 815 947 1,096
Reported PAT 365 936 1,079 1,244 Def tax Liabilities 4,142 4,397 4,557 4,697
Source: Company, Axis Securities
2423 DEC 2018 Company Report
Embassy Office Parks REIT
Financials Sector: Commercial Real Estate
Cash Flow (Rs Cr) Ratio Analysis (%)
Y/E March FY19 FY20E FY21E FY22E
Y/E March FY19 FY20E FY21E FY22E
Revenue Growth 16.5 22.8 13.3 13.2
Profit before income tax 567 1,070 1,277 1,490
Depreciation and amortisation OPM 74.5 75.8 77.5 77.5
356 550 592 611
expense Oper. profit growth 11.3 22.3 16.0 13.2
Net change in Working COGS / Net sales 27.6 25.7 23.8 23.8
16 (75) (82) (92)
Capital Depreciation / G. block 1.7 2.5 2.6 2.6
Income taxes paid, net (186.3) (133.7) (197.9) (245.8) Effective interest rate 9.4 6.7 10.3 10.2
Cash flows from operating EBITDA Margin (%) 75.8 77.5 77.5
1,239.5 1,512.6 1,737.2 1,962.6
activities Debt/Equity (x) 0.17 0.17 0.20 0.23
Interest Coverage (x) 2.1 5.0 4.9 4.8
Capex (462) (629) (529) (429)
Cash flow from investing RoE 2.8 4.2 5.0 5.9
106 (679) (501) (250)
activities
Debt / equity (x) 0.17 0.17 0.20 0.23
Equity Issued/(Bought back) 4,750 0 0 0 Effective tax rate 35.5 12.5 15.5 16.5
Debt Raised/(Repaid) (460) (2,912) 674 771 RoA 1.6 2.9 3.5 4.0
Dividends Paid 0.0 (1,717.8) (1,872.4) (2,040.9) Payout ratio (Div/NP) 0.0 183.6 173.5 164.1
Cash flow from financing
3,472.5 (4,999.6) (1,632.2) (1,776.8)
activities EPS (Rs.) 4.8 12.3 14.1 16.3
Net increase/ (decrease) in CEPS (Rs.) 9.5 19.5 21.9 24.3
4,817.6 (4,166.0) (396.2) (64.0)
cash and cash equivalents DPS (Rs.) 0.0 22.5 24.5 26.7
Source: Company, Axis Securities
25Appendix
23 DEC 2018 Company Report
Embassy Office Parks REIT
Historical Performance of REIT and correlation with Interest Rates… Sector: Commercial Real Estate
REIT as an asset class has been in existence for over 5 One common misnomer that we have come across is that
decades in the US. So we have looked at US based Equity REIT’s rise only in periods of falling interest rates when debt
REIT returns to understand how REIT’s have performed as investments become unattractive and underperform during
compared to other broad equity markets over long periods of periods of rising interest rates. We therefore again looked US
time. REIT returns during rising interest rates.
Returns (%) REITs in a Rising Interest Rate Environment
Dow Jones
FTSE Nareit Nasdaq
Period S&P 500 Industrials Russell 2000
All Equity REITs Composite
Average
10-Year 13.3 13.44 13.3 12.38 16.3
15-Year 8.65 9.03 9.57 7.93 9.92
20-Year 11.74 6.2 7.38 8.02 4.89
25-Year 11.18 10.15 8.39 9.34 10.28
30-Year 10.75 9.94 8.11 9.4 10.31
The above table represents 10-year to 30-year annualized
returns data for broad based equities and REITS, till Nov 2019
REITS have outperformed all broad equity markets be it small The above table looks at a period of 2004 – 2007 where fed
cap, large cap or multi-cap in 20-year and above periods and funds target rate increased from 1% to 5%.
have given comparable returns in 10-year and 15-year During the same period REIT’s gave a cumulative return of more
periods ~80% while S&P 500 gave a return of ~37%.
Over very long term investment in REIT’s can be real Wealth Other samples also indicate that REIT’s may be volatile to rising
creators even better than equities!! interest rates but generally rise with rising interests
Source: NAREIT, Axis Securities
2723 DEC 2018 Company Report
Embassy Office Parks REIT
Structure of REIT and role of various players; Taxation Sector: Commercial Real Estate
The REIT manager sets and
Taxation
Tax is charged at the hands
executes the strategic direction
of the REIT according to its UNIT HOLDERS Investors will own of the Unit holders and is
stated investment strategy. For Units of REIT a pass through at REIT
instance, it is responsible for and SPV levels
the acquisition and divestment Owns
Distributions
of the REIT’s properties Units
Management Acts on
Services
of REIT
behalf of Unit SPV
Holders
REIT TRUSTEE
MANAGER Management
Dividend Income – No Tax
Trustee Fees
Fees Interest Income – No Tax
Appoints Owns Property
property Income The trustee is responsible
Property Manager Other Income – Taxable
for holding the assets of the
REIT on behalf of unit
PROPERTY PROPERTIES holders REIT
Other duties include
MANAGER Property
ensuring compliance with
Management
Services all applicable laws and Dividend Income# – No Tax
Buy/Sell
protecting certain rights of
Properties
unit holders Interest Income* – Taxable
The property manager’s
responsibility includes renting
Other Income – Exempt
out the property to achieve the SPONSORS
best tenancy mix and rental
income, to run marketing events Unit Holders
or programs to attract
shoppers/tenants and to Sponsor source the properties that
upkeep the property are injected into the initial portfolio of * Investors have to pay 1) Withholding
the REIT and may continue to provide tax @ 5% for foreign investors and 10%
a pipeline of assets for the REIT for domestic investors on interest income
Sponsors typically owns both REIT 2) Tax on income from interests as part of
and Property manager and have income tax at applicable marginal tax
significant stake in REIT rates
# Dividend distribution tax applicable
above Rs 10L of dividend income
Sources: SEBI, Company, Axis Securities
2823 DEC 2018 Company Report
Embassy Office Parks REIT
Disclaimer Sector: Commercial Real Estate
Disclosures:
The following Disclosures are being made in compliance with the SEBI Research Analyst Regulations 2014 (herein after referred to as the Regulations).
1. Axis Securities Ltd. (ASL) is a SEBI Registered Research Analyst having registration no. INH000000297. ASL, the Research Entity (RE) as defined in the Regulations, is engaged in the business of
providing Stock broking services, Depository participant services & distribution of various financial products. ASL is a subsidiary company of Axis Bank Ltd. Axis Bank Ltd. is a listed public
company and one of India’s largest private sector bank and has its various subsidiaries engaged in businesses of Asset management, NBFC, Merchant Banking, Trusteeship, Venture Capital,
Stock Broking, the details in respect of which are available on www.axisbank.com.
2. ASL is registered with the Securities & Exchange Board of India (SEBI) for its stock broking & Depository participant business activities and with the Association of Mutual Funds of India (AMFI) for
distribution of financial products and also registered with IRDA as a corporate agent for insurance business activity.
3. ASL has no material adverse disciplinary history as on the date of publication of this report.
4. I/We, Ankit Suchanti, PGDM IIML author/s and the name/s subscribed to this report, hereby certify that all of the views expressed in this research report accurately reflect my/our views about the
subject issuer(s) or securities. I/We (Research Analyst) also certify that no part of my/our compensation was, is, or will be directly or indirectly related to the specific recommendation(s) or view(s)
in this report. I/we or my/our relative or ASL does not have any financial interest in the subject company. Also I/we or my/our relative or ASL or its Associates may have beneficial ownership of
1% or more in the subject company at the end of the month immediately preceding the date of publication of the Research Report. Since associates of ASL are engaged in various financial service
businesses, they might have financial interests or beneficial ownership in various companies including the subject company/companies mentioned in this report. I/we or my/our relative or ASL or
its associate does not have any material conflict of interest. I/we have not served as director / officer, etc. in the subject company in the last 12-month period.
Any holding in stock – No
5. ASL has not received any compensation from the subject company in the past twelve months. ASL has not been engaged in market making activity for the subject company.
6. In the last 12-month period ending on the last day of the month immediately preceding the date of publication of this research report, ASL or any of its associates may have:
i. Received compensation for investment banking, merchant banking or stock broking services or for any other services from the subject company of this research report and / or;
ii. Managed or co-managed public offering of the securities from the subject company of this research report and / or;
iii. Received compensation for products or services other than investment banking, merchant banking or stock broking services from the subject company of this research report;
ASL or any of its associates have not received compensation or other benefits from the subject company of this research report or any other third-party in connection with this report.
Term& Conditions:
This report has been prepared by ASL and is meant for sole use by the recipient and not for circulation. The report and information contained herein is strictly confidential and may not be altered in
any way, transmitted to, copied or distributed, in part or in whole, to any other person or to the media or reproduced in any form, without prior written consent of ASL. The report is based on the
facts, figures and information that are considered true, correct, reliable and accurate. The intent of this report is not recommendatory in nature. The information is obtained from publicly available
media or other sources believed to be reliable. Such information has not been independently verified and no guaranty, representation of warranty, express or implied, is made as to its accuracy,
completeness or correctness. All such information and opinions are subject to change without notice. The report is prepared solely for informational purpose and does not constitute an offer document
or solicitation of offer to buy or sell or subscribe for securities or other financial instruments for the clients. Though disseminated to all the customers simultaneously, not all customers may receive this
report at the same time. ASL will not treat recipients as customers by virtue of their receiving this report.
Instead of a company visit, we have done a conference call with the company’s management.
2923 DEC 2018 Company Report
Embassy Office Parks REIT
Disclaimer Sector: Commercial Real Estate
DEFINITION OF RATINGS
Ratings Expected absolute returns over 12-18 months
BUY More than 10%
HOLD Between 10% and -10%
SELL Less than -10%
NOT RATED We have forward looking estimates for the stock but we refrain from assigning valuation and recommendation
UNDER REVIEW We will revisit our recommendation, valuation and estimates on the stock following recent events
NO STANCE We do not have any forward looking estimates, valuation or recommendation for the stock
Disclaimer:
Nothing in this report constitutes investment, legal, accounting and tax advice or a representation that any investment or strategy is suitable or appropriate to the recipient’s specific circumstances. The securities and strategies
discussed and opinions expressed, if any, in this report may not be suitable for all investors, who must make their own investment decisions, based on their own investment objectives, financial positions and needs of specific
recipient.
This report may not be taken in substitution for the exercise of independent judgment by any recipient. Each recipient of this report should make such investigations as it deems necessary to arrive at an independent evaluation of
an investment in the securities of companies referred to in this report (including the merits and risks involved), and should consult its own advisors to determine the merits and risks of such an investment. Certain transactions,
including those involving futures, options and other derivatives as well as non-investment grade securities involve substantial risk and are not suitable for all investors. ASL, its directors, analysts or employees do not take any
responsibility, financial or otherwise, of the losses or the damages sustained due to the investments made or any action taken on basis of this report, including but not restricted to, fluctuation in the prices of shares and bonds,
changes in the currency rates, diminution in the NAVs, reduction in the dividend or income, etc. Past performance is not necessarily a guide to future performance. Investors are advice necessarily a guide to future performance.
Investors are advised to see Risk Disclosure Document to understand the risks associated before investing in the securities markets. Actual results may differ materially from those set forth in projections. Forward-looking statements
are not predictions and may be subject to change without notice.
ASL and its affiliated companies, their directors and employees may; (a) from time to time, have long or short position(s) in, and buy or sell the securities of the company(ies) mentioned herein or (b) be engaged in any other
transaction involving such securities or earn brokerage or other compensation or act as a market maker in the financial instruments of the company(ies) discussed herein or act as an advisor or investment banker,
lender/borrower to such company(ies) or may have any other potential conflict of interests with respect to any recommendation and other related information and opinions. Each of these entities functions as a separate, distinct
and independent of each other. The recipient should take this into account before interpreting this document.
ASL and / or its affiliates do and seek to do business including investment banking with companies covered in its research reports. As a result, the recipients of this report should be aware that ASL may have a potential conflict of
interest that may affect the objectivity of this report. Compensation of Research Analysts is not based on any specific merchant banking, investment banking or brokerage service transactions. ASL may have issued other reports
that are inconsistent with and reach different conclusion from the information presented in this report.
Neither this report nor any copy of it may be taken or transmitted into the United State (to U.S. Persons), Canada, or Japan or distributed, directly or indirectly, in the United States or Canada or distributed or redistributed in
Japan or to any resident thereof. If this report is inadvertently sent or has reached any individual in such country, especially, USA, the same may be ignored and brought to the attention of the sender. This report is not directed or
intended for distribution to, or use by, any person or entity who is a citizen or resident of or located in any locality, state, country or other jurisdiction, where such distribution, publication, availability or use would be contrary to
law, regulation or which would subject ASL to any registration or licensing requirement within such jurisdiction. The securities described herein may or may not be eligible for sale in all jurisdictions or to certain category of
investors.
The Disclosures of Interest Statement incorporated in this document is provided solely to enhance the transparency and should not be treated as endorsement of the views expressed in the report. The Company reserves the right
to make modifications and alternations to this document as may be required from time to time without any prior notice. The views expressed are those of the analyst(s) and the Company may or may not subscribe to all the views
expressed therein.
Copyright in this document vests with Axis Securities Limited.
Axis Securities Limited, Corporate office: Unit No. 2, Phoenix Market City, 15, LBS Road, Near Kamani Junction, Kurla (west), Mumbai-400070, Tel No. – 022- 40508080 / 022 - 61480808, Regd. off.- Axis House, 8th Floor,
Wadia International Centre, Pandurang Budhkar Marg, Worli, Mumbai – 400 025. Compliance Officer: Anand Shaha, Email: compliance.officer@axisdirect.in, Tel No: 022-42671582.
30You can also read