INVESTOR PRESENTATION - GIBSON ENERGY
←
→
Page content transcription
If your browser does not render page correctly, please read the page content below

GIBSON ENERGY
I N V E S T O R P R E S E N TAT I O N
MAY 2021
Company Snapshot
                                      Continue to build a leading oil-focused infrastructure business

                                                                                                                        TOUCH
                                                        GEI
GIBSON ENERGY INVESTOR PRESENTATION

                                                                                      $4.6B                              1 IN 4
                                                                                                                       BARRELS
                                                        TSX                        ENTERPRISE                           IN THE
                                                      LISTED                        VALUE ( 1)                           WCSB

                                                                     #1                                    A-
                                                                   RANKED                       2020 CDP SCORE

                                                                    ESG SCORE                   HIGHEST AMONG
                                                                     IN PEER                      DIRECT PEER
                                                                     GROUP ( 2)                      GROUP

                                                      ~90%
                                                 TERMINALS                                                              ~80%
                                               REVENUE FROM                         S&P: BBB-                     TAKE-OR-PAY /
                                                INVESTMENT                                                         STABLE FEE -
                                                   GRADE                      DBRS: BBB (low)                    BASED EBITDA ( 3)
                                              COUNTERPARTIES

                                                                      ~6.2%
                                                                    YIELD ON
                                                                                                         10%
                                                                  $1.40/SHARE                    TARGET DCF PER
                                                                    ANNUAL                       SHARE GROWTH
                                                                   DIVIDEND ( 1)

                                      (1) Based on April 30, 2021 closing price of $22.45 per share, Net Debt (defined as Total Debt Outstanding in the Q1 2021 MD&A, less liability component of Convertible Debentures, Hybrid capital, Cash and Cash
                                          Equivalents and Unamortized Issue Discount and Debt Issue Costs) and Gibson’s current dividend. Dividends are not guaranteed and are payable at the discretion of the Board. See “Risk Factors” in Gibson’s
                                          Annual Information Form.
                                      (2) Calculated as average Bloomberg, MSCI and Sustainalytics ESG Ratings rank vs. direct peers as at April 30, 2021.
        2                             (3) Based on 2020 Consolidated Adjusted EBITDA; ~20% of 2020 take-or-pay Infrastructure revenues and 35% of 2020 total Infrastructure revenues were intercompany.
                                      Note: This and subsequent slides contain non-GAAP measures and forward-looking statements – Please refer to the Forward-Looking Statements notice on slide 29.
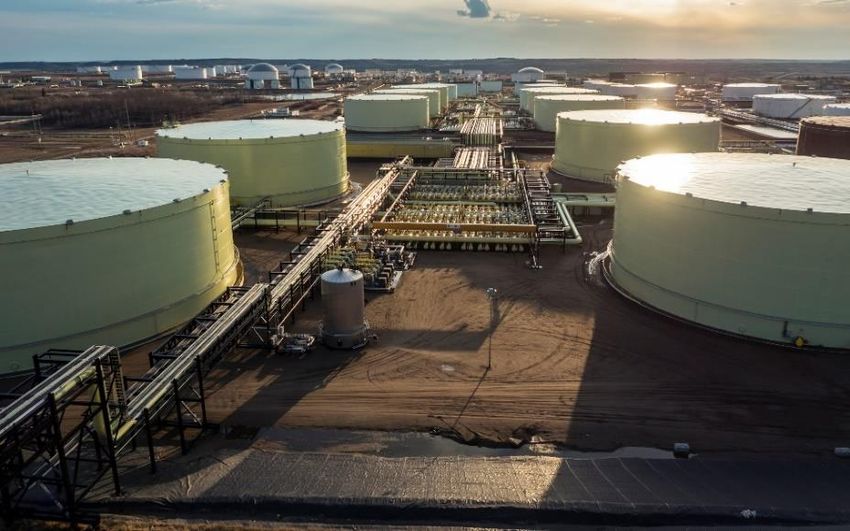
Oil Infrastructure Focused
                                      ~70% of 2020E Consolidated Adjusted EBITDA from core Terminals and ~80% Infrastructure
GIBSON ENERGY INVESTOR PRESENTATION

                                                                                                                                                 ~80% Infrastructure
                                                                                                                                                    ~70% Terminals
                                                         EDMONTON                         HARDISTY
                                                          TERMINAL                        TERMINAL
                                                            1.7 MMBBL                       13.5 MMBBL
                                                       E XISTIN G STORAGE               E XISTIN G STORAGE
                                                                                                                                                2020
                                             MOOSE                              DRU                                                          Adj. EBITDA
                                              JAW                         50 KBBL/D OF                                                       Breakout(1)
                                                                         IN LE T CAPACITY
                                          ~22 KBBL/D
                                                                               UN DE R
                                       CURRE NT CAPACITY
                                                                         CON STRU C TIO N                    Hardisty Terminal ~55%
                                                                                                             Edmonton ~15%
                                                                                                             Canadian & U.S. Pipelines ~5%
                                                                                                             Other Infrastructure ~5%
                                                                                                             Marketing ~20%
        3                             (1) Based on 2020 Consolidated Adjusted EBITDA.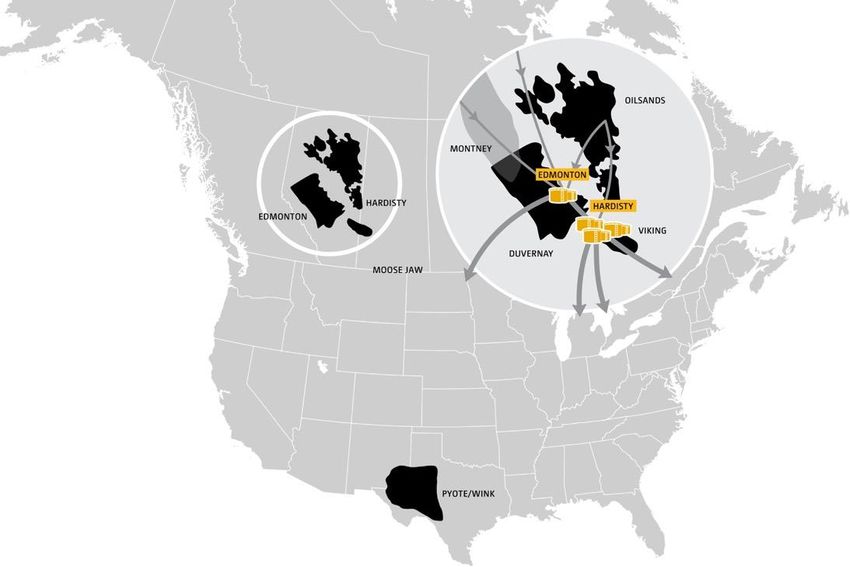
Focused Strategy
                                      Premier oil infrastructure assets to underpin DCF per share and dividend growth
                                                    Leverage Terminals Position                                                                                                           Complimentary Growth
GIBSON ENERGY INVESTOR PRESENTATION

                                      ▪ Terminals represent ~70% of                                                                                                         ▪ Target deploying $150 – $200mm in
                                        Consolidated Adjusted EBITDA(1)                                                                Oil                                    Infrastructure capital per year
                                      ▪ Dominant market position at Hardisty                                                     Infrastructure                               ▪ $200mm capital target in 2021
                                                                                                                                      Focus                                 ▪ Balanced approach to sanctioning
                                      ▪ Continue to target sanctioning 2 – 4
                                        tanks per year on a run-rate basis, with                                                                                              additional capital in current
                                        bias currently to lower end                                                                                                           environment
                                                                                                                                                                              ▪ Will not reduce return
                                      ▪ Potential for additional DRU phases                                                                                                      thresholds to boost growth
                                                                                                                             Target ~10% DCF
                                                           Quality Cash Flows                                                per Share Growth                                               Strong Balance Sheet
                                      ▪ ~80% of Consolidated Adjusted EBITDA                                                                                                ▪ Net Debt / Consolidated Adjusted
                                        from the Infrastructure segment(1)                                                                                                    EBITDA of 3.1x at Q1 2021, relative
                                        ▪ Infrastructure-only payout ratio of                                                                                                 to 3.0x – 3.5x target(4)
                                           75% at Q1 2021(2)                                                                  Secure, Growing                               ▪ Fully-funded for all sanctioned
                                      ▪ ~80% of Consolidated Adjusted EBITDA                                                     Dividend                                     capital, with internal funding
                                        from stable, long-term take-or-pay or                                                                                                 capacity well in excess of 2021
                                        fee-for-service contracts(1,3)                                                                                                        growth capital spend

                                      ▪ Terminals Adjusted EBITDA ~90% from                                                                                                 ▪ Investment grade credit ratings from
                                        Investment Grade counterparties                                                                                                       S&P: BBB– and DBRS: BBB (low)
                                      (1) Based on 2020 Consolidated Adjusted EBITDA.
                                      (2) Infrastructure-only Payout is calculated as Dividends over Infrastructure DCF (Infrastructure Adjusted EBITDA less G&A, Interest and Maintenance Capital).
                                      (3) Take-or-pay intercompany contracts currently represent approximately 20% of Infrastructure revenues, with the proportion expected to decline over time.
        4                             (4) Calculated as Net Debt (defined as Total Debt Outstanding in the Q1 2021 MD&A, less liability component of Convertible Debentures, Hybrid capital, Cash and Cash Equivalents and Unamortized Issue
                                          Discount and Debt Issue Costs) over Consolidated Adjusted EBITDA comparability with prior reporting.
OUR
                                      ESG and Sustainability Journey
                                      Strong foundation enables impactful and meaningful strides in the future
                                      ▪ Focusing near-term efforts on establishing dedicated governance and oversight, improving disclosure and
                                        transparency as well as concentrating actions on areas most relevant to both stakeholders and Gibson
GIBSON ENERGY INVESTOR PRESENTATION

                                        ▪ Recognizing the importance of Board oversight of Sustainability, the Board established a dedicated Sustainability
                                           and ESG Committee, chaired by Judy Cotte, a recognized expert on ESG and responsible investment
                                        ▪ Published inaugural Sustainability report in May 2020, and made first submission to CDP in August 2020 which
                                           received a score of A-, the highest among the Company’s direct peer group
                                      ▪ In 2021, have built on strong foundation through the establishment of Sustainability and ESG targets, shifting to a
                                        sustainability-linked revolving credit facility and will further align disclosures with the TCFD and SASB frameworks

                                                         2019                                                       2020                                                  2021
                                            Formed Sustainability Committee          Appointed ESG expert, Judy Cotte, to Gibson’s board of directors    Expanded ESG targets to support the
                                                                                                                                                         strength and growth of Gibson’s ESG pillars
                                            Adopted Diversity & Inclusion (D&I) Policy Increased community investment budget to a company high of $1mm
                                       Q1

                                                                                                                                                         Upgraded to a AA rating by MSCI; the
                                            Commenced development of Operations      Launched Women in Operations & Engineering and Women in             highest rating awarded among Canadian
                                            Management System (OMS)                  Finance development programs                                        and U.S. peers

                                            Launched Gibson Gives Employee Giving    Published Gibson’s inaugural Sustainability Report                  Became the first public energy company
                                            Program                                                                                                      in North America to fully transition its
                                       Q2

                                                                                     Expanded the number and weighting of ESG related targets and        floating rate revolving credit facility to a
                                            Optimized Moose Jaw Refinery to reduce   metrics into Gibson’s compensation program                          sustainability-linked revolving credit
                                            emissions intensity per barrel by ~25%                                                                       facility

                                            Updated the corporate Code of            Published response to the CDP Climate Change Questionnaire
                                            Conduct and Ethics to reflect            Appointed Peggy Montana to Gibson’s board of directors;
                                       Q3

                                            commitment to ESG                        achieved 33% gender diversity
                                                                                     Announced signature $1mm multi-year partnership with Trellis to     Continue to improve and participate in
                                                                                     support youth mental health                                         additional disclosures, including further
                                                                                                                                                         aligning disclosures with the TCFD and
                                            Sanctioned the Hardisty Diluent          Received a CDP score of A- on the back of the submission made       SASB frameworks
                                            Recovery Unit (DRU), ESG positive        in Q3 2020
                                       Q4

                                            project
        5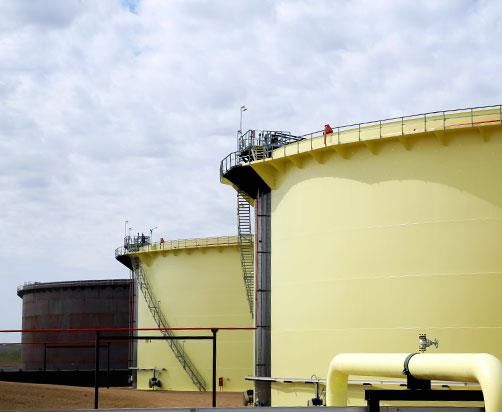
OUR
                                      SUSTAINABILITY PERFORMANCE
                                      Well positioned relative to peers despite being in the early phases of our journey
                                                                                                                                                                  Bloomberg ESG Rating(2)
                                                                                           25%                               WINNER
GIBSON ENERGY INVESTOR PRESENTATION

                                                                                                                                                                  (Ranked out of 100; higher is better)
                                                                                     DECREASE IN                            CALGARY                        80
                                             #1 RANKED                               PER B ARREL                          CHAM B ER ATB
                                             ESG SCORE IN                                                                                                  60
                                                                                      EMISSION                             COMMUNITY
                                             PEER GROUP (1)
                                                                                    INTENSIT Y AT                            IM PACT
                                                                                         M JF                                AWARD                         40

                                                                                                                                                           20

                                                                                                                                                                      MSCI ESG Rating(2)
                                                LOWEST                                                                           35%
                                                                         >37%
                                               Scop e 1 & 2 SCORE 1 & 2 GHG PER        OF SHORT-TERM
                                                                                                OF SHORT -
                                                                                                                                                                    (Ranked by grade; AAA is best)
                                                GHG PER       REVENUE IN PEER
                                                                           OF        INCENTIVE PLAN TIED
                                                                                                  TERM
                                                                                                                                                           AAA
                                                                                       TO ESG METRICS                                                       AA
                                               REVENUE &          GROUPEM PLOY E E S            INCENTIVE
                                                                                                                                                             A
                                               EB ITDA IN                            ARE WOM EN                            PLAN TIED TO                    BBB
                                              PEER GROUP                                                                   ESG M ETRICS
                                                                                                                                                            BB
                                                                                                                                                             B
                                                                                                                                                           CCC

                                                                               2020 CDP Score(2)                                                                 Sustainalytics ESG Rating(2)
                                                                    (Ranked by grade; A is best)                                                                  (Ranked out of 100; lower is better)
                                       A                                                                                                                   10
                                       A-
                                       B                                                                                                                   20
                                       B-
                                       C
                                       D                                                                                                                   30
                                       F
                                                                                                                                                           40
     6                                (1) Calculated as average Bloomberg, MSCI and Sustainalytics ESG Ratings rank vs. direct peers (PPL, IPL and KEY).
                                      (2) ESG Ratings as at April 30, 2021.
Complete Transformation of Business
                                      Repositioned from diverse mix of business lines to focused energy infrastructure
                                                                                              2014(1)                                                 2017(1)                                                 2020(2)
GIBSON ENERGY INVESTOR PRESENTATION

                                                                                                                                                                                                  ~75% Terminals &
                                                                            ~25% Terminals & Pipelines                              ~55% Terminals & Pipelines                                       Pipelines

                                        Adjusted
                                        EBITDA(1)
                                        From T&P and
                                        Infrastructure

                                                                                  ~30% Infrastructure                                     ~65% Infrastructure                                   ~80% Infrastructure

                                                                                    ~15% Take-or-Pay                                        ~45% Take-or-Pay                                       ~60% Take-or-Pay

                                        Adjusted
                                        EBITDA(1) From
                                        Take-or-Pay or
                                        Stable Fee-
                                        Based

                                                                            ~30% Take-or-Pay or Stable                              ~65% Take-or-Pay or Stable                                  ~80% Take-or-Pay or
                                                                                   Fee-Based                                               Fee-Based                                             Stable Fee-Based
                                      (1) Based on Consolidated Adjusted EBITDA; 2014 and 2017 adjusted for estimated finance lease payments to be comparable to 2020 under IFRS 16.
        7                             (2) Based on 2020 Consolidated Adjusted EBITDA; Take-or-pay intercompany contracts currently represent approximately 20% of Infrastructure revenues, with the proportion expected to decline over time.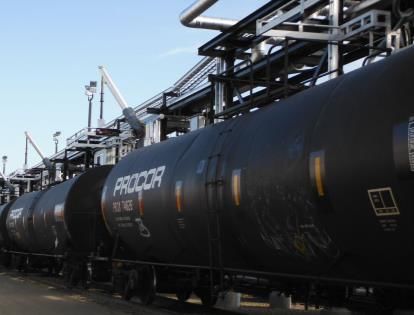
Financial Governing Principles
                                      Committed to maintaining a strong financial position by managing to key targets
                                                                                            Committed Target                                                                                             Performance
GIBSON ENERGY INVESTOR PRESENTATION

                                                             High Quality
                                                                                               >80% of Consolidated Adjusted EBITDA from take-
                                         Cash Flows

                                                               Contract                                                                                                                                  ~80% in 2020
                                         Quality of

                                                                                               or-pay and high-quality fee-for-service contracts
                                                              Structure

                                                            Creditworthy                       >85% of exposures under long-term contracts                                                               Remained at 90% in 2020
                                                           Counterparties                      are with investment grade counterparties

                                                               Strong                          Net Debt / Consolidated Adjusted EBITDA of                                                                3.1x total and 3.7x Infra.-
                                                                                               3.0x – 3.5x(1) and no greater than 4x on an
                                         Flexibility
                                         Financial

                                                            Balance Sheet                                                                                                                                only leverage at Q1 2021
                                                                                               Infrastructure-only(2) basis
                                                             Maintain &                                                                                                                                  S&P: BBB– rating
                                                               Improve                         Maintain Two Investment Grade ratings                                                                     DBRS: BBB (low) rating
                                                            Credit Ratings

                                                           Capital Funding                     Fund growth capital expenditures with                                                                     Capital program fully-
                                                                                               maximum 50% – 60% debt                                                                                    funded, with cushion
                                         Funding

                                                              Strategy
                                          Model

                                                             Sustainable                       Sustainable long-term payout of 70% – 80% of DCF                                                          72% total payout and 75%
                                                             Payout Ratio                      Infrastructure payout less than 100%(3)                                                                   Infra.-only at Q1 2021

                                      (1) Consolidated Leverage is calculated as Net Debt (defined as Total Debt Outstanding in the Q1 2021 MD&A, less liability component of Convertible Debentures, Hybrid capital, Cash and Cash Equivalents
                                          and Unamortized Issue Discount and Debt Issue Costs) over Consolidated Adjusted EBITDA comparability with prior reporting.
                                      (2) Infrastructure-only Leverage ratio is calculated as Net Debt (defined as Total Debt Outstanding in the Q1 2021 MD&A, less liability component of Convertible Debentures, Hybrid capital, Cash and Cash
        8                                 Equivalents and Unamortized Issue Discount and Debt Issue Costs) over Infrastructure Adjusted EBITDA less G&A.
                                      (3) Infrastructure-only Payout is calculated as Dividends over Infrastructure DCF (Infrastructure Adjusted EBITDA less G&A, Interest and Maintenance Capital).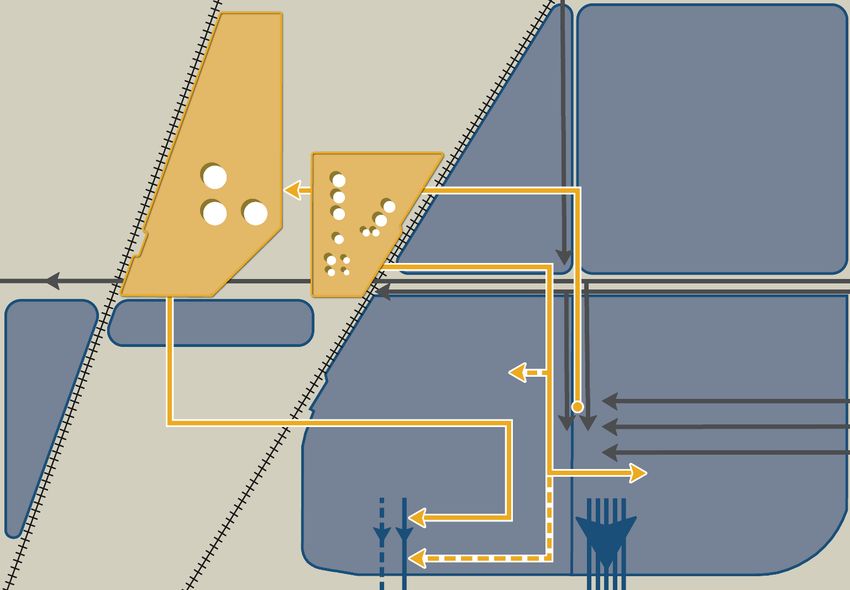
Funding Position and Maturity Profile
                                      Fully-funded, significant available liquidity and no maturities of size near-term
                                      ▪ Fully-funded for all sanctioned capital, with internal funding capacity well in excess of sanctioned capital
                                      ▪ At March 31, 2021, had access to over $800mm in liquidity through the sustainability-linked revolving credit
GIBSON ENERGY INVESTOR PRESENTATION

                                        facility, bilateral facilities and cash on the balance sheet, with no maturities until 2025

                                                              2021E Sources and Uses (1,2,3)                                                                                                 Maturity Profile
                                                                                      (C$mm)                                                                                                          (C$mm)
                                                                                                                                                                              Senior $750mm Credit Facility
                                                                                                              Further Capacity to                      $800
                                            2021E Retained DCF                                                                                                                          ($118mm Drawn)(4)
                                                                                                                Fund Capital in
                                               & Associated
                                                                                                                    2021E+
                                                 Leverage

                                                                                                                                                       $600                                                                       Senior
                                                                                                                                                                                                                               Unsecured
                                                  2018-2020                                                       2021E Growth                                                                                               3.60% Notes
                                                  Carry-Over                                                         Capital
                                                                                                                                                                                                                         Senior
                                                                                                                                                                                                   Senior                Unsecured
                                                                                                                                                       $400                                     Unsecured                2.85%
                                                                                                                                                                                              2.45% Notes                Notes                          5.25%
                                         2018 -       1
                                                    2020
                                                     Carry-Over                           2           $150            -    3    $175                                                                                                                    Hybrid
                                                                                                                                                                                                                                                         Notes
                                         2021E DCF & Leverage                                          375            -          425
                                         Total Sources                                                $525            -         $575                   $200
                                         Dividends                                                    (200)           -         (200)
                                         Growth Capital                                               (150)           -         (200)
                                         Total Uses                                                  ($350)           -        ($400)
                                                                                                                                                          $0
                                         Funding Surplus                                              $125            -         $175                                    2021 2022 2023 2024 2025 2026 2027 2028 2029                                     2080
                                      (1) Assumes target leverage of 50-60% on Infrastructure investment.
                                      (2) Assumes the low-end of the long-term run rate for Marketing Adjusted EBITDA of $80 to $120mm.
                                      (3) Illustrative funding analysis may not be additive to maintain narrower aggregate ranges.
        9                             (4) Floating rate revolving credit facility; drawn balance as at March 31, 2021. Bilateral facilities not included in revolving credit facility amounts. In April 2021, Gibson fully transitioned its principal
                                          revolving credit facility to a sustainability-linked revolving credit facility and extended maturity to April 2026.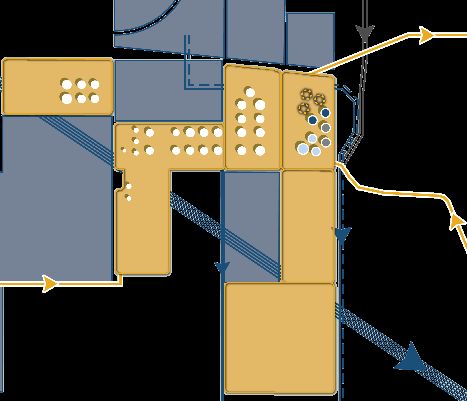
Adjusted EBITDA & DCF by Contract Structure
                                      Consolidated Adjusted EBITDA and cash flow heavily weighted to high quality businesses
                                      ▪ Through divesting non-core, commodity exposed businesses, Gibson has significantly improved its weighting to
                                        higher quality contract structures, resulting in the highest cash flow quality in the company’s history on a
GIBSON ENERGY INVESTOR PRESENTATION

                                        comparable basis
                                        ▪ Take-or-pay and stable fee-based structures from the Infrastructure segment accounted for ~80% of 2020
                                           Consolidated Adjusted EBITDA before G&A
                                        ▪ Stable fee-based component from the Terminals has been extremely ratable over time, as it is driven by volumes
                                           from the oil sands which show limited variability with commodity prices

                                                Consolidated Adj. EBITDA Excl. G&A by Contract Structure(1,2)
                                                                     (C$mm)
                                                                                                                                                                                     DCF by Contract
                                                                                                                                                                                              (C$mm)
                                                                                                                                                                                                     Structure (1,2,3)

                                                  35%         25%         25%         40%         55%         65%         50%         60%         80%                            70%         50%         60%         80%           % Take-or-Pay
                                      $600                                                                                                                           $300                                                          & Stable-Fee-
                                                                                                                                                                                                                                    For-Service

                                      $500

                                                                                                                                                                                                                                     Product
                                      $400                                                                                                                           $200
                                                                                                                                                                                                                                     Margin

                                                                                                                                                                                                                                   Commodity
                                      $300
                                                                                                                                                                                                                                    Fee-For-
                                                                                                                                                                                                                                     Service
                                      $200                                                                                                                           $100
                                                                                                                                                                                                                                      Stable
                                                                                                                                                                                                                                     Fee-For-
                                      $100                                                                                                                                                                                           Service

                                                                                                                                                                                                                                   Take-or-Pay
                                         $0                                                                                                                             $0
                                                 2012A       2013A       2014A       2015A       2016A       2017A       2018A       2019A      2020A                           2017A       2018A       2019A       2020A
                                      (1) Approximately 20% of 2020 take-or-pay Infrastructure revenues and 35% of 2020 total Infrastructure revenues from intercompany payments.
                                      (2) 2019 Infrastructure Adjusted EBITDA includes $15mm adjustment for one-time future environmental remediation provision for comparability purposes.
10                                    (3) Distributable Cash Flow not reported on a contract structure basis. Contract structure breakout of Distributable Cash Flow presented for illustrative purposes assuming Corporate G&A, interest, and
                                          maintenance capex are fully deducted from Infrastructure Adjusted EBITDA. Marketing Adjusted EBITDA shown net of lease costs and tax expenses.
Counterparty Credit Exposure
Infrastructure accounts for majority of Consolidated Adj. EBITDA; terminals ~90% IG customers
Nature of Credit Exposures by Business Segment(1)
▪
GIBSON ENERGY INVESTOR PRESENTATION
100% Infrastructure represented ~80% of 2020 Consolidated Adjusted EBITDA and is backed by
long-term, take-or-pay and stable fee-based contracts with predominantly investment grade
counterparties
80% ▪ Hardisty and Edmonton Terminals represent ~70% of Consolidated Adjusted EBITDA, with
Gibson’s customers being larger oil sands players as well as refiners
60% ▪ Marketing represented ~20% of 2020 Consolidated Adjusted EBITDA
▪ Downside risk mitigated through execution of back-to-back transactions with a focus on
not being long or short the underlying commodity or taking open positions
40% ▪ Combination of financial and physical transactions in place to hedge all storage and
location-based inventories with exposure over multiple pricing periods
20% ▪ Majority of transactions by exposure with creditworthy energy and refining companies,
financial institutions and trading houses, with financial assurance in place with any sub-
investment grade counterparties
0%
Consolidated ▪ Limit potential credit exposures in Refined Products by covering the customer portfolio
Adjusted EBITDA through an AR insurance program and maintaining conservative open credit limits
Terminals Counterparties(2)
< 10% Not Rated & Sub-IG
100%
▪ Majority of terminals customers are investment grade, given the financial resources
~90% required to develop and maintain major oil sands projects, as well as to produce
80%
BBB- to BBB+ Investment sufficient volumes as to require tankage
60% Grade ▪ Even non-investment grade counterparties are generally larger firms, and Gibson’s
~55% standard contract includes ability to request security in the event of a credit change to
40%
A- to A+ non-investment grade
A- or
20% Better ▪ Gibson’s internal credit policy requires subsidiaries be backed by parent companies
AA- to AA+
0%
11 (1) Based on 2020 Consolidated Adjusted EBITDA; ~20% of 2020 take-or-pay Infrastructure revenues and 35% of 2020 total Infrastructure revenues were intercompany.
(2) Ratings as at April 30, 2021 and calculations based on LTM Q1 2021 external revenues; Not Rated and sub-IG category weighted heavily towards not rated entities.Strong Financial Position
Leverage and payout below target, with headroom on Infrastructure-only targets
▪ Long-term funding model and continued delivery of the strategy is not contingent on cyclical cash flows
▪ LTM Q1 2021 Infrastructure-only leverage(1) of 3.7x and Infrastructure-only payout(2) of 75%
GIBSON ENERGY INVESTOR PRESENTATION
▪ Maintain two Investment Grade ratings(3)
▪ Rating of BBB (low) with stable trend from DBRS Morningstar, reaffirmed April 2021
▪ Rating of BBB- with stable outlook by S&P, reaffirmed July 2020
Net Debt / Adj. EBITDA(1,4) Payout Ratio(2)
5.0x (x) 120% (%)
Targeting long-term Infrastructure-
Targeting long-term Infrastructure-
only Payout ofContract Quality & Balance Sheet Comparison
Attractive contract quality and best-in-class leverage relative to peer group
Proportion Take-or-Pay & Fee for Service(1) Net Debt / LTM Adjusted EBITDA(2)
GIBSON ENERGY INVESTOR PRESENTATION
(%) (x)
100% 6.0x
80%
4.0x
60%
40%
2.0x
20%
0% 0.0x
Peer A Peer B GEI Peer C Peer A Peer B Peer C GEI
(1) Gibson Proportion Take-or-Pay & Fee-for-Service based on 2020; Peer Proportion Take-or-Pay & Fee-for-Service per public disclosure as at December 31, 2020.
(2) Net Debt / Adjusted EBITDA ratio calculated as Net Debt (defined as Total Debt Outstanding in the Q1 2021 MD&A, less liability component of Convertible Debentures, Hybrid capital, Cash and Cash
13 Equivalents and Unamortized Issue Discount and Debt Issue Costs) over Consolidated Adjusted EBITDA; Gibson ratios per Q1 2021 public disclosure; Peer ratios per Q4 2020 public disclosure.
Note: Peers include Inter Pipeline, Keyera and Pembina (peers are not linked between charts).Long-Term Capital Allocation Priorities
Near-term focus on remaining fully-funded and preserving balance sheet strength
▪ Target payout ratio of 70% – 80% over the long-term
GIBSON ENERGY INVESTOR PRESENTATION
Fund Dividend ▪
Fund the Business
Dividend to be fully covered by stable, long-term Infrastructure
cash flows
▪ Significant value creation through investment in long-term
Infrastructure with high-quality contracts and counterparties
Fund Infrastructure
▪ Expect to deploy capital at 5x – 7x EBITDA, with a focus on
Growth ensuring appropriate risk adjusted returns when allocating
capital
▪ Absent near-term Infrastructure investment
opportunities, surplus cash flows from Marketing best
returned to shareholders via share buyback rather than
Share Buybacks dividend
Return Capital to
Shareholders
▪ To the extent Gibson does not deploy its full $200mm in
growth capital in 2021, could return excess via buyback
▪ Intention to provide steady, long-term dividend
growth to shareholders
Dividend▪Growth
▪ Dividend increases to be fully underpinned by growth
in stable, long-term cash flows from Infrastructure
14Hardisty Terminal – Best-in-Class Connectivity
Replicating Gibson’s competitive position not possible and cost prohibitive
▪ Flexibility offered by Gibson’s existing best-in-class connectivity provides a wide moat at Hardisty
▪ Key consideration for customers as it helps production volumes reach market at the best price
GIBSON ENERGY INVESTOR PRESENTATION
▪ Leveraging existing interconnectivity results in cost advantage on new opportunities for Gibson relative
to competitors
▪ Gibson’s connectivity advantage built over decades and would be impossible to replicate today
▪ Due to both cost and difficulties in securing connection agreements with competitors
Inbound Pipelines Connections(1) Outbound Pipelines Connections(1)
(total number) (total number)
12 12
10 10
8 8
6 6
4 4
2 2
0 0
GEI Peer A Peer B Peer C Peer D Peer E GEI Peer A Peer B Peer C Peer D Peer E
15 (1) Peers include Enbridge, Flint Hills, Husky, Inter Pipeline, and TC Energy (peers are not linked between charts).Hardisty Terminal – Competitive Advantages
Replicating Gibson’s competitive position not possible and is cost prohibitive
▪ Located at the heart of the Hardisty footprint
GIBSON ENERGY INVESTOR PRESENTATION
Land Position ▪ 240 acres of land holdings adjacent to existing tankage plus additional land
surrounding ensures decades of running room
▪ Track record of placing new tankage into service on-time and on-budget
Cost Focus
▪ Long useful life with limited maintenance capital required
▪ Focused on terminal operation with primary objective of improving customers’
Independent market access
▪ No preference of where customers bring in or send their crude
▪ Exclusive access to the only unit train rail terminal at Hardisty through joint
venture with U.S. Development Group (“USD”)
Rail Access ▪ Current capacity of about 210,000 bbl/d (~3.5 unit trains per day), with ability
to expand
▪ Development of the DRU would increase demand for rail access
16Hardisty Terminal – Overview
Continue to grow at Hardisty at an attractive 5x – 7x EBITDA build multiple
COLD LAKE
GIBSON ENERGY INVESTOR PRESENTATION
N
HARDISTY TOP OF
THE HILL Gibson connection to
HARDISTY EAST 210 mbbl/d rail facility
WEST
HARDISTY Phase 4
TERMINAL Placed 3 tanks, or 1.5 mmbbl, into service in Q4 2020
representing a ~12% expansion of the Terminal
13.5
1.5
mmbbl
12.0 mmbbl
mmbbl
PROVOST
TRANSCANADA
KEYSTONE / XL
BELLSHILL
ENBRIDGE
EXPRESS
Existing Tankage Total Future
Tankage Placed In Hardisty Sanctions
at Start of Service Tankage
2020 2020 2021
17DRU at Hardisty – On-Strategy Infrastructure
High-quality infrastructure project leveraging and extending Hardisty position
First DRU in ▪ 50%/50% joint venture between Gibson and USD
GIBSON ENERGY INVESTOR PRESENTATION
Western
Canada ▪ Agreement in place with ConocoPhillips Canada for 50,000 bbl/d of inlet capacity
▪ Infrastructure required to support the long-term egress of oil sands production
▪ Underpinned by a long-term, take-or-pay agreement with an investment grade
On Strategy customer
▪ Leverages existing platform to attain target 5x – 7x EBITDA build multiple
▪ Drives nearly a full year of targeted distributable cash flow per share growth
Strengthens ▪ Further improves the Gibson Hardisty Terminal’s best-in-class connectivity, becoming
and Extends the sole access point for DRU egress out of Western Canada
Hardisty ▪ Customers at the DRU will require tankage at Gibson’s Hardisty Terminal
Platform ▪ Extends contracted life at the Hardisty Unit Rail Facility
▪ Believe the first DRU to enter service will have a significant competitive advantage in
securing potential future expansions and providing an industry solution over time
Anticipate
Future ▪ Able to sanction in 50,000 bbl/d increments, a good fit with brownfield oil sands
projects
Expansions
▪ Provides additional confidence in the ability to continue to sanction growth over the
18 long-term at Hardisty given the potential for further delays on alternative egressDRU at Hardisty – Full Market Access Solution
Full market access solution to support construction of first DRU in Western Canada
Bitumen production from the oil sands shipped as
GIBSON ENERGY INVESTOR PRESENTATION
1
OIL SANDS dilbit via pipelines to Gibson’s Hardisty Terminal
EDMONTON DRU at Hardisty separates the majority of blended
condensate, creating DRUbitTM, a more
HARDISTY 2 concentrated heavy oil specifically designed for rail
transportation that is a non-flammable, non-
hazmat commodity, increasing safety of shipping
DRUbitTM loaded onto rail at the Hardisty Unit
3
Rail Facility
The DRUbitTM is transported by rail to PORT ARTHUR TERMINAL
4 the USD Port Arthur Terminal on the
U.S. Gulf Coast N PORT
ARTHUR SABINE
LAKE
Once unloaded at USD’s Port Arthur
Terminal, able to access the local
5 refinery market as well as a large
network of refining and marine
PORT
facilities via barge or tanker US GULF COAST
19 ARTHURDRU at Hardisty – Location and Construction
Expect mid-2021 in-service at a cost of $125mm to $175mm net to Gibson
▪ Targeting in-service date in mid-2021
▪ Total capital cost of the initial 50,000 bbl/d phase, net to Gibson, estimated to be between $125mm and $175mm
GIBSON ENERGY INVESTOR PRESENTATION
▪ To be constructed under a lump sum contract with performance guarantees for DRU facility to mitigate risk
▪ Utilizes a standardized 50,000 bbl/d inlet capacity DRU facility design to allow replication on future phases
▪ Modularization where appropriate, allowing for fabrication where facilities and labor readily available
Hardisty Terminal and HURC Overview
ATHABASCA /
ATHABASCA TWIN
N DILBIT SENT ~4KM FROM HARDISTY TERMINAL TO
COLD LAKE / COLD THE HARDISTY UNIT TRAIN RAIL FACILITY
LAKE EXPANSION
DRU & HURC
~4KM
FACILITY
HARDISTY
CONDENSATE SEPARATED FROM DILBIT AT THE
TERMINAL DRU AND RETURNED TO THE HARDISTY TERMINAL
ENBRIDGE TC ENERGY
EXPRESS KEYSTONE
20Edmonton Terminal
Edmonton Terminal an attractive cash flow stream, although smaller scale
▪ Edmonton Terminal benefits from advantageous positioning located next to two major refineries, access to both
the CN and CP railway lines and being near both major egress pipelines
GIBSON ENERGY INVESTOR PRESENTATION
▪ Provides flexibility to offer both crude oil or refined products storage as well as product terminalling to
customers
RAIL LINE SUNCOR
N RAIL LINE REFINERY
EDMONTON
TERMINAL
AOSPL
Waupisoo
KML / ENB and Access
COLD LAKE Connection Inbound COLD LAKE
PEACE PEACE
COLD LAKE
IMPERIAL
REFINERY ACCESS
CORRIDOR
Trans Mountain TRANS MOUNTAIN /
Connection(1) TRANS MOUNTAIN WAUPISOO
EXPANSION
ENBRIDGE
MAINLINE
21
(1) Trans Mountain Connection easily modified to connect to Trans Mountain Expansion once operational.Marketing Capabilities
Creates value for customers and drives volumes to Gibson’s Infrastructure assets
GIBSON ENERGY INVESTOR PRESENTATION
▪ Refined Products leases the Moose Jaw Facility from the
Refined Infrastructure segment, sourcing feedstocks and marketing
Products the refined products that are produced by the facility
▪ Physically source hydrocarbons, providing increased liquidity
Producer and creating market access solutions for the Company’s
Services customers
Capabilities ▪ Drives volumes to both the Hardisty and Edmonton
Terminals, as well as Gibson’s other infrastructure assets
▪ Location, quality or time-based opportunities with focus on
Asset not being long or short on the underlying commodity or
Optimization taking open positions
22Adjusted EBITDA Growth
Infrastructure has grown to represent ~80% of Consolidated Adjusted EBITDA
▪ Significant growth in the core Infrastructure Adjusted EBITDA over time, with a realized 18% CAGR from 2011 - 2020
▪ Year over year Infrastructure Adjusted EBITDA growth in 2020 of ~$60mm, or 20%, on a comparable basis
GIBSON ENERGY INVESTOR PRESENTATION
▪ Infrastructure Adjusted EBITDA expected to be at ~$400mm annual run-rate until the DRU enters service in mid-2021
▪ Long-term run rate for Marketing Adjusted EBITDA of $80 – $120mm
Growth in Consolidated Adjusted EBITDA Before G&A(1,2)
(C$mm, C$/share) Existing projects provide strong
$600
line of sight to sustained
Infrastructure growth through
$500 2022E
$400
$300
Marketing Outperformance
$200
Marketing Long-Term Run Rate(3)
$100 Divested Business
Core Infrastructure
$0
2011A 2012A 2013A 2014A 2015A 2016A 2017A 2018A 2019A 2020A
(1) Consolidated Adjusted EBITDA Before G&A illustratively adjusted for estimated finance leases under IFRS 16 for years 2017 and prior to improve comparability with current presentation.
23 (2) 2019 Infrastructure Adjusted EBITDA includes $15mm adjustment for one-time future environmental remediation provision for comparability purposes.
(3) Long-term run rate for Marketing Adjusted EBITDA assumes $80 - $120mm per year for 2019 forward, where previously the range assumed was $60 - $80mm.Distributable Cash Flow Growth
Sustained growth in core Infrastructure driving meaningful DCF per share growth
Distributable Cash Flow with Illustrative Breakout by Business(1)
GIBSON ENERGY INVESTOR PRESENTATION
(C$mm, C$/share)
$400 $2.50
Delivered DCF CAGR of ~16%
between 2017A and 2020…
$2.00
…with existing projects
$300
and future sanctions
expected to drive
attractive long-term $1.50
growth per share
$200
$1.00
$100 Marketing Outperformance
Marketing Long-Term Run Rate(2) $0.50
Divested Business
Core Infrastructure
$0 $0.00
2017A 2018A 2019A 2020A
(1) Distributable Cash Flow not reported on a segment basis. Segment breakout of Distributable Cash Flow presented for illustrative purposes assuming Corporate G&A, interest, and maintenance capex are
24 fully deducted from Infrastructure Adjusted EBITDA. Marketing shown net of lease costs and tax expenses.
(2) Long-term run rate for Marketing Adjusted EBITDA assumes $80 - $120mm per year for 2019 forward, where previously the range assumed was $60 - 80mm.Key Takeaways
Continue to deliver on all facets of the strategy; will remain disciplined
Delivery Since January 2018 Investor Day Go Forward Deliverables
GIBSON ENERGY INVESTOR PRESENTATION
Infrastructure
Sanction 2 – 4 Tanks per Year ▪ Continue to target investing $150 – $200mm per
(vs. 1 – 2) year over the long-term
Growth
▪ Expect to sanction 2 – 4 tanks per year on a run-rate
Sanction Infrastructure basis, with a bias to the low end in the current
Growth Outside Terminals environment and discussions for future DRU phases
Divest Non-core ▪ Direct investment solely into Infrastructure
Asset Base
Focused
Assets
▪ Remain focused on organic opportunities
Focus Capital on ▪ Conservative approach to sanctioning additional
Infrastructure Growth capital or potential M&A in current environment
▪ Leverage to remain with target 3.0x – 3.5x Debt /
Balance Sheet
Reduce Leverage &
Payout Consolidated Adjusted EBITDA range longer term
Strong
▪ Maintain payout of 70% – 80%, growing dividend
Fund Capital only when fully underpinned by Infrastructure
Growth Internally ▪ Remain fully-funded for all sanctioned growth
▪ #1 ranked ESG score in peer group
Further integrate ESG and
ESG
Sustainability into Business ▪ Seek to meet ESG and Sustainability targets and
25 publish additional TCFD/SASB aligned disclosuresAPPENDIX GIBSON ENERGY ESG DISCUSSION
Sustainability & ESG Targets
                                      ENVIRONMENT                                                                                                2025 TARGET                  2030 TARGET
                                            OVERALL GHG INTENSI T Y Reduce our overall greenhouse gas intensity                                         15%                        20%
                                            PROCESSI NG GHG INTENSI T Y TARGET Reduce our aggregate greenhouse gas intensity                            30%                        40%
GIBSON ENERGY INVESTOR PRESENTATION

                                            STORAGE & HANDLING GHG INTENSI T Y TARGET Reduce our aggregate greenhouse gas intensity                     60%                        95%
                                            INDIRECT EM ISSIONS (SCOPE 2) Reduce absolute scope 2 emissions across our business                         50%                       100%
                                            DIRECT EM ISSIONS (SCOPE 1) Reduce absolute scope 1 and 2 emissions (Moose Jaw Facility)                    15%

                                      SOCIAL                                                                                                      2025 TARGET                 2030 TARGET
                                                                                                                                                40 - 42% of workforce    43 - 45% of workforce
                                            WOM EN IN THE WOR KFOR C E
                                                                                                                                                      33 - 40% of              40 - 45% of
                                            At least 1 woman holds an SVP & above role
                                                                                                                                                  VP & above roles         VP & above roles
                                            R ACIAL & ETHN IC M IN OR ITY R EPR ES EN TA T IO N                                                       21 - 23%                   23 - 25%
                                            At least 1 racial & ethnic minority and/or Indigenous Persons holds a SVP or above role                 of workforce               of workforce
                                            IN DIGEN OUS R EPR ES EN T A TIO N
                                                                                                                                                     2.5 - 3.0%                 3.5 - 4.0 %
                                            At least 1 racial & ethnic minority and/or Indigenous Persons holds a SVP or above role
                                                                                                                                                             At least $5 MILLION
                                            COM M UN ITY Waupoose Initiatives
                                                                                                                                                       (minimum of $1 Million annually)
                                            COM M UN ITY Maintain our leadership in workforce participation in our community giving program               At least 80% participation
                                            TOTAL R ECOR DAB LE IN JUR Y FR EQUEN CY (TR IF)                                                           Top quartile safety performance

                                      GOVERNANCE                                                                                                                   TARGET
                                            WOM EN R EPR ESE N TA TI ON Board of Directors                                                                         2025 40%
                                            R ACIAL & ETHN IC M IN OR ITY AN D/ OR IN DIGEN OUS R EPESEN T A TIO N Board of Directors                     2025 One Board Member
                                                                                                                                              ONGOING Maintain top quartile performance from
                                            SUSTAIN AB I LI T Y LEADER SHI P
                                                                                                                                                      third party ESG rating agencies
                                                                                                                                              ONGOING Maintain top quartile performance from
                                            PR OTECTI ON OF ASSETS
                                                                                                                                                      third party ESG rating agencies
27
                                      Note: All targets are established on a 2020 baseline.
Infrastructure Growth Capital
Invested ~$1.75B in Infrastructure 2011 - 2020, including 11.5mmbl of tankage
Infrastructure
InfrastructureGrowth
GrowthCapital
CapitalExpenditures 2011 -- 2021E
Expenditure 2011 2021E
GIBSON ENERGY INVESTOR PRESENTATION
(C$mm) $296 2021E
Up to
$243 $229
$221 $219 $200mm
$184
$147
$101
$62
$41
2011A 2012A 2013A 2014A 2015A 2016A 2017A 2018A 2019A 2020A 2021E
2 Tanks, 0.6 mmbbl
Infrastructure Placed Into Service
2 Tanks, 0.6 mmbbl
Infrastructure Under Construction
▪ Expect to sanction 2 Tanks, 0.8 mmbbl
2 to 4 tanks a year on 3 Tanks, 1.2 mmbbl
run-rate basis, with a
2 Tanks, 0.6 mmbbl
bias to lower end in the current
5 Tanks, 2.3 mmbbl
▪ Total DRU capital cost of the initial 50,000 bbl/d
phase, net to Gibson, estimated to be in the range 2 Tanks, 0.8 mmbbl
of $125 – $175mm 3 Tanks, 1.1 mmbbl
▪ Roughly two-thirds of DRU spend was incurred Viking Pipeline, ~120 km
in 2020, with the remainder to be incurred in 2021E
Pyote East Pipeline, ~25 km
▪ Expect to deploy ~$175mm in 2021E on Canadian Projects and 4 Tanks, 2.0 mmbbl
potentially up to ~$25mm in the U.S.
3 Tanks, 1.5 mmbbl
▪ Expect that at least half of 2021E growth capital to beneficial on an ESG
DRU, 50 kbbl/d
and Sustainability basis towards Gibson or on behalf of customers
28 Edm. Biofuels Blending
▪ Expect ~$25 – 30mm of Replacement Capital in 2021EForward-Looking Statement Notice
The forward-looking statements contained in this presentation represent Gibson’s expectations as of the date hereof, and are subject to change after such date. Gibson disclaims any intention or obligation to update or revise any forward-looking
statements whether as a result of new information, future events or otherwise, except as may be required by applicable securities laws. All references herein to “Gibson” include Gibson Energy Inc. and/or its subsidiaries.
This presentation refers to certain financial measures that are not determined in accordance with IFRS. Adjusted EBITDA and distributable cash flow not measures recognized under IFRS and do not have standardized meanings prescribed by IFRS and,
therefore, may not be comparable to similar measures reported by other entities. Management considers these to be important supplemental measures of Gibson’s performance and believes these measures are frequently used by securities analysts,
investors and other interested parties in the evaluation of companies in industries with similar capital structures. See “Non-GAAP Financial Measures” in Gibson's MD&A for a reconciliation of such measures to the most directly comparable IFRS measure.
Readers are encouraged to review Gibson's most recent MD&A, available at www.gibsonenergy.com for a full discussion of the use of each measure and to evaluate each adjustment and the reasons the Company considers it appropriate for supplemental
GIBSON ENERGY INVESTOR PRESENTATION
analysis. Readers are cautioned, however, that these measures should not be construed as an alternative financial results determined in accordance with IFRS as an indication of the Company’s performance.
Certain statements contained in this presentation constitute forward-looking information and statements (collectively, “forward-looking statements”). These statements relate to future events or Gibson's future performance. All statements other than
statements of historical fact are forward-looking statements. The use of any of the words ‘‘anticipate’’, ‘‘plan’’, ‘‘contemplate’’, ‘‘continue’’, “aim”, “target”, “must”, “commit”, ‘‘estimate’’, ‘‘expect’’, ‘‘intend’’, ‘‘propose’’, ‘‘might’’, ‘‘may’’, ‘‘will’’, ‘‘shall’’,
‘‘project’’, ‘‘should’’, ‘‘could’’, ‘‘would’’, ‘‘believe’’, ‘‘predict’’, ‘‘forecast’’, ‘‘pursue’’, ‘‘potential’’ and ‘‘capable’’ and similar expressions expressing future outcomes or statements regarding an outlook are intended to identify forward-looking statements.
Forward-looking statements, included or referred to in this presentation include, but are not limited to statements with respect to: the business and financial prospects and opportunities of Gibson, forecast operating and financial results of Gibson,
including target distributable cash flow, Gibson’s Sustainability and ESG targets and expected ESG and sustainability disclosures, business strategy and funding position and plans of management (including targeted timing), anticipated growth and the
sources of financing thereof, allocation of capital, capital deployment and investment and the amount, sources and timing thereof, objectives of or involving Gibson, expectations of future market conditions, expectations regarding existing and future
counterparties, capital allocation, and sources thereof, funding capacity, competitive position and anticipated competitive advantages, directed Infrastructure investment, capital targets, the anticipated in-service dates of various projects, including but not
limited to the in-service date of the Hardisty DRU Project, projected capital costs of the Hardisty DRU Project and potential future expansion opportunities of the Hardisty DRU Project which may become available, Gibson’s ability to sanction additional
tankage, anticipated impact of commodity prices, projections for the remainder of 2021 and future years and Gibson's plans and strategies to realize such projections, expectations and targets for EBITDA, cash flows, distributable cash flow growth, debt
and net debt to Adjusted EBITDA ratios, payout ratio, anticipated leverage, nature of parties contracting with Gibson and contract life, management’s expectations with respect to a share buyback, ability to pay dividends and the amount and sources of
dividend payments and yield per share, Gibson's anticipated market share and ability for third parties to replicated Gibson’s competitive position and costs associated therewith and Gibson’s ability to continue to integrate ESG and Sustainability initiatives
into its business including the ESG benefits of growth capital to Gibson or its customers. These statements relate to future events or Gibson’s future performance.
The forward-looking statements reflect Gibson's beliefs and assumptions with respect to, among other things, future operating and financial results; general economic and industry trends; future growth in world-wide demand for crude oil and petroleum
products; commodity prices; no material defaults by the counterparties to agreements with Gibson; Gibson's ability to obtain qualified and diverse personnel, owner-operators, lease operators and equipment in a timely and cost-efficient manner or at all;
the regulatory framework governing taxes and environmental matters in the jurisdictions in which Gibson conducts and will conduct its business; changes in credit ratings applicable to Gibson; operating and borrowing costs, including those associated with
Gibson's Sustainability programs; the energy transition that is underway as the world shifts toward a lower carbon economy; a maintained industry focus on ESG; Gibson's ability to achieve its Sustainability and ESG targets and the timing thereof; future
capital expenditures to be made by Gibson; Gibson's ability to obtain financing for its capital programs on acceptable terms; the ability of Gibson to place assets into service as currently planned and scheduled; the Company's future debt levels; the impact
of increasing competition on the Company; the impact of changes in government policies on Gibson; the impact of future changes in accounting policies on the Company’s consolidated financial statements; the impact of the COVID-19 pandemic, including
related government responses thereto, on demand for crude oil and petroleum products and Gibson’s operations generally; expectations regarding the sources of funding of growth initiatives; Gibson’s ability to generate sufficient cash flow to meet
Gibson’s current and future obligations; Gibson's dividend policy; product supply and demand; the Company’s ability to successfully implement the plans and programs disclosed in Gibson's strategy and other assumptions inherent in management’s
expectations in respect of the forward-looking statements identified herein.
Forward-looking statements involve known and unknown risks, uncertainties and other factors that may cause actual results or events to differ materially from those anticipated in such forward-looking statements. Although Gibson believes these
statements to be reasonable, no assurance can be given that the results or events anticipated in these forward-looking statements will prove to be correct and such forward-looking statements included in this press release should not be unduly relied
upon. Actual results or events could differ materially from those anticipated in these forward-looking statements as a result of, among other things, risks inherent in the businesses conducted by Gibson; the effect of COVID-19 and governmental responses
thereto on Gibson’s business; the severity, transmission rate and resurgence of the COVID-19 virus or any variants thereof; the timing, extent and effectiveness of containment actions, including the approval, availability, effectiveness and distribution rate
of vaccines; the speed and extent to which normal economic and operating conditions resume worldwide; the uncertainty of the pace and magnitude of the energy transition and the variation between jurisdictions; competitive factors and economic
conditions in the industries in which Gibson operates; prevailing global and domestic financial market and economic conditions; changes in credit ratings applicable to Gibson; world-wide demand for crude oil and petroleum products; volatility of
commodity prices, currency and interest rates fluctuations; product supply and demand; operating and borrowing costs and the accuracy of cost estimates, including those associated with Gibson's ESG and Sustainability programs; the effect of reductions
or increases in Gibson's borrowing costs; exposure to counterparties and partners, including ability and willingness of such parties to satisfy contractual obligations in a timely manner; future capital expenditures; capital expenditures by oil and gas
companies; production of crude oil; decommissioning, abandonment and reclamation costs; changes to Gibson's business plans or strategy; Gibson's ability to access various sources of debt and equity capital, generally, and on terms acceptable to Gibson;
changes in government policies, laws and regulations, including environmental and tax laws and regulations; competition for employees and other personnel, equipment, material and services related thereto; dependence on certain key suppliers and key
personnel; reputational risks; acquisition and integration risks; risks associated with the Hardisty DRU project; capital project delivery and success; risks associated with Gibson's use of technology, including attacks by hackers and/or cyberterrorists or
breaches due to employee error, malfeasance or other disruptions, and any increased risk associated with increased remote access to Gibson's systems; ability to obtain regulatory approvals necessary for the conduct of Gibson's business; the availability
and cost of employees and other personnel, equipment, materials and services; labour relations; seasonality and adverse weather conditions, including its impact on product demand, exploration, production and transportation; inherent risks associated
with the exploration, development, production and transportation of crude oil and petroleum products; litigation risk; and political developments around the world, including the areas in which Gibson operates, many of which are beyond the control of
Gibson.
Readers are cautioned that the foregoing lists are not exhaustive. For an additional discussion of material risk factors relating to Gibson and its operations, please refer to those included in Gibson’s Annual Information Form dated February 22, 2021 and in
other documents Gibson files from time to time with securities regulatory authorities, available on SEDAR at sedar.com and on the Gibson website at www.gibsonenergy.com. These statements speak only as of the date of this presentation. Gibson does
not undertake any obligations to publicly update or revise any forward-looking statements except as required by securities law. Information on, or connected to, the Gibson's website at www.gibsonenergy.com does not form part of this press release.
29You can also read