Second Quarter 2021 Earnings Presentation - August 3, 2021 - cloudfront.net
←
→
Page content transcription
If your browser does not render page correctly, please read the page content below

Second Quarter 2021
Earnings Presentation

August 3, 2021
IMPORTANT DISCLOSURES

Additional Information and Where To Find It
In connection with the proposed merger (the “Proposed Merger”) between Penn Virginia Corporation (together with all predecessors and subsidiaries, “Penn Virginia,” “PVAC,” “we,” “us,” “our” or the “Company”)
and Lonestar Resources US Inc. (“Lonestar” or “LONE”), Penn Virginia intends to file with the Securities and Exchange Commission (the “SEC”) a registration statement on Form S-4 (the “Registration Statement”)
to register the shares of Penn Virginia’s common stock to be issued in connection with the Proposed Transaction. The Registration Statement will include a document that serves as a prospectus and proxy statement of
Penn Virginia and a consent solicitation statement of Lonestar (the “proxy statement/consent solicitation statement/prospectus”), and each party will file other documents regarding the Proposed Transaction with the
SEC. INVESTORS AND SECURITY HOLDERS OF PENN VIRGINIA AND LONESTAR ARE URGED TO CAREFULLY AND THOROUGHLY READ, WHEN THEY BECOME AVAILABLE, THE
REGISTRATION STATEMENT, THE PROXY STATEMENT/CONSENT SOLICITATION STATEMENT/PROSPECTUS, AS EACH MAY BE AMENDED OR SUPPLEMENTED FROM TIME TO TIME,
AND OTHER RELEVANT DOCUMENTS FILED BY PENN VIRGINIA AND LONESTAR WITH THE SEC BECAUSE THEY WILL CONTAIN IMPORTANT INFORMATION ABOUT PENN VIRGINIA
AND LONESTAR, THE PROPOSED TRANSACTION, THE RISKS RELATED THERETO AND RELATED MATTERS.
After the Registration Statement has been declared effective, a definitive proxy statement/consent solicitation statement/prospectus will be mailed to shareholders of each of Penn Virginia and Lonestar. Investors will
be able to obtain free copies of the Registration Statement and the proxy statement/consent solicitation statement/prospectus, as each may be amended from time to time, and other relevant documents filed by Penn
Virginia and Lonestar with the SEC (when they become available) through the website maintained by the SEC at www.sec.gov. Copies of documents filed with the SEC by Penn Virginia, including the proxy
statement/consent solicitation statement/prospectus (when available), will be available free of charge from Penn Virginia’s website at www.pennvirginia.com under the “Investors” tab. Copies of documents filed with
the SEC by Lonestar will be available free of charge from Lonestar’s website at www.lonestarresources.com under the “Investor Relations” tab.

Participants in the Solicitation
Penn Virginia, Lonestar and certain of their respective directors, executive officers and other members of management and employees may be deemed to be participants in the solicitation of proxies from Penn
Virginia’s shareholders and the solicitation of written consents from Lonestar’s shareholders, in each case with respect to the Proposed Transaction. Information about Penn Virginia’s directors and executive officers
is available in Penn Virginia’s Annual Report on Form 10-K for the 2020 fiscal year filed with the SEC on March 9, 2021, and its definitive proxy statement for the 2021 annual meeting of shareholders filed with the
SEC on April 7, 2021. Information about Lonestar’s directors and executive officers is available in Lonestar’s Annual Report on Form 10-K for the 2020 fiscal year, as amended, filed with the SEC on April 30, 2021.
Other information regarding the participants in the solicitations and a description of their direct and indirect interests, by security holdings or otherwise, will be contained in the Registration Statement, the proxy
statement/consent solicitation statement/prospectus and other relevant materials to be filed with the SEC regarding the Proposed Transaction when they become available. Stockholders, potential investors and other
readers should read the proxy statement/consent solicitation statement/prospectus carefully when it becomes available before making any voting or investment decisions.

No Offer or Solicitation
This presentation is not intended to and shall not constitute an offer to sell or the solicitation of an offer to sell or the solicitation of an offer to buy any securities or a solicitation of any vote or approval, nor shall there
be any sale of securities in any jurisdiction in which such offer, solicitation or sale would be unlawful prior to registration or qualification under the securities laws of any such jurisdiction. No offer of securities shall
be made except by means of a prospectus meeting the requirements of Section 10 of the Securities Act of 1933, as amended.

                                                                                                                                                                                                                                  2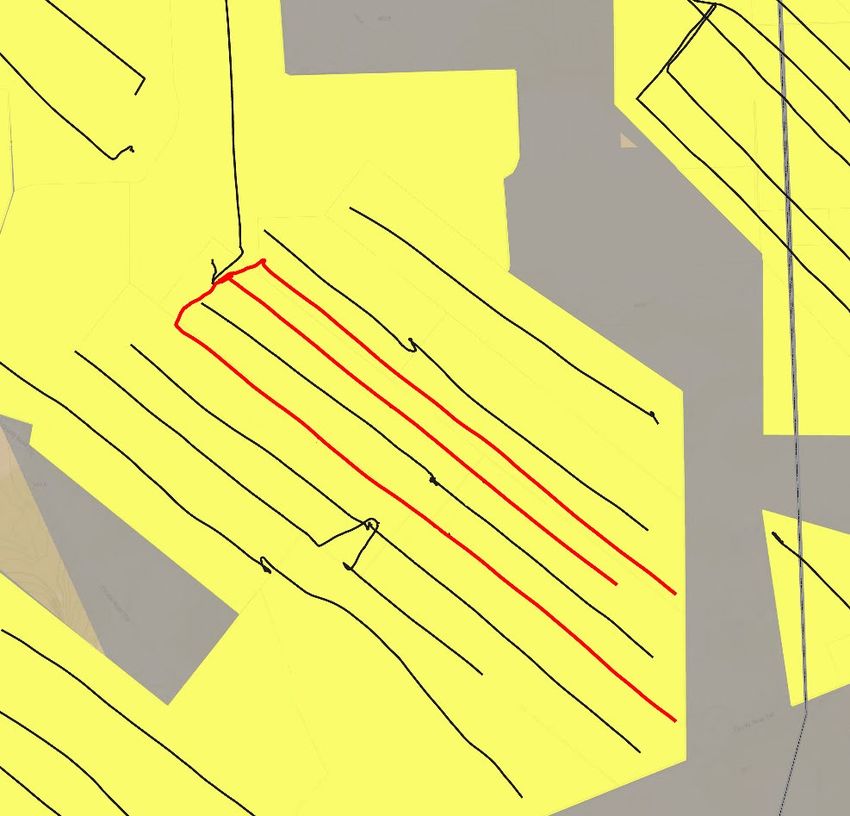
Forward-Looking and Cautionary Statements

Forward-Looking and Cautionary Statements
This presentation contains certain "forward-looking" statements within the meaning of Section 27A of the Securities Act of 1933, as amended, and Section 21E of the Securities Exchange Act of 1934, as amended. Statements that are not historical facts are forward-looking statements, and
such statements include, words such as "anticipate," "guidance," "assumptions," "projects," "forward," "estimates,” "outlook,” "expects,” "continues,” "intends,” "plans,” "believes,” "future,” "potential,” "may,” "foresee,” "possible,” "should,” "would,” "could," “focus” and variations of
such words or similar expressions, including the negative thereof, to identify forward-looking statements. Because such statements include assumptions, risks, uncertainties, and contingencies, actual results may differ materially from those expressed or implied by such forward-looking
statements. These risks, uncertainties and contingencies include, but are not limited to, the following: risks related to the proposed acquisition of Lonestar, including the risk that acquisition will not be completed on the timeline or terms currently contemplated, that the benefits of the
acquisition may not be fully realized or may take longer to realize than expected, and that management attention will be diverted to transaction-related issues; risks related to the recently completed transactions with Juniper, including the risk that the benefits of the transactions may not be
fully realized or may take longer to realize than expected, and that management attention will be diverted to integration-related issues; risks related to potential and completed acquisitions, including related costs and our ability to realize their expected benefits; the decline in, sustained market
uncertainty of, and volatility of commodity prices for crude oil, natural gas liquids, or NGLs, and natural gas; the impact of the COVID-19 pandemic, including reduced demand for oil and natural gas, economic slowdown, governmental actions, stay-at-home orders, interruptions to our
operations or our customer's operations; risks related to and the impact of actual or anticipated other world health events; our ability to satisfy our short-term and long-term liquidity needs, including our ability to generate sufficient cash flows from operations or to obtain adequate financing,
including access to the capital markets, to fund our capital expenditures and meet working capital needs; our ability to access capital, including through lending arrangements and the capital markets, as and when desired; negative events or publicity adversely affecting our ability to maintain
our relationships with our suppliers, service providers, customers, employees, and other third parties; plans, objectives, expectations and intentions contained in this presentation that are not historical; our ability to execute our business plan in volatile and depressed commodity price
environments; our ability to develop, explore for, acquire and replace oil and gas reserves and sustain production; changes to our drilling and development program our ability to generate profits or achieve targeted reserves in our development and exploratory drilling and well operations; our
ability to meet guidance, market expectations and internal projections, including type curves; any impairments, write-downs or write-offs of our reserves or assets; the projected demand for and supply of oil, NGLs and natural gas; our ability to contract for drilling rigs, frac crews, materials,
supplies and services at reasonable costs; our ability to renew or replace expiring contracts on acceptable terms; our ability to obtain adequate pipeline transportation capacity or other transportation for our oil and gas production at reasonable cost and to sell our production at, or at reasonable
discounts to, market prices; the uncertainties inherent in projecting future rates of production for our wells and the extent to which actual production differs from that estimated in our proved oil and gas reserves; use of new techniques in our development, including choke management and
longer laterals; drilling, completion and operating risks, including adverse impacts associated with well spacing and a high concentration of activity; our ability to compete effectively against other oil and gas companies; leasehold terms expiring before production can be established and our
ability to replace expired leases; environmental obligations, costs and liabilities that are not covered by an effective indemnity or insurance; the timing of receipt of necessary regulatory permits; the effect of commodity and financial derivative arrangements with other parties, and
counterparty risk related to the ability of these parties to meet their future obligations; the occurrence of unusual weather or operating conditions, including force majeure events; our ability to retain or attract senior management and key employees; our reliance on a limited number of
customers and a particular region for substantially all of our revenues and production; compliance with and changes in governmental regulations or enforcement practices, especially with respect to environmental, health and safety matters; physical, electronic and cybersecurity breaches;
uncertainties relating to general domestic and international economic and political conditions; the impact and costs associated with litigation or other legal matters; sustainability initiatives; and other risks set forth in our filings with the SEC, including our most recent Annual Report on Form
10-K and subsequent Quarterly Reports on Form 10-Q. Additional Information concerning these and other factors can be found in our press releases and public filings with the SEC. Many of the factors that will determine our future results are beyond the ability of management to control or
predict. In addition, readers should not place undue reliance on forward-looking statements, which reflect management's views only as of the date hereof. The statements in this presentation speak only as of the date of the presentation. We undertake no obligation to revise or update any
forward-looking statements, or to make any other forward-looking statements, whether as a result of new information, future events or otherwise, except as may be required by applicable law. Expected results of the completed period are preliminary and subject to change until published in
our Quarterly Report on Form 10-Q filed with the SEC.
Definitions – Special Note on PV-10 Calculations
Proved reserves are those quantities of oil and gas which, by analysis of geosciences and engineering data, can be estimated with reasonable certainty to be economically producible from a given date forward, from known reservoirs, and under existing economic conditions, operating
methods and government regulation before the time at which contracts providing the right to operate expire, unless evidence indicates that renewal is reasonably certain, regardless of whether the estimate is a deterministic estimate or probabilistic estimate. Proved developed reserves are
proved reserves that can be expected to be recovered: (a) through existing wells with existing equipment and operating methods or in which the cost of the required equipment is relatively minor compared with the cost of a new well; or (b) through installed extraction equipment and
infrastructure operational at the time of the reserves estimate if the extraction is means not involving a well. EUR is a measure that by its nature is more speculative than estimates of reserves prepared in accordance with SEC definitions and guidelines and accordingly is less certain. Proved
developed producing and total proved reserves for PVAC presented herein are based on reserve reports from DeGolyer and MacNaughton (“D&M”) as of 7/1/2021 and 4/1/2021, respectively (the “D&M reports”). Proved reserves for LONE presented herein are based on a reserve report
from W.D. Von Gonten & Co. (“WDVG”) as of 1/1/2021 (the “WDVG Report”). PV-10 of PVAC is based on such D&M reports as of 06/30/21 and updated for strip pricing as of 7/9/21. PV-10 of LONE is based on the WDVG Report as of 01/01/21 and adjusted by PVAC management
for actual production, lease operating and transportation costs through 07/01/21 as well as the revised actual and anticipated development plans post-07/01/21, and using strip pricing as of 7/9/21. These “PV-10” metrics represent estimates for illustrative purposes and is a non-GAAP
measures.
Cautionary Statements
The estimates and guidance presented in this presentation, including those regarding inventory of drilling locations and expected free cash flow, are based on assumptions of capital expenditure levels, prices for oil, natural gas and NGLs, current indications of supply and demand for oil, well
results and operating costs. The guidance, estimates and type curves provided or used in this presentation do not constitute any form of guarantee or assurance that the matters indicated will be achieved. Statements regarding inventory are based on current information, assumptions regarding
well costs, the drilling program and economics and are subject to material change. The number of locations shown as being in the Company’s current estimated inventory or estimated combined inventory is not a guarantee of the number of wells that will actually be drilled and completed or
the results or return that will be achieved. While we believe these estimates and the assumptions on which they are based are reasonable, they are inherently uncertain and are subject to, among other things, significant business, economic, operational and regulatory risks and uncertainties and
are subject to material revision. Actual results may differ materially from estimates and guidance.
Information presented about the two companies on a combined basis is not meant to be a representation of the combined business or performance of the companies following the closing of the Proposed Merger.
Non‐GAAP Financial Measures
This presentation contains references to certain non‐GAAP financial measures. The non-GAAP financial measures presented may not provide information that is directly comparable to that provided by other companies, as other companies may calculate such financial results differently.
Penn Virginia’s or Lonestar’s non-GAAP financial measures are not measurements of financial performance under GAAP and should not be considered as alternatives to amounts presented in accordance with GAAP. Penn Virginia or Lonestar views these non-GAAP financial measures as
supplemental and they are not intended to be a substitute for, or superior to, the information provided by GAAP financial result.
More Information Regarding LONE’s Non-GAAP Measures
We have included certain of LONE’s non-GAAP measures in this presentation, but we have not sought to independently verify this financial information. No assurance can be given of this information’s accuracy or the accuracy and completeness of the reconciliations to the most directly
comparable GAAP measures provided in LONE’s publicly available disclosures.
Net Debt, excluding unamortized discount and debt issuance costs, is a non-GAAP financial measure that is defined as total principal amount of long-term debt less cash and cash equivalents. LONE’s principal amount of long-term debt used to calculate Net Debt excludes its non-recourse
mortgage on its corporate office building and the PPP loan for which funds are fully reserved as restricted cash to cover the balance. LTM Leverage, a non-GAAP measure, is defined as Net Debt divided by Adjusted EBITDAX. The ratios are derived from the historical periods as reported
in the respective Quarterly Reports on Forms 10-Q and Annual Report on Form 10-K for the relevant periods and include the use of preliminary estimates for the second quarter 2021. With respect to LONE’s LTM Leverage at June 30, 2021, the ratio includes five months of the Predecessor
period prior to emerging from bankruptcy and seven months of the successor period following the emergence (the predecessor and successor periods are defined as reported in Lonestar’s Form 10-K for the year ended December 31, 2020). For the second quarter 2021, LONE’s Net Debt and
the mid-point of its guidance for Adjusted EBITDAX was used. We have not reconciled the components of LONE’s LTM Leverage, Net Debt and Adjusted EBITDAX, to the most comparable GAAP measure. This reconciliation would require unreasonable efforts as the amounts are
currently based on Wall Street Research as of 07/07/21, and LONE’s actual results for this period are not yet available.

                                                                                                                                                                                                                                                                                                        3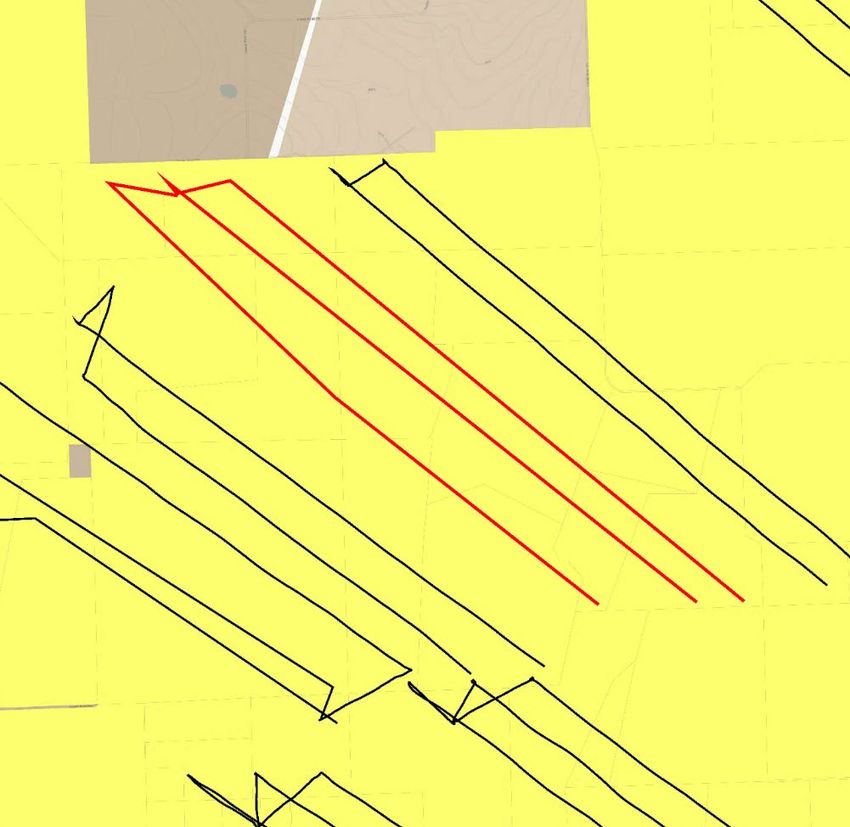
PVAC Investment Thesis

               Strong PDP       High       Strong                    Advantaged
 Premier Oil                                          Leadership
                Base with     Margin /    Balance                  Regulatory and
  Weighted                                              in ESG
               Substantial   Improving    Sheet /                   Infrastructure
   Asset
                Inventory    Efficiency   Liquidity                    Position

   Focused on Cash-on-Cash Returns and Committed to Continuous Improvement

                                                                                4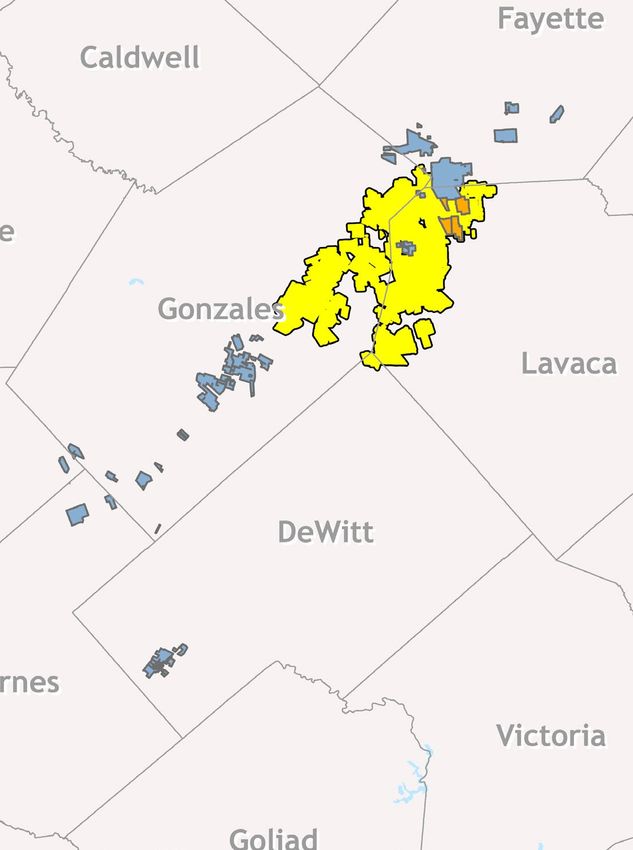
Company Overview
 Premier Oil                     Strong PDP Base with                              High Margin /                            Strong Balance                       Leadership                     Advantaged Regulatory
Weighted Asset                   Substantial Inventory                          Improving Efficiency                        Sheet / Liquidity                      in ESG                      and Infrastructure Position

•    NASDAQ: PVAC – Enterprise Value: $1,025 MM(1)
                                                                                                                                                                                         Eagle Ford
•    102,400 gross (90,400 net) acres(2) in Gonzales, Fayette, Lavaca and DeWitt
     counties; ~100% Operated; 91% HBP
•    Approximately 500 identified drilling locations in inventory with significant
     identified upside potential
      − 500 locations estimated to average 50%+ well level IRR at $60/bbl WTI(3)
      − Two-thirds of locations estimated to average 65%+ well level IRR at
         $60/bbl WTI(3)
•    2Q21 sales: 20,117 bbl/d and 24,844 boe/d; 81% oil / 92% liquids                                                                                                                                                    Houston (HQ)

•    Top quartile Adjusted EBITDAX(4)(5) margins
•    Net Debt(4) to LTM adjusted EBITDAX(4) ~1.3x(6)
•
                                                                                                                                                                            Oil
     Advantaged regulatory position                                                                                                                                         Condensate

     − No Federal acreage; Assets on private fee lands in Texas                                                                                                             Gas

•    Located close to Gulf Coast Markets (MEH/LLS)
     − Advantaged pricing and market access
                                                                                                    $49.78/WTI $2.43/MMBtu                                           $60/WTI $2.75/MMBtu
                           Reserves Summary ($MM)
                                                                                                         SEC Pricing (7)                                                  Pricing (7)
                 Proved Developed (“PD”) PV-10(4)                                                                     $818                                                         $1,055
                 PD PV-10 to Net Debt(4)(8)                                                                            2.4x                                                          3.2x
1) Net debt as of 06/30/21, share price as of 07/28/21 and shares of common stock and common stock equivalents outstanding of 37,861,271 as of June 30, 2021 (as further described in the 2nd quarter 2021 Form 10-Q).
2) As of 06/30/21.
3) Estimated well level returns based on D&M type curves as of 01/01/21.
4) Adjusted EBITDAX, as further adjusted for the Juniper Transaction ($3.5 MM), Net Debt and PV-10 are non-GAAP financial measures that are defined and reconciled in the appendix of this presentation.
5) Source: FactSet. Companies include: APA, AR, BATL, BCEI, BRY, CDEV, CLR, CNX, COG, CPE, CRK, DVN, EOG, EQT, ESTE, FANG, LPI, MCF, MGY, MTDR, NOG, PDCE, PXD, RRC, SBOW, SM, SWN, WLL and XEC for 2020
   and first quarter of 2021.
6) Leverage ratio is calculated by dividing Net Debt as of 06/30/21 by LTM Adjusted EBITDAX as of 06/30/21 as adjusted for the Juniper transaction.
                                                                                                                                                                                                                                5
7) Based on reserve report from D&M as of 06/30/21.
8) Net Debt as of 06/30/21.
Lonestar Acquisition Overview
Premier Oil Strong PDP Base with High Margin / Strong Balance Leadership Advantaged Regulatory
Weighted Asset Substantial Inventory Improving Efficiency Sheet / Liquidity in ESG and Infrastructure Position
All-stock transaction at 0.51x exchange ratio; pro forma projected shares outstanding: 43.7 MM(1)
PVAC shareholders retain approximately 87% ownership of pro forma company
Consideration
and Financing PVAC will assume LONE outstanding Net Debt of $236 million(2) as of 06/30/21
Priced $400 MM Senior Unsecured Notes in escrow to repay LONE debt and PVAC existing
second lien term loan upon closing of LONE acquisition
Existing Penn Virginia management team
Leadership and
Governance One LONE director will be appointed to PVAC Board of Directors
Unanimously approved by PVAC and LONE Boards of Directors
Approvals
~80% of LONE and ~60% of PVAC equity owners have executed voter support agreements
and Timing
Transaction is expected to close in the second half of 2021
1) Includes common share equivalent securities.
2) Excludes LONE’s non-recourse mortgage on its corporate office building.
6
.
Highly Accretive Offset Operator Consolidation
Premier Oil Strong PDP Base with High Margin / Strong Balance Leadership Advantaged Regulatory
Weighted Asset Substantial Inventory Improving Efficiency Sheet / Liquidity in ESG and Infrastructure Position
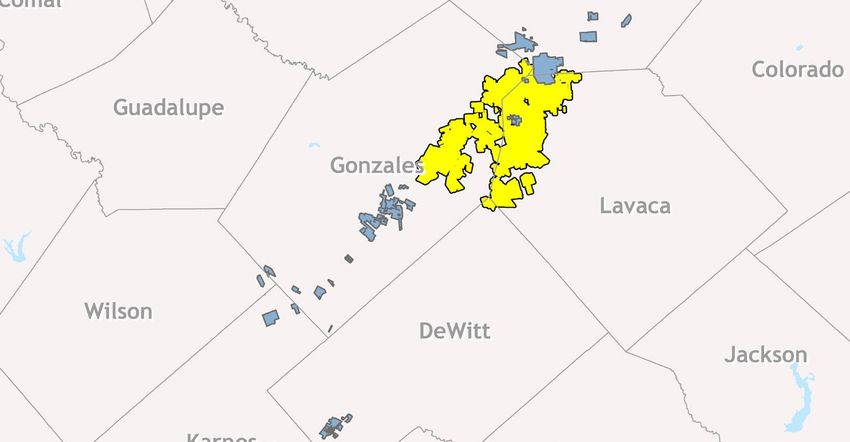
Contiguous position conducive to operational Complementary Assets
and G&A synergies expected to exceed $20MM
Strategic Fit and per year Legend
Additional Scale
Adds 13 Mboe/d resulting in 38 Mboe/d
Penn Virginia Acreage
Recent Rocky Creek Acquisition
combined sales(1) Lonestar Resources Acreage
Attractive Transaction value represents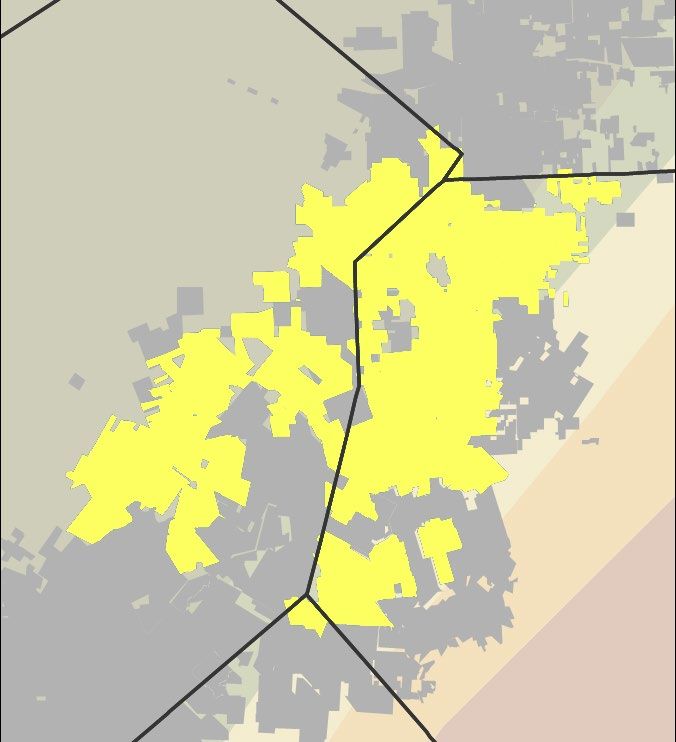
Lonestar Assets
 Premier Oil                        Strong PDP Base with                                  High Margin /                               Strong Balance            Leadership         Advantaged Regulatory
Weighted Asset                      Substantial Inventory                              Improving Efficiency                           Sheet / Liquidity           in ESG          and Infrastructure Position

•     Current Sales: 13 Mboe/d(1) (70% Liquids)                                                                                                                    Central Area

                                                                                                                                 3 well (Hawkeye 33H, 34H, and 35H) Pad

•     PDP PV-10 Value at 7/01/21: $389                                           MM(2)
                                                                                                                                 11,080’ laterals
                                                                                                                                 TIL 2/21/2021
                                                                                                                                 Avg IP-30 825 bbl/d and 369 Mcf/d

•     Total Proved PV-10 Value at 7/01/21 : $700 MM(2)

•     Net Acreage: ~53,000(3)
                                                                                                                                                                                             Legend

•     Estimated Gross Drilling Locations: ~250
                                                                                                                                                                                        PVAC Acreage
                                                                                                                                                                                        LONE Acreage

                                           Southern Area                                                                                                          Northern Area

                                                                           2 well (Horned Frog W 1H and 2H) Pad
                                                                           7500’ laterals
                                                                           TIL 4/23/2021
                                                                           Avg IP-30 650 bbl/d and 2.5 MMcf/d

                                                                                                                                                                                             Legend
                                                               2 well (Horned Frog Alderman A1H and B2H) Pad
                                                               12,000’ laterals                                                                                                          LONE Acreage
                                                               TIL 6/17/2021                                                                                                             Hawkwood
                                                               Avg Peak IP-24 913 bbl/d and 6.4 MMcf/d                                                                                   Acreage

1) Represents June 2021 net sales with 6:1 gas equivalents.
2) See page 3 "Definitions - Special Note About PV-10" for information regarding the calculation of Lonestar's PV-10 as shown here.                                                                      8
3) As of March 31, 2021.
Complementary Scale and Strong Financial Metrics
 Premier Oil                       Strong PDP Base with                              High Margin /                             Strong Balance                        Leadership                     Advantaged Regulatory
Weighted Asset                     Substantial Inventory                          Improving Efficiency                         Sheet / Liquidity                       in ESG                      and Infrastructure Position

                                                                                            PVAC Standalone                                                                            PVAC + LONE

            Net Acreage(1)                                                                           ~90,000                                                                                  ~143,000

            Current Sales(2)                                                                    25 Mboe/d                                                                                  38 Mboe/d

            Proved Reserves(3)                                                                137 MMboe                                                                                  219 MMboe

            Gross Inventory                                                                                ~500                                                                                       ~750

            Shares Outstanding (4)                                                                  37.9 MM                                                                                    43.7 MM

            PD PV-10 – 07/01/21(8)                                                                $~1.1 B(5)                                                                                 $~1.5 B(6)

            Net Debt @ 06/30/21(8)                                                                 $334 MM                                                                                 $570 MM(7)

            Estimated LTM Leverage(9)                                                                    ~1.3x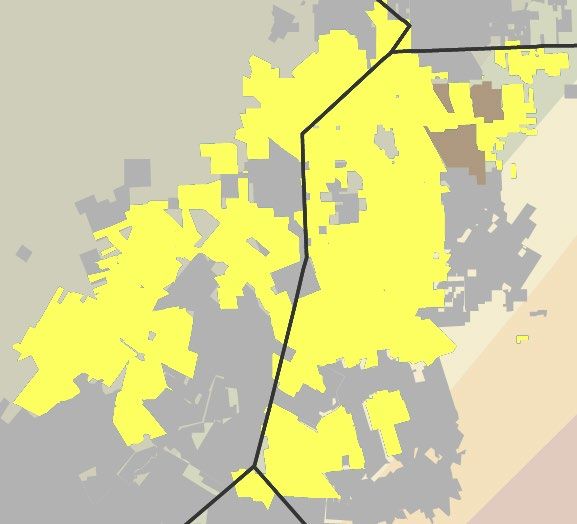
Anticipated Synergies – Significant Value Creation
 Premier Oil                  Strong PDP Base with                         High Margin /         Strong Balance      Leadership                    Advantaged Regulatory
Weighted Asset                Substantial Inventory                     Improving Efficiency     Sheet / Liquidity     in ESG                     and Infrastructure Position

•
                                                                                                                                       Gonzales
     Complementary assets allow for significant synergies
           −      G&A/Corporate
           −      Operating Costs
                                                                                                                                                        Lavaca

           −      Capital Expenditures
           −      Marketing/Midstream
           −      Financing Costs
                                                                                                                                                     PVAC Acreage
           −      Total expected to exceed $20 million per year                                                                                      LONE Operated Leases
                                                                                                                                                     Moulton Area

•    Adjacent Moulton acreage adds over 45,000 net                                                                                                   Potential Locations
                                                                                                                                                     Surface Drilling Pads
     lateral feet
           −      Incremental PV-10 of $33 MM(1) on ~770 net acres
           −      Equivalent of >5 long lateral wells
           −      Longer laterals enhance capital efficiencies

•    ESG Synergies
           −      More wells connected to pipelines reduces flaring
           −      Shared facilities reduces footprint
                                                                                                                      0’
                                                                                                                           FEET
                                                                                                                              1,235’

                  Combined Acreage Footprint Provides Significant Operational Synergies
1) Expected PV-10 based on PVAC’s internal management estimates with 07/09/2021 strip pricing.
                                                                                                                                                                             10
Strong PDP Base
Premier Oil Strong PDP Base with High Margin / Strong Balance Leadership Advantaged Regulatory
Weighted Asset Substantial Inventory Improving Efficiency Sheet / Liquidity in ESG and Infrastructure Position
Strong PDP Base with Substantial Inventory
• Concentrated position allows for operational PVAC Wells Drilled
2018
efficiencies 2019
2020
2021
• Proven productivity across acreage position
Peer Wells
Drilled
PVAC Activity
• Expected PDP decline of 34%(1) provides Rig Activity
cash flow and flexibility
• Continually analyzing assets for cost
reductions and efficiency improvements
• Premium sweet crude oil with blended yield
of ~44 degree API gravity
• Strong PD PV-10(2)(3) to Net Debt(3)(4) ratio of
3.2x ACREAGE
PVAC
LONE
EAGLE FORD PEERS
Note: Information provided represents Penn Virginia standalone.
1) Based on expectations from type curves as set forth in 2020 YE D&M Reserve Report. Decline is calculated from January 2021 to January 2022.
2) Based on reserve report from D&M as of 06/30/21. 11
3) Net Debt and PV-10 are non-GAAP measures reconciled in the appendix of this presentation.
4) Net Debt as of 06/30/21.Exceptional PVAC Well Results and Deep Inventory
Premier Oil Strong PDP Base with High Margin / Strong Balance Leadership Advantaged Regulatory
Weighted Asset Substantial Inventory Improving Efficiency Sheet / Liquidity in ESG and Infrastructure Position
D&M Avg. Oil Type Curve for 2021 and 2022 TILs (bbl/d) Amethyst/Hippo 2-Well Pad
Average IP-30 864 bbl/d TEXAS
Type Curve Assumptions(1) Average CLL 6,647’
10,000
Oil BBL/d Oil IP30 Rate (bbl/d) ~900 Fayette
EUR (Mboe) ~625
NAB Hunter/Nevels Addax 2-Well Pad
Wells TIL YTD Actual Avg IP-30 Capex ($MM) (2) $6.25
* Normalized for Lateral Length
Average IP-30 1,019 bbl/d
1,000 Average LL (ft) ~8,300 Average CLL: 7,904
~1,040 bbl/d
Well Level IRR @ $60 ~73%
% Oil ~80%
Avg. WI% ~82% Aquamarine 4-Well Pad
100 Avg. NRI% ~64% Average IP-15 857 bbl/d
Average CLL: 4,884’
10 Emerald 2-Well Pad
0 10 20 30 40 50 60 70 80 90 100 110 Average IP-30 1,012 bbl/d
Matocha
Months Average CLL: 10,887’
1H: IP-30 1,248 bbl/d
CLL: 8,580’
2020 Outperformance and Future Inventory
• D&M total inventory of ~500 locations (only Lower Eagle Ford)
− Two-thirds of locations estimated to average 65%+ well level IRR at Reffenshack/Rhino 4-Well Pad
$60/bbl WTI(3) Average IP-30 933 bbl/d
− 500 locations estimated to average 50%+ well level IRR at $60/bbl WTI(3) Gonzales Average CLL: 7,639’
Lavaca
• Substantial inventory upside (+150 locations ) from Upper Eagle Munson Ranch 3-Well Pad
Average IP-30 1,109 bbl/d
Ford, Austin Chalk, down spacing results and non-operated wells Average CLL: 6,971’ Blonde Unit
• 2H: IP-30 1,040 bbl/d ACREAGE
2020 spud wells currently outperforming D&M projections by CLL: 5,920’ PVAC
Southern Bock (PSA)
~14% on a cumulative basis A1H: IP-30 1,676 bbl/d
LONE
De Witt EAGLE FORD PEERS
• Relatively open undrilled lease geometries allow for long laterals
CLL:6,381’
B2H: IP-30 1,405 bbl/d
and efficient multi-well pads CLL: 8,349’
1) Type curve assumptions are estimates based on 2020 YE D&M Reserve Report and on management’s internal estimates as of 07/09/21.
2) Capital expenditure assumptions include Drilling, Completion, Facilities, and Tie-in expenditures. Average Drilling and Completion capital of ~$5.75 MM per well plus $0.5 MM for Facilities and Tie-in expenditures for Total Capex of $6.25 MM. 12
3) Estimated well level returns based on D&M type curves as of 01/01/21.Northeast Acreage Provides Significant Inventory
Premier Oil Strong PDP Base with High Margin / Strong Balance Leadership Advantaged Regulatory
Weighted Asset Substantial Inventory Improving Efficiency Sheet / Liquidity in ESG and Infrastructure Position
Adjacent Acreage, Attractive Well-level Economics, Substantial Inventory
Fayette
Gonzales
Svatek
12 Mo. Cum.
Lavaca
>155 Mbo
CLL: 6,478’
Significant Future Inventory
• Ample running room for future drilling on high return
Currently Completing
Big Five Pad
oil-weighted inventory
• Acquired contiguous acreage allows for longer laterals
and significant operating synergies PVAC Acreage
• ~100 inventory locations (Combined Company)(1) LONE Acreage
Recently Acquired
− Average lateral length of ~8,400’ RCR Acreage
− Estimated IRR >70%(2) Drilled After 2018 Matocha
Big Five Wells 1H: IP-30 1,248 bbl/d; 1.7 MMcf/d
− 45 API gravity oil, 1,300 GOR
CLL: 8,580’
− Estimated total well costs of $7.3 MM
1) Based on PVAC current internal estimates.
2) IRR calculated using 8,400 lateral length with flat $60 oil and $2.75 MMbtu. 13Southwest Acreage Provides Significant Opportunity
Premier Oil Strong PDP Base with High Margin / Strong Balance Leadership Advantaged Regulatory
Weighted Asset Substantial Inventory Improving Efficiency Sheet / Liquidity in ESG and Infrastructure Position
Complementary Acreage, Attractive Well Level Economics, Substantial Inventory
Gonzales
Gonzales
Emerald 2-Well Pad
Average IP-30 1,012 bbl/d
Average CLL: 10,887’
Significant Future Inventory
• Ample running room for future drilling on high
return oil-weighted inventory
• Emerald wells tripled IP-30 of legacy wells
• 160 inventory locations (Combined Company)(1)
PVAC Acreage
− Average lateral length of ~9,700’
LONE Acreage
− Estimated IRR >70%(2)
Drilled After 2018
− 35-40 API gravity oil, 600 GOR Emerald Wells
− Estimated total well costs of $6.2 MM
1) Based on PVAC internal estimates.
2) IRR calculated using 9,700 lateral length with flat $60 oil and $2.75 MMbtu. 14Successful Infill and Downspacing
Premier Oil Strong PDP Base with High Margin / Strong Balance Leadership Advantaged Regulatory
Weighted Asset Substantial Inventory Improving Efficiency Sheet / Liquidity in ESG and Infrastructure Position
PVAC Acreage
Gonzales
Previously Drilled
Munson Ranch Wells
Munson Ranch 3-Well Pad
Average IP-30 1,109 bbl/d
Average CLL: 6,971’
Lavaca
PVAC Acreage
Previously Drilled
Reffenshack Wells
• Large number of legacy hybrid gel completions creates
opportunity to access undrained reserves through infill
and downspacing (< 500’ from offset well)
• Similar redevelopment is being deployed by MRO, DVN,
and others, producing strong results
Reffenshack 3-Well Pad
Average IP-30 985 bbl/d • Recent Munson Ranch and Reffenshack wells
Average CLL: 8,353’ demonstrate strong performance around legacy wells
• Improved parent well production by 30+%
• Average new well estimated IRR >100+%(1)
Successful Downspacing Around Early-Vintage Wells Provides Upside Potential
1) IRR calculated using flat $60 oil and $2.75 MMbtu. 15Continuously Improving Drilling Efficiencies
Premier Oil Strong PDP Base with High Margin / Strong Balance Leadership Advantaged Regulatory
Weighted Asset Substantial Inventory Improving Efficiency Sheet / Liquidity in ESG and Infrastructure Position
Total Well Cost by Spud Date - $/Lateral Foot(1) Total Well Cost per boe of Reserves Developed(1)
Total Well Cost Include Drilling, Completion, Facilities and Tie-in Expenditures Total Well Cost Include Drilling, Completion, Facilities and Tie-in Expenditures
$1,206 $17.49 $17.23
$1,079
$14.25
$875 ~$12.50
~$750
2018 2019 2020 2021E 2018 2019 2020 2021E
1) Reserves based on D&M 2020 YE Reserve Report.
16Committed to Strong Balance Sheet
Premier Oil Strong PDP Base with High Margin / Strong Balance Leadership Advantaged Regulatory
Weighted Asset Substantial Inventory Improving Efficiency Sheet / Liquidity in ESG and Infrastructure Position
No Near-Term Debt Maturities
Net Debt Maturity Profile(1) $MM Capitalization(3)
MM, except share price
Net Revolver Outstanding
$334 Total Stock Outstanding (3) 37.9
2nd Lien Term Loan
Share Price (as of 07/28/2021) $18.25
$189 (2) Market Capitalization (3) $691
Plus: Total Debt (4) $384
$145 Less: Cash (4) ($50)
Enterprise Value $1,025
2020 2021 2022 2023 2024
Nearest maturity occurs in 2024
On July 27, 2021, Penn Virginia priced $400 million of senior unsecured notes (“Notes”) with net proceeds anticipated to be used
to refinance Lonestar’s long-term debt and Penn Virginia’s Second Lien Term Loan. Upon closing the Merger, Penn Virginia’s
capitalization is expected to include the Notes and an upsized revolving credit facility to enhance liquidity.
1) Net Debt as of 06/30/21.
2) Net of cash as of 06/30/21.
3) Assumes the redemption of 225,490 shares of Series A Preferred Stock and 22,548,998 common units in a partnership subsidiary. As of 06/30/21, there were 15,312,273 shares of common stock outstanding. 17
4) As of 06/30/21.Committed to Protecting the Environment
Premier Oil Strong PDP Base with High Margin / Strong Balance Leadership Advantaged Regulatory
Weighted Asset Substantial Inventory Improving Efficiency Sheet / Liquidity in ESG and Infrastructure Position
Minimizing
Reduce flaring by connecting wells to Emissions Intensity by Eagle Ford Operator(1)
natural gas pipelines in advance of
Flaring production
50
Lease operators inspect each well location
daily as the first line of defense to detect
Leak and prevent leaks and emission events
40
Emissions Intensity (Kg C02e/boe)
Detection
and Optical gas imaging cameras scan
production facilities for leaks and conduct
Prevention
voluntary surveys beyond regulatory 30
requirements
Transport majority of crude oil production
20
via pipeline, meaningfully reducing
Transport vehicle emissions
via Pipeline Transport a portion of water via
pipelines, further reducing vehicle 10
emissions
Drilling &
Completion 0
Multi-well pads and longer laterals reduce
Techniques
Company A
Company B
Company C
Company D
Company E
Company F
Company G
Company H
Company I
Company J
Company K
Company L
Company M
Company N
Company O
Company P
Company Q
Company R
Company S
Company T
Company U
Company V
Company W
X
PVAC
Company Y
environmental footprint
and
Well Design
2017 2018 2019
Source: Enverus.
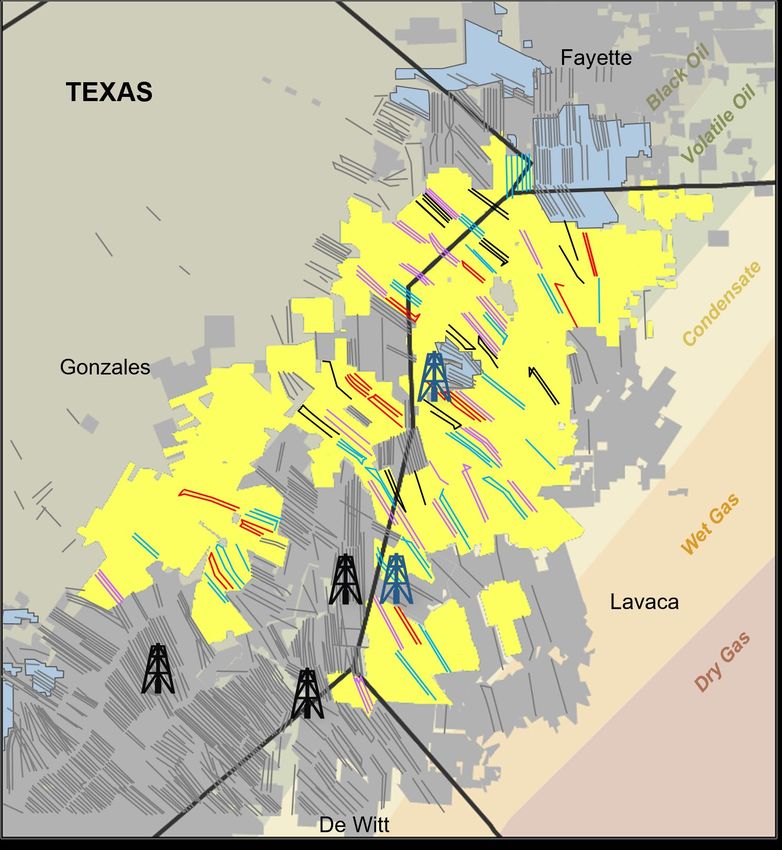
1) Emissions intensity includes combustion equipment, flaring, storage tanks, gas venting and other equipment. 18Substantial Infrastructure – Advantaged Pricing
Premier Oil Strong PDP Base with High Margin / Strong Balance Leadership Advantaged Regulatory
Weighted Asset Substantial Inventory Improving Efficiency Sheet / Liquidity in ESG and Infrastructure Position
Location Close to Coast with Attractive Sales Points
2Q21 Sales Mix 10
•
Caldwell
35 Fayette
610
2Q21 Sales: 81% Oil; Colorado Chambers
Fort Bend
10
92% Liquids
8% Gonzales Lavaca
•
45
Receives MEH Pricing, 81%
11% Wharton
Premium Over WTI and Wilson
Brazoria
Midland De Witt
Jackson
• Realized $52.70 per bbl in
Karnes
Victoria
Matagorda
2Q21(1) Goliad
Freeport
• Blended Oil Yields Bee Calhoun
LNG Facility
~44 Degree API Gravity Oil Live Oak Refugio To San Antonio To Houston
NGLs 37 Acreage
PVAC
10
Natural Gas San
Patricio
Oil Pipelines Fayette
Nuevo – Dewitt Line
Nuevo – Main Gathering
Gas Pipelines
Jim Wells Nueces ETC Lines
LLS vs. WTI vs. MEH and Midland Pricing Kinder Morgan Lines
PVAC Gathering Lines
Corpus Christi
Corpus Starwood Lines
Christi
$2 Kleberg
LNG Facility
Lavaca
LLS
$1 $0.65 Brooks
Kenedy Gonzales
MEH
$0.35
$0
WTI Mid
$-0.07 Hidalgo
De Witt
April '21 May '21 Jun '21 Willacy
-$1
Note: Map data provided by and used with permission of Hart Energy Mapping and Data Services, LLC.
1) Realized oil price, including effects of derivatives, net is a non-GAAP measure. Definitions of non-GAAP financial measures and reconciliations of non-GAAP financial measures to the closest GAAP-based financial measures
appear at the end of this release.
19Advantaged Regulatory Position
Premier Oil Strong PDP Base with High Margin / Strong Balance Leadership Advantaged Regulatory
Weighted Asset Substantial Inventory Improving Efficiency Sheet / Liquidity in ESG and Infrastructure Position
State of Texas one of the friendliest to oil and gas industry
Operating Long track record of treating mineral rights as firm property rights
Environment
Landowners are often mineral rights owners, incentivized to allow access and development
No federal acreage exposure
Acreage ~100% private landholder leases
91% held by production status
Direct access to Gulf Coast markets
Infrastructure Minimizes dependency on interstate federal regulated infrastructure
Limited infrastructure permitting risk
Robust infrastructure and processing facilities reduce need for flaring
Vast majority of production on pipeline, limiting emissions and spill occurrence
Optical gas imaging cameras used to scan production facilities for leaks as part of leak
Emissions
detection and repair program
Emission control equipment, such as vapor recovery towers (VRT), combustors, and
low-pressure flares, that minimize natural gas flaring
20Further Consolidation Potential
• Numerous sub-scale operators in the Eagle
Operator Concentration by Basin
Ford basin creates a robust set of potential Bubble Size represents average boe/d per Operator(1)
opportunities
4.0
• Focused on increasing efficiencies with
scale and enhancing inventory
Operators
•
Operators
Penn Virginia is committed to maintaining 3.0
disciplined approach to evaluating any Delaware
potential transaction
Active
Active
Top 50 Public and Private Operator
from
Midland
MMboe from
2.0
Production in the Eagle Ford(1)(2)
2021 MMboe/d
Public Marcellus
Private
Pro Forma PVAC Production(1)(3) Q1 2021
Bakken
1.0
40,000
Gross boe/d
Haynesville
Q1
Eagle Ford
30,000
DJ
20,000
0.0
10,000 0 10 20 30 40 50 60 70
--
Active Operators (More than 36 wells drilled since 1/1/2017)
Source: Enverus.
1) Represents 20:1 gas equivalents.
2) Represents gross operated production between 01/01/21 and 03/31/21 of public and private operators in the Eagle Ford.
21
3) Represents gross production for June 2021.3Q21 Guidance
o 3Q21 guidance assumes Penn Virginia standalone
o 4Q21 guidance dependent on timing of Lonestar acquisition Sales 3Q21
closing Oil Sales - bbl/d 20,000 – 20,600
o Strong realized price for oil and natural gas production
o Maintain current 2-rig program while closely monitoring commodity
prices and costs
Realized Pricing Differentials 3Q21
o Will continue to monitor service cost environment with goal of Oil (WTI, per bbl) $(3.00) - $(2.00)
ensuring capital program generates robust returns and free cash flow
Natural gas (HHub, per MMBtu) $(0.10) - $0.10
o D&C Capex between $56 MM and $64 MM for 3Q21
− Approximately $1 MM of land, facilities and other
Direct Operating Expense 3Q21
o Consistently low per BOE operating costs Lease Operating Expense (per boe) $4.65 - $4.85
GPT Expense (per boe) $2.50 - $2.70
o Focus on returns and capital efficiency
Ad Valorem and production taxes 6.3% - 6.8%
o Continue Free Cash Flow(1) generation
Adj. Cash G&A expense (per boe) $2.90 - $3.20
Focused on Cash-on-Cash Returns and Committed to Continuous Improvement
Note: Guidance as of August 3, 2021. All guidance are estimates as of the date hereof and is subject to change without notice depending upon a number of factors, including commodity prices, industry conditions and other factors that are beyond
the Company’s control. The Company undertakes no obligation to affirm or update its guidance.
1) Free cash flow is a non-GAAP financial measure. Definitions of non-GAAP financial measures and reconciliations of non-GAAP financial measures to the closest GAAP-based financial measures appear in the appendix of this presentation. 22PVAC Investment Thesis
Strong PDP High Strong Advantaged
Premier Oil Leadership
Base with Margin / Balance Regulatory and
Weighted in ESG
Substantial Improving Sheet / Infrastructure
Asset
Inventory Efficiency Liquidity Position
Focused on Cash-on-Cash Returns and Committed to Continuous Improvement
23Appendix
Commodity Hedge Summary – Quarterly(1)

                      PVAC                  3Q21     4Q21     1Q22     2Q22     3Q22     4Q22     1Q23     2Q23     3Q23     4Q23     1Q24
Hedges
 WTI Swaps (bbl/d)                          1,902     815       –        –        –        –        –        –        –        –        –
 WTI Average Fixed Price ($/bbl)            $59.95   $45.54     –        –        –        –        –        –        –        –        –

 WTI Collars (bbl/d)                        14,130   13,043   7,083    6,181    4,484    4,484    2,917    2,885      –        –        –
 WTI Average Purchased Put ($/bbl)          $44.27   $47.75   $44.71   $45.33   $40.00   $40.00   $40.00   $40.00     –        –        –
 WTI Average Sold Call ($/bbl)              $59.21   $59.19   $58.05   $57.23   $52.47   $52.47   $50.00   $50.00     –        –        –

 WTI Purchased Puts (bbl/d)                 1,630    1,630      –        –        –        –        –        –        –        –        –
 WTI Average Purchased Put ($/bbl)          $55.00   $55.00     –        –        –        –        –        –        –        –        –

 WTI CMA Roll Swaps (bbl/d)                 17,935   17,935   6,667    6,593      –        –        –        –        –        –        –
 WTI CMA Roll Average Fixed Price ($/bbl)   $0.17    $0.17    $0.63    $0.63

 HH Collars (MMbtu/d)                       9,783    9,783      –      13,187   13,043   13,043     –      11,538   11,413   11,413   11,538
 HH Average Purchased Put ($/MMbtu)         $2.61    $2.61      –      $2.50    $2.50    $2.50      –      $2.50    $2.50    $2.50    $2.50
 HH Average Sold Call ($/MMbtu)             $3.12    $3.12      –      $3.22    $3.22    $3.22      –      $2.68    $2.68    $2.68    $3.65

 HH Sold Puts (MMbtu/d)                     6,522    6,522      –        –        –        –        –        –        –        –        –
 HH Average Sold Put Strike ($/MMbtu)       $2.00    $2.00      –        –        –        –        –        –        –        –        –

 Ethane Swaps (gal/d)                       35,870     –        –      28,022   27,717   27,717     –      98,901     –        –        –
 Ethane Average Fixed Price ($/gal)         $0.23      –        –      $0.25    $0.25    $0.25      –      $0.23      –        –        –

                      LONE
Hedges
 WTI Swaps (bbl/d)                          5,650    5,400    3,250    3,000    3,000    3,000    1,500    1,400    1,350    1,200      –
 WTI Average Fixed Price ($/bbl)            $46.62   $46.03   $47.63   $46.99   $46.69   $46.76   $53.15   $52.83   $52.62   $52.36     –

 HH Swaps (MMbtu/d)                         16,400   10,700   10,000   5,000    5,000    5,000      –        –        –        –        –
 HH Average Fixed Price ($/MMbtu)           $2.93    $3.05    $2.88    $2.70    $2.70    $2.70      –        –        –        –        –

 1) As of 07/16/21.
                                                                                                                                               25
PVAC Commodity Hedge Summary – Quarterly(1)
PVAC Strike Map 3Q21 4Q21 1Q22 2Q22 3Q22 4Q22 1Q23 2Q23 3Q23 4Q23 1Q24
WTI Call
$50.00 4,348 3,261 2,917 2,885 2,853 2,853 2,917 2,885 – – –
$50.50 1,630 1,630 – – – – – – – – –
$55.00 – 3,261 – – – – – – – – –
$56.80 – – 1,667 1,648 1,630 1,630 – – – – –
$59.10 – – 833 – – – – – – – –
$60.10 1,630 – – – – – – – – – –
$65.00 3,261 – – – – – – – – – –
$69.00 1,630 1,630 – – – – – – – – –
$70.04 1,630 – – – – – – – – – –
$70.30 – – – 1,648 – – – – – – –
$72.00 – 1,630 – – – – – – – – –
$72.05 – 1,630 – – – – – – – – –
$72.85 – – 1,667 – – – – – – – –
WTI Put
$35.00 – – – – – – – – – – –
$36.00 – – – – – – – – – – –
$40.00 7,609 6,522 5,417 4,533 4,484 4,484 2,917 2,885 – – –
$42.00 1,630 1,630 – – – – – – – – –
$50.00 3,261 1,630 – – – – – – – – –
$55.00 3,261 3,261 – – – – – – – – –
$60.00 – – 1,667 1,648 – – – – – – –
$65.00 – 3,261 – – – – – – – – –
WTI Swap
$45.54 815 815 – – – – – – – – –
$70.75 1,087 – – – – – – – – – –
HHUB Call
$2.682 – – – – – – – 11,538 11,413 11,413 –
$2.850 1,087 1,630 – – – – – – – – –
$2.851 1,087 1,630 – – – – – – – – –
$3.220 – – – 13,187 13,043 13,043 – – – – –
$3.250 4,348 6,522 – – – – – – – – –
$3.650 – – – – – – – – – – 11,538
HHUB Put
$2.000 (4,348) (6,522) – – – – – – – – –
$2.500 2,174 3,261 – 13,187 13,043 13,043 – 11,538 11,413 11,413 11,538
$2.660 2,174 3,261 – – – – – – – – –
$2.662 2,174 3,261 – – – – – – – – –
1) As of 07/16/21.
26Reconciliation of GAAP "Net Income" to Non-GAAP
"Adjusted EBITDAX"
Reconciliation of GAAP "Net income (loss)" to Non-GAAP "Adjusted EBITDAX"
Adjusted EBITDAX represents net income (loss) before loss on extinguishment of debt, interest expense, income taxes, impairments of oil and gas properties, depreciation, depletion and amortization
expense and share-based compensation expense, further adjusted to include the net commodity realized settlements of derivatives and exclude the effects of gains and losses on sales of assets, non-cash
changes in the fair value of derivatives, and special items including acquisition, divestiture and strategic transaction costs, organizational restructuring, including severance and other items, executive
retirement costs, other, reorganization items and restructuring expenses. We believe this presentation is commonly used by investors and professional research analysts for the valuation, comparison, rating,
investment recommendations of companies within the oil and gas exploration and production industry. We use this information for comparative purposes within our industry. Adjusted EBITDAX is not a
measure of financial performance under GAAP and should not be considered as a measure of liquidity or as an alternative to net income (loss). Adjusted EBITDAX as defined by Penn Virginia may not be
comparable to similarly titled measures used by other companies and should be considered in conjunction with net income (loss) and other measures prepared in accordance with GAAP, such as operating
income or cash flows from operating activities. Adjusted EBITDAX should not be considered in isolation or as a substitute for an analysis of Penn Virginia’s results as reported under GAAP.
Year Ended December 31,
2Q'21 1Q'21 2Q'21 LTM 2020 2019 2018 2017
(in thousands, except per boe amounts)
Net income (loss) $ 7,596 $ (20,021) $ (391,361) $ (310,557) $ 70,589 $ 224,785 $ 32,662
Adjustments to reconcile to Adjusted EBITDAX:
Loss on extinguishment of debt - 1,231 1,231 - - - -
Interest expense, net 5,303 5,397 25,241 31,257 35,811 26,462 6,392
Income tax (benefit) expense 171 (310) (2,890) (2,303) 2,137 523 (4,943)
Impairments of oil and gas properties - 1,811 358,151 391,849 - - -
Depreciation, depletion and amortization 28,795 23,884 115,499 140,673 174,569 127,961 48,649
Share-based compensation expense 962 2,246 4,685 3,284 4,082 4,618 3,809
(Gain) loss on sales of assets, net - (4) (8) (18) (5) 177 36
Adjustments for derivatives: -
Net losses (gains) 54,227 44,368 126,943 (88,422) 68,131 (37,427) 17,819
Realized commodity settlements, net 1 (19,944) (16,059) (3,925) 93,430 (10,501) (42,447) (4,175)
Adjustment for special items: -
Acquisition, divestiture and strategic transaction costs - 4,655 9,628 4,973 800 3,960 1,340
Organizational restructuring, including severance - 239 1,685 1,446 - - (20)
Executive retirement costs - - - - - 250 -
Other, net - - - - 232 (193) -
Reorganization items, net - - - - - (3,322)
2
Adjusted EBITDAX $ 77,110 $ 47,437 $ 244,879 $ 265,612 $ 345,845 $ 305,347 $ 101,569
Net income (loss) per boe $ 3.36 $ (10.83) $ (47.03) $ (34.95) $ 6.97 $ 28.30 $ 8.64
Adjusted EBITDAX per boe $ 34.11 $ 25.67 $ 29.43 $ 29.89 $ 34.17 $ 38.44 $ 26.88
1
Realized commodity settlements, net includes, as applicable to the period presented: (i) current period commodity derivative settlements; (ii) the impact of option premiums paid or
received in prior periods related to current period production; (iii) the impact of prior period cash settlements of early-terminated derivatives originally designated to settle against
current period production; (iv) the exclusion of option premiums paid or received in current period related to future period production; and (v) the exclusion of the impact of current
period cash settlements for early-terminated derivatives originally designated to settle against future period production.
2
Excludes Adjusted EBITDAX adjustments of approximately $3.5 million attributable to oil and gas properties contributed by Rocky Creek Resources/Juniper.
27Reconciliation of GAAP "Realized prices" to Non-GAAP
"Realized prices, including effects of derivatives, net"
Reconciliation of GAAP "Realized prices" to Non-GAAP "Realized prices, including effects of derivatives, net"
We present our realized prices for crude oil and natural gas, as adjusted for the effects of derivatives, net as we believe these measures are useful to management and stakeholders in determining the
effectiveness of our price-risk management program that is designed to reduce the volatility associated with our operations. Realized prices for crude oil and natural gas, as adjusted for the effects of
derivatives, net, are supplemental financial measures that are not prepared in accordance with generally accepted accounting principles (“GAAP”). The following table presents the calculation of our
non-GAAP realized prices for crude oil and natural gas, as adjusted for the effects of derivatives, net and reconciles to realized prices for crude oil and natural gas determined in accordance with
GAAP:
Three Months Ended S ix Months Ended
June 30, March 31, June 30, June 30,
2021 2021 2020 2021 2020
Realized crude oil prices ($/bbl) $ 63.54 $ 55.76 $ 23.97 $ 60.07 $ 35.42
Effects of derivatives ($/bbl) (10.84) (10.96) 26.40 (10.89) 16.92
Crude oil realized prices, including effects of derivatives, net ($/bbl) $ 52.70 $ 44.80 $ 50.37 $ 49.18 $ 52.34
Realized natural gas liquid prices ($/bbl) $ 18.31 $ 16.95 $ 5.21 $ 17.68 $ 5.69
Effects of derivatives ($/bbl) 0.44 - - 0.04 -
$ 18.75 $ 16.95 $ 5.21 $ 17.72 $ 5.69
Realized natural gas prices ($/M cf) $ 2.70 $ 2.80 $ 1.54 $ 2.75 $ 1.69
Effects of derivatives ($/M cf) 0.01 0.04 0.25 0.02 0.16
Natural gas realized prices, including effects of derivatives, net ($/M cf) $ 2.71 $ 2.84 $ 1.79 $ 2.77 $ 1.85
Aggregate realized prices ($/boe) $ 54.75 $ 47.79 $ 20.00 $ 51.62 $ 29.03
Effects of derivatives ($/boe) (8.82) (8.69) 20.41 (8.76) 13.13
Aggregate realized prices, including effects of derivatives, net ($/boe) $ 45.93 $ 39.10 $ 40.41 $ 42.86 $ 42.16
Effects of derivatives includes, as applicable to the period presented: (i) current period commodity derivative settlements; (ii) the impact of option premiums paid or
received in prior periods related to current period production; (iii) the impact of prior period cash settlements of early-terminated derivatives originally designated to
settle against current period production; (iv) the exclusion of option premiums paid or received in current period related to future period production; and (v) the exclusion
of the impact of current period cash settlements for early-terminated derivatives originally designated to settle against future period production.
28Definition of Net Debt
Net Debt
Net debt, excluding unamortized discount and debt issuance costs is a non-GAAP financial measure that is defined as total principal amount of long-term debt less cash and cash
equivalents. Net debt, as adjusted, calculated on a pro forma basis as of December 31, 2020 and June 30, 2020 to adjust for related impacts of the Juniper Transaction (refer to
footnote 1 below). The most comparable financial measure to net debt, excluding unamortized discount and debt issuance costs under GAAP is principal amount of long-term
debt. Net debt is used by management as a measure of our financial leverage. Net debt, excluding unamortized discount and debt issuance costs should not be used by investors
or others as the sole basis in formulating investment decisions as it does not represent the Company’s actual GAAP indebtedness.
June 30, 2021 March 31, 2021 December 31, 2020 June 30, 2020
1 1
Actual Pro Forma Adjusted Actual Pro Forma Adjusted
(in thousands)
Credit Facility $ 238,900 $ 228,900 $ 314,400 $ 233,900 $ 359,000 $ 278,900
Second Lien facility, excludes unamortized discount and issue costs 144,985 146,860 200,000 148,735 200,000 148,735
Cash and cash equivalents (49,694) (11,868) (13,020) (12,441) (21,945) (21,366)
Net Debt $ 334,191 $ 363,892 $ 501,380 $ 370,194 $ 537,055 $ 406,269
1
Adjustments attributable to the Transaction and debt amendments include (i) prepayments of $80.5 million under the Credit Facility; (ii) prepayments of $51.3 million under the
Second Lien Facility and (iii) transaction expenses of $0.6 million paid in excess of the $150 million received as a capital contribution from Juniper used to fund the prepayments and
transaction expenses.
29Non-GAAP Reconciliation – "PV-10"
Reconciliation of GAAP "Standardized Measure of Discounted Future Net Cash Flows" to Non-GAAP "PV-10"
Non-GAAP PV-10 value is the estimated future net cash flows from estimated proved developed reserves discounted at an annual rate of 10 percent before
giving effect to income taxes. The standardized measure of discounted future net cash flows is the after-tax estimated future cash flows from estimated proved
reserves discounted at an annual rate of 10 percent, determined in accordance with generally accepted accounting principles (GAAP). We use non-GAAP PV-
10 value as one measure of the value of our estimated proved reserves and to compare relative values of proved reserves amount exploration and production
companies without regard to income taxes. We believe that securities analysts and rating agencies use PV-10 value in similar ways. Our management believes
PV-10 value is a useful measure for comparison of proved reserve values among companies because, unlike standardized measure, it excludes future income
taxes that often depend principally on the characteristics of the owner of the reserves rather than on the nature, location and quality of the reserves
themselves.
June 30,
2021
SEC Pricing Flat $60 Pricing
(in millions)
Standardized measure of future discounted cash flows of PD $ 809 $ 1,043
Present value of future income taxes discounted at 10% 9 12
PV-10 of PD reserves $ 818 $ 1,055
Note: Sec pricing: $49.78 and $2.43/MMBtu.
30Reconciliation of PV-10 and Adjusted PV-10 (Non-GAAP) –
Proved Developed Reserves (“PD”)
Reconciliation of PV-10 and Adjusted PV-10 (Non-GAAP) – PD Reserves
Non-GAAP PV-10 value is the estimated future net cash flows from estimated proved reserves discounted at an annual rate of 10 percent before giving effect to income taxes.
The standardized measure of discounted future net cash flows is the after-tax estimated future cash flows from estimated proved reserves discounted at an annual rate of 10
percent, determined in accordance with generally accepted accounting principles (GAAP). We use non-GAAP PV-10 value as one measure of the value of our estimated proved
reserves and to compare relative values of proved reserves amount exploration and production companies without regard to income taxes. We believe that securities analysts
and rating agencies use PV-10 value in similar ways. Our management believes PV-10 value is a useful measure for comparison of proved reserve values among companies
because, unlike standardized measure, it excludes future income taxes that often depend principally on the characteristics of the owner of the reserves rather than on the nature,
location and quality of the reserves themselves.
June 30,
2021
(in millions)
Standardized measure of future discounted cash flows of PD 809
Add: Present value of future income taxes attributable to PD reserves discounted at 10% 9
PV-10 of proved developed reserves $ 818
Add: Adjustment using flat pricing of $60/BBL WTI, $2.75/MMbtu and NGLs as 23% of WTI PD reserves. Differentials of
($3.78) off WTI and ($0.05) off natural gas. 237
Adjusted PV-10 of PD adjusted for pricing and differentials $ 1,055
Note: Sec pricing: $49.78 and $2.43/MMBtu.
31You can also read