VERMILION ENERGY INVESTOR PRESENTATION - APRIL 2021

Page created by Victoria Ferguson
 
CONTINUE READING
VERMILION ENERGY INVESTOR PRESENTATION - APRIL 2021
APRIL 2021

VERMILION ENERGY INVESTOR PRESENTATION
 INTERNATIONALLY DIVERSIFIED | FREE CASH FLOW FOCUSED | ESG LEADERSHIP
VERMILION ENERGY INVESTOR PRESENTATION - APRIL 2021
VERMILION’S KEY ATTRIBUTES

            ►      Unique portfolio of internationally diversified assets
                     o       Exposure to global commodity price benchmarks reduces cash flow volatility
                     o       Will support the return to a dividend capital markets model (over $40/share of dividends from 2003 to early 2020)

            ►      Long history of strong profitability and free cash flow generation
                     o       High margin, low decline assets with strong capital efficiencies
                     o       Generated ~$1.4 billion of FCF from 2016 through 2020
                     o       Vermilion has delivered an average 11% ROACE since inception

            ►      Significant leverage to recovering global commodity prices
                     o       2021E FCF in excess of $350MM at US$60/bbl WTI*
                     o       +US$1/bbl change in oil = +$17MM of FCF**
                     o       +C$1/mmcf change in European natural gas = +$28MM of FCF**

            ►      Compelling investment opportunity
                     o       Currently trading at one of the highest free cash flow yields amongst our peers (over 20%)***

            ►      Industry leader in sustainability and ESG performance
                     o       Focused on ESG for over a decade with continued recognition by independent ESG agencies
* Based on company estimates and commodity strip at March 15, 2021, with flat WTI pricing from March forward, and includes the impact of existing hedges. March 15, 2021 strip pricing: Brent = WTI plus US$2.95/bbl; LSB =
WTI less US$4.40/bbl; TTF $8.22/mmbtu; AECO $2.60/mmbtu; CAD/USD 1.25; CAD/EUR 1.50 and CAD/AUD 0.97. ** Sensitivities are represented on an unhedged basis. *** Based on RBC research (see slide 12).                        2
VERMILION ENERGY INVESTOR PRESENTATION - APRIL 2021
CAPITAL MARKETS SUMMARY

                                     Market Summary
                                     Trading Price (March 31, 2021)                                                                                                    $9.13 (TSX), $7.28 (NYSE)
                                     Ticker Symbol (TSX & NYSE)                                                                                                                                VET
                                     Shares Outstanding (December 31, 2020)                                                                                                           158.7 million
                                     Average Daily Trading Volume (shares)                                                                                   2.5 million (TSX), 1.9 million (NYSE)
                                     Monthly Dividend                                                                                                                        Currently Suspended
                                     Director and Employee Ownership *                                                                                                                          5%
                                     Capital Structure
                                     Market Capitalization                                                                                                                                           $1.5 billion
                                     Enterprise Value                                                                                                                                                $3.6 billion
                                     Net Debt (including net working capital, December 31, 2020) **                                                                                                  $2.1 billion
                                     2021E Net Debt-to-FFO Ratio ***                                                                                                                                       2.5x
                                     2021 Guidance
                                     Production                                                                                                                                    83,000 – 85,000 boe/d
                                     E&D Capital Expenditures                                                                                                                                   $300MM

   OUR INTENT IS TO REINSTATE A DIVIDEND WHEN APPROPRIATE
* Based on fully-diluted shares. ** Net Debt is a non-GAAP measures (see Advisory). *** Based on March 15, 2021 strip and company estimates. 2021 strip at March 15, 2021: Brent (US$/bbl) $64.30; WTI US$61.35/bbl;
LSB = WTI less US$4.40/bbl; TTF $8.22/mmbtu; AECO $2.60/mmbtu; CAD/USD 1.25; CAD/EUR 1.50 and CAD/AUD 0.97. Refer to the “FFO Sensitivity” slide in this presentation for more details on pricing assumptions.
Includes existing hedges.
                                                                                                                                                                                                                       3
VERMILION ENERGY INVESTOR PRESENTATION - APRIL 2021
ESG LEADERSHIP

               Environmental                   Vermilion is committed to reducing the environmental impact of traditional energy production, the enrichment and care of
                                               the communities in which we live and work, and maintaining our strong corporate governance
                                                         ►      CDP Leadership Level rating of “A-”
                                                                   o      Top 10% of oil and gas companies globally in 2020
                                                         ►      SAM's Corporate Sustainability Assessment (CSA)
                                                                   o      Ranked at the top of our peer group in 2020
                                                                   o      Selected for The Sustainability Yearbook 2021, which recognizes that our CSA sustainability performance is within the top 15% of our
                      Social                                              industry (SAM's Upstream Oil & Gas and Integrated category)
                                                         ►      The Globe and Mail, Board Games
                                                                   o      Ranked 5th amongst our peer group, 7th amongst Canadian oil and gas companies, and within the second quartile of all companies in the
                                                                          S&P/TSX Composite Index in 2020
                                                         ►      MSCI ESG Research
                                                                   o      “AA” ESG Rating in 2020*
                                                         ►      Institutional Shareholder Services (ISS) QualityScore
                 Governance                                        o      Recognized as a leader in managing risk in our industry with a decile rating of “1” for Environmental and Social practices, and “3” for
                                                                          Governance practices in 2021
                                                         ►      Sustainalytics
                                                                   o      Risk Rating of “31.1” in 2020 places us at the top of our peer group**
                                                         ►      France’s Circular Economy Award presented to Vermilion for our project to supply geothermal heat from our oil operation to
                                                                local tomato greenhouses

    READ MORE AT HTTP://SUSTAINABILITY.VERMILIONENERGY.COM AND SLIDES 28 THROUGH 33
* The use by Vermilion Energy Inc of any MSCI ESG Research LLC or its affiliates (“MSCI”) data, and the use of MSCI logos, trademarks, service marks or index names herein, do not constitute a sponsorship, endorsement,
recommendation, or promotion of Vermilion by MSCI. MSCI services and data are the property of MSCI or its information providers, and are provided ‘as-is’ and without warranty. MSCI names and logos are trademarks or
service marks of MSCI. ** Peers with Sustainalytics scores include; ARX, BTE, CPG, ERF, FEC, MEG, TOU, VII.
                                                                                                                                                                                                                            4
VERMILION ENERGY INVESTOR PRESENTATION - APRIL 2021
INTERNATIONAL DIVERSIFICATION

                                5
VERMILION ENERGY INVESTOR PRESENTATION - APRIL 2021
CORE OPERATING AREAS
                                                                                                                                                                                                             2021E

                                                                                                                                                                                           PRODUCTION*
                                                                                                                                                                                                                          INT
                                                                                                                                                                                                                          33%
                                                                                                                                                                                                            N.A.
                                                                                                                                                                                                            67%

                                                                                                                                                                                                            N.A.          INT

                                                                                                                                                                                           FFO*
                                                                                                                                                                                                            55%           45%

                                                                                                                                                                                                                          INT

                                                                                                                                                                                           FCF*
                                                                                                                                                                                                            N.A.
                                                                                                                                                                                                                          46%
                                                                                                                                                                                                            54%

    VERMILION IS FOCUSED IN STABLE CORE AREAS
* 2021 production and FFO based on March 15, 2021 strip and company estimates. 2021 strip at March 15, 2021: Brent (US$/bbl) $64.30; WTI US$61.35/bbl; LSB = WTI less US$4.40/bbl; TTF $8.22/mmbtu; AECO
$2.60/mmbtu; CAD/USD 1.25; CAD/EUR 1.50 and CAD/AUD 0.97. Refer to the “FFO Sensitivity” slide in this presentation for more details on pricing assumptions. Includes existing hedges. Fund Flows from Operations (FFO)
is a non-GAAP measure (see Advisory).
                                                                                                                                                                                                                                6
VERMILION ENERGY INVESTOR PRESENTATION - APRIL 2021
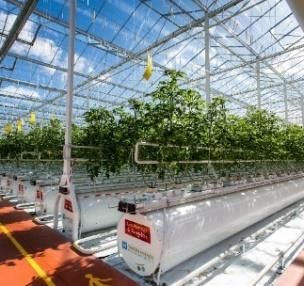
GLOBAL COMMODITY DIVERSIFICATION

                                         PRODUCTION (2021E)*                                                                 ESTIMATED FFO CONTRIBUTION (2021E)*

                                                  OIL (BRENT)                                                                                                      OIL (BRENT)
                                                      16%                                                                                                              23%
                                                                   EUROPEAN GAS
                                                                       17%

                                                                                                                                                 OIL /
                                           OIL /                                                                                                                             EUROPEAN GAS
                                                                                                                                              CONDENSATE /
                                       CONDENSATE /                                                                                                                              22%
                                                                                                                                                  NGL
                                           NGL                   NORTH AMERICAN
                                                                                                                                                 (WTI)
                                          (WTI)                       GAS
                                                                                                                                                  45%
                                           38%                        29%
                                                                                                                                                                         NORTH
                                                                                                                                                                        AMERICAN
                                                                                                                                                                          GAS
                                                                                                                                                                          10%

    EXPOSURE TO GLOBAL COMMODITY PRICE BENCHMARKS REDUCES CASH FLOW VOLATILITY
* Company estimates as at March 15, 2021. FFO Contribution excludes interest expense. FFO estimate based on March 15, 2021 strip pricing: Brent (US$/bbl) $64.30; WTI US$61.35/bbl; LSB = WTI less
US$4.40/bbl; TTF $8.22/mmbtu; AECO $2.60/mmbtu; CAD/USD 1.25; CAD/EUR 1.50 and CAD/AUD 0.97. Refer to the “FFO Sensitivity” slide in this presentation for more details on pricing assumptions.      7
VERMILION ENERGY INVESTOR PRESENTATION - APRIL 2021
GLOBAL CRUDE OIL PRICING ADVANTAGE

                                                                                                                                                                  OIL BENCHMARKS
           ►      Vermilion has significant leverage to oil prices                                                                                                                                   2021E VET Premium /
                                                                                                                                                                            2021E VET
                           An increase of US$1/bbl generates approximately                                                                                                                             (Discount) to WTI
                    o                                                                                                                                                      Crude Oil Mix
                                                                                                                                                                                                           (US$/bbl)*
                           $17MM of incremental FCF on an unhedged basis
                                                                                                                                 Brent**                                          35%                        $5.00
           ►      Approximately 35% of Vermilion’s crude oil production is
                                                                                                                                 C5+ (AB Condy)                                    9%                        ($0.25)
                  priced with reference to Dated Brent*
                                                                                                                                 Guernsey Light Sweet
                    o      Vermilion’s Australian crude currently selling at an                                                                                                    6%                        ($2.00)
                                                                                                                                 (Wyoming Light Oil)
                           approximate US$11.00/bbl premium to Dated Brent
                                                                                                                                 MSW (AB Light Oil)***                            10%                        ($4.25)
           ►      In aggregate, Vermilion’s global crude oil portfolio sells at                                                  LSB (SE SK Light Oil)***                         40%                        ($4.50)
                  an approximate US$0.50 discount to WTI based on 2021                                                           Total                                           100%                        ($0.50)
                  actual and forward pricing*

    VERMILION’S OIL PORTFOLIO PROVIDES EXPOSURE TO PRICE-ADVANTAGED BENCHMARKS
* Based on internal production and marketing estimates and March 15, 2021 full-year differentials rounded to the nearest $0.25. ** Reflects weighted average of Brent plus the Pyrenees price marker, upon
which Australia’s Wandoo crude is benchmarked. *** “LSB” – Light Sour Blend; “C5+” – Condensate; “MSW” – Mixed Sweet Blend.                                                                                                8
VERMILION ENERGY INVESTOR PRESENTATION - APRIL 2021
EUROPEAN NATURAL GAS PRICING

           ►     Vermilion has significant leverage to European natural gas                             GLOBAL NATURAL GAS PRICES
                 prices (+$1/mmbtu = +$28MM incremental FCF)                                     $14

           ►     European natural gas forward prices are currently in the $6                     $12
                 to $10/mmbtu range
                                                                                                 $10

                                                                                     C$/MMBTU*
                   ►      Strengthening European carbon pricing is supportive to                  $8
                          European natural gas pricing
                                                                                                  $6
                   ►      European natural gas prices trade at a $4 to $7/mmcf
                          premium to AECO and a $3 to $6/mmcf premium to NYMEX                    $4

                                                                                                  $2
           ►     Declining European domestic production and rising use of
                 gas in the power sector results in higher dependence on                          $0

                                                                                                        Jul-11

                                                                                                        Jul-12

                                                                                                        Jul-13

                                                                                                        Jul-14

                                                                                                        Jul-15

                                                                                                        Jul-16

                                                                                                        Jul-17

                                                                                                        Jul-18

                                                                                                        Jul-19

                                                                                                        Jul-20

                                                                                                        Jul-21

                                                                                                        Jul-22

                                                                                                        Jul-23
                                                                                                       Jan-11

                                                                                                       Jan-12

                                                                                                       Jan-13

                                                                                                       Jan-14

                                                                                                       Jan-15

                                                                                                       Jan-16

                                                                                                       Jan-17

                                                                                                       Jan-18

                                                                                                       Jan-19

                                                                                                       Jan-20

                                                                                                       Jan-21

                                                                                                       Jan-22

                                                                                                       Jan-23
                 imported supply
                                                                                                        TTF    NBP    AECO     Henry Hub

   EUROPEAN NATURAL GAS FORWARD PRICES CONTINUE TO TRADE AT A SIGNIFICANT PREMIUM VERSUS NORTH AMERICA
* 2011 – Feb 2020: Actual prices. Mar 2021E - 2023E Forwards as at March 15, 2021.                                                         9
FOCUS ON FREE CASH FLOW
    & PROFITABILITY

                          10
FREE CASH FLOW

                                                                                           FREE CASH FLOW GENERATION
                      $1,000                                                                                                                                                                                               $2,000
                       $900                                                                                                                                                                                                $1,800
                       $800                                                                                                                                                                                                $1,600

                                                                                                                                                                                                                                    CUMULATIVE FCF ($MM)**
                       $700                                                                                                                                                                                                $1,400
                       $600                                                                                                                                                                                                $1,200
               $MM*

                       $500                                                                                                                                                                                                $1,000
                       $400                                                                                                                                                                                                $800
                       $300                                                                                                                                                                                                $600
                       $200                                                                                                                                                                                                $400
                       $100                                                                                                                                                                                                $200
                          $0                                                                                                                                                                                               $0
                                             2016                          2017                           2018                          2019                           2020                         2021E*
                                          E&D CAPEX                       FCF                E&D CAPEX GUIDANCE                                 FCF FORECAST                           CUMULATIVE FCF

    FROM 2016 THROUGH 2020 WE REINVESTED ~60% OF FFO INTO E&D CAPEX AND GENERATED ~$1.4 BILLION OF FCF
* 2021 FFO estimate based on March 15, 2021 strip pricing and company estimates. 2021 strip at March 15, 2021: Brent (US$/bbl) $64.30; WTI (US$/bbl) $61.35; LSB = WTI less (US$/bbl) $4.40; TTF ($/mmbtu) $8.22; AECO
($/mmbtu) $2.60; CAD/USD 1.25; CAD/EUR 1.50 and CAD/AUD 0.97. FFO based on the mid-point of our production guidance range. Refer to the “FFO Sensitivity” slide in the Supplemental Information section of this presentation
for more details on pricing assumptions. Includes existing hedges. FCF presented as FFO less the mid-point of our E&D Capital Guidance range. ** Based on company reports and 2021 forecast described previously.                                            11
FREE CASH FLOW YIELD

                                                                                             2021E FCF YIELD
                                       40%

                                       35%

                                       30%
                2021E FCF YIELD (%)*

                                       25%

                                       20%

                                       15%

                                       10%

                                       5%

                                       0%
                                             BTE   MEG    CPG        VET        ERF        BIR       CNQ        CVE        WCP        TOU        IMO         SU        PEY           POU   NVA

    VERMILION TRADES AT ONE OF THE HIGHEST FCF YIELDS AMONGST CANADIAN PEERS
* Source: RBC estimates as of March 25, 2021, using RBC 2021 base price deck: WTI US$61.53/bbl; Brent US$64.02/bbl; NYMEX US$2.85/mmbtu; AECO $2.95/mmcf. Canadian based companies
represented, with >50,000 boe/d of 2021E production based on RBC’s estimates. FCF Yield = (Operating Cash Flow – Gross Capital Expenditures) / Market Capitalization.                            12
OPERATING NETBACKS

                                                                                      2021E OPERATING NETBACKS
                                                   $35.00                                                                                                          100%
                                                                                                                                                                   90%
                2021E OPERATING NETBACK ($/BOE)*

                                                   $30.00

                                                                                                                                                                          2021E LIQUIDS WEIGHTING (%)*
                                                                                                                                                                   80%
                                                   $25.00                                                                                                          70%
                                                                                                                                                                   60%
                                                   $20.00
                                                                                                                                                                   50%
                                                   $15.00
                                                                                                                                                                   40%

                                                   $10.00                                                                                                          30%
                                                                                                                                                                   20%
                                                    $5.00
                                                                                                                                                                   10%
                                                    $0.00                                                                                                          0%
                                                            CPG   VET   BTE   WCP      ERF       ATH         POU         PEY         NVA   KEL   BIR   TOU   AAV
                                                                                    OPERATING NETBACK               LIQUIDS WEIGHTING

    VERMILION’S INTERNATIONALLY DIVERSIFIED ASSETS PRODUCE TOP QUARTILE NETBACKS
* Source: RBC Estimates from March 29, 2021 comp tables based on 2021 futures pricing as follows: WTI US$59.49/bbl; NYMEX US$2.76/mmbtu
                                                                                                                                                                                                         13
COST REDUCTION

                                                        OPERATING EFFICIENCY                                                                                            ORGANIC CAPITAL EFFICIENCY
                  14.00                                                                                                                                         20.00
                                    7% Reduction
                  12.00                                                                                                                                                                                40% Reduction
                                                                                                                                                                16.00
                  10.00

                                                                                                                                                                12.00
                   8.00
        $ / BOE

                                                                                                                                                      $ / BOE
                                                                                       49% Reduction
                   6.00                                                                                                                                          8.00

                   4.00                                                                                            49% Reduction
                                                         17% Reduction
                                                                                                                                                                 4.00
                   2.00

                   0.00                                                                                                                                          0.00
                                 OPEX*                   Transportation                   Royalties                       G&A                                             Trailing 3-Yr Avg 2P F&D (Including FDC)
                               2014           2015           2016           2017           2018           2019           2020                                           2014    2015       2016      2017   2018   2019   2020

   VERMILION’S ONGOING FOCUS ON EFFICIENCY HAS RESULTED IN SIGNIFICANT PER UNIT COST REDUCTIONS
* Opex increase since 2017 reflects partial 2018 and full-year 2019 impact of the Spartan acquisition, which was comprised of oil-weighted assets (90% light oil) that have a higher unit operating cost,
but also a higher revenue contribution.                                                                                                                                                                                      14
FFO SENSITIVITY

                    ANNUAL 2021 UNHEDGED FFO SENSITIVITY (C$MM)*                                                          COMMODITY PRICES**                                                          2021E

                                                            Change                 FFO Impact (C$)                        Brent (US$/bbl)                                                               $64.30
                                                                                                                          WTI (US$/bbl)                                                                 $61.35
                        WTI & Brent                        US$1/bbl                     $17.0MM                           LSB = WTI less (US$/bbl)                                                       $4.40
                                                                                                                          MSW = WTI less (US$/bbl)                                                       $4.27
                 LSB / WTI Differential                    US$1/bbl                      $6.2MM
                                                                                                                          TTF ($/mmbtu)                                                                  $8.22
                        TTF & NBP                       $0.25/mmbtu                      $7.0MM                           NBP ($/mmbtu)                                                                  $8.36
                                                                                                                          AECO ($/mmbtu)                                                                 $2.60
                            AECO                        $0.25/mmbtu                     $13.1MM                           Henry Hub (US$/mmbtu)                                                          $2.67

                                                                                                                          CAD/USD                                                                         1.25
                         CAD/USD                             $0.01                       $6.0MM
                                                                                                                          CAD/EUR                                                                         1.50
                                                                                                                          CAD/AUD                                                                         0.97
                         CAD/EUR                             $0.01                       $0.1MM
                                                                                                                          EUR/GBP                                                                         1.16

    OUR INTERNATIONALLY DIVERSIFIED PORTFOLIO PROVIDES LEVERAGE TO GLOBAL COMMODITY PRICES
* Annual unhedged FFO sensitivity based on current 2021 production guidance. ** Commodity price assumptions listed have been reflected throughout this presentation using the March 15, 2021 strip,
unless otherwise noted.                                                                                                                                                                                          15
BALANCE SHEET

                16
BALANCE SHEET COMPOSITION

                                  CURRENT CREDIT CAPACITY $2.5B                                                 ►      No near-term maturities
                                            AS AT DECEMBER 31, 2020
                 $2,250                                                                                                   o      Covenant-based credit facility termed out to May 2024
                 $2,000                                                                                                   o      US$ Senior Notes termed out to March 2025
                 $1,750
                 $1,500
                                                                                                                ►      Vermilion’s US$ Senior Notes have no financial covenants
                 $1,250
                                                                                                                       and have been assigned the following credit ratings**
           $MM

                 $1,000                                                                                                   o      Moody’s: B3
                  $750                                                                                                    o      S&P: B+
                  $500                                                                                                    o      Fitch: BB-
                  $250
                     $0
                                                                                                                  4-Year Covenant-based Credit Facility                               Covenant                   YE 2019 YE 2020
                                                                                                                           Financial Covenants
                                2021            2022           2023            2024            2025
                            Undrawn Capacity on Revolving Credit Facility ($545MM)                               Total debt / Consolidated EBITDA**                                Less than 4.0                   1.9     3.5
                            Revolving Credit Facility Balance ($1,555MM)                                         Senior debt / Consolidated EBITDA**                               Less than 3.5                   1.6     2.8
                            Senior Unsecured Notes (US$300MM)                                                    Interest Coverage Ratio**                                        Greater than 2.5                13.5     8.1

    AMPLE LIQUIDITY WITH >$175MM PAID DOWN ON OUR REVOLVING CREDIT FACILITY SINCE Q2 2020
* The terms of the indenture limit the ability to, among other things: make certain payments/distributions, incur additional indebtedness or perform certain corporate restructurings. ** Values as defined in
the credit agreement.                                                                                                                                                                                                              17
FINANCIAL LEVERAGE

                                                                                                       LEVERAGE RATIOS
                        4.5x
                        4.0x
                        3.5x
                        3.0x
                        2.5x
                        2.0x
                                  VERMILION TARGETED LEVERAGE RANGE
                        1.5x
                        1.0x
                        0.5x
                        0.0x
                               2003

                                          2004

                                                    2005

                                                               2006

                                                                          2007

                                                                                    2008

                                                                                               2009

                                                                                                          2010

                                                                                                                    2011

                                                                                                                               2012

                                                                                                                                         2013

                                                                                                                                                    2014

                                                                                                                                                               2015

                                                                                                                                                                         2016

                                                                                                                                                                                    2017

                                                                                                                                                                                               2018

                                                                                                                                                                                                         2019

                                                                                                                                                                                                                    2020

                                                                                                                                                                                                                           2021E*
                                                                                 NET DEBT TO FFO**                                                  NET DEBT TO EBITDA***

    FOCUSED ON REDUCING LEVERAGE TO OUR TARGETED RANGE
* 2021 FFO estimate based on March 15, 2021 strip pricing and company estimates. 2021 strip at March 15, 2021: Brent (US$/bbl) $64.30; WTI (US$/bbl) $61.35; LSB = WTI less (US$/bbl) $4.40; TTF ($/mmbtu) $8.22; AECO
($/mmbtu) $2. 60; CAD/USD 1.25; CAD/EUR 1.50 and CAD/AUD 0.97. FFO based on the mid-point of our production guidance range. ** Reflects period-end Net Debt. *** EBITDA as defined in the credit agreement.                         18
2021 LEVERAGE SENSITIVITY

                                                            2021E DEBT-TO-CASH FLOW AT VARIOUS FORWARD OIL PRICES
                                               $800                                                                                                                                                         4.0x

                                               $700                                                                                                                                                         3.5x
                 2021E FREE CASH FLOW* ($MM)

                                                                                                                                                                                                                   2021E YEAR-END D/FFO* (x)
                                               $600                                                                                                                                                         3.0x

                                               $500                                                                                                                                                         2.5x

                                               $400                                                                                                                                                         2.0x

                                               $300                                                                                                                                                         1.5x

                                               $200                                                                                                                                                         1.0x

                                               $100                                                                                                                                                         0.5x

                                                $0                                                                                                                                                          0.0x
                                                      US$50/BBL                         US$60/BBL                                US$70/BBL                                US$80/BBL

  SIGNIFICANT TORQUE TO A CONTINUING OIL PRICE RECOVERY FACILITATES ORGANIC DELEVERING
* Based on company estimates and commodity strip at March 15, 2021, with quoted flat WTI pricing from April forward and includes the impact of existing hedges. March 15, 2021 strip pricing: Brent = WTI
plus US$2.95/bbl; LSB = WTI less US$4.40/bbl; TTF $8.22/mmbtu; AECO $2.60/mmbtu; CAD/USD 1.25; CAD/EUR 1.50 and CAD/AUD 0.97.                                                                                                                  19
COMMODITY HEDGE POSITION

                                                                                  2021                                                                                                                 2022
                                                   100%                                                                                                                       100%
           PERCENTAGE OF PRODUCTION HEDGED (%)**

                                                                                                                                      PERCENTAGE OF PRODUCTION HEDGED (%)**
                                                   90%                                                                                                                        90%
                                                   80%                                                                                                                        80%
                                                   70%                                                                                                                        70%
                                                   60%                                                                                                                        60%
                                                   50%                                                                                                                        50%
                                                   40%                                                                                                                        40%
                                                   30%                                                                                                                        30%
                                                   20%                                                                                                                        20%
                                                   10%                                                                                                                        10%
                                                    0%                                                                                                                         0%
                                                          WTI          Brent         European         N.A.       Corporate                                                           WTI       Brent         European         N.A.       Corporate
                                                                                    Natural Gas    Natural Gas     Total                                                                                    Natural Gas    Natural Gas     Total
               Average Floor C$59.84/bbl                            C$65.58/bbl     C$7.96/mmbtu C$2.11/mmbtu                             Average Floor                              N/A       N/A          C$7.48/mmbtu       N/A

                                                            Swaps         Collars         3-Ways         Basis Swaps                                                                   Swaps      Collars         3-Ways         Basis Swaps

    VISIT VERMILIONENERGY.COM/INVEST-WITH-US/HEDGING.CFM FOR MORE DETAILED HEDGING INFORMATION
* Company estimates as at March 30, 2021. Bought Put Options are included as Collars in the chart above. Average prices above do not reflect the impact of Sold Puts within the 3-way structures which can alter the average
floor price depending on the underlying commodity price. Average prices reflect exchange rates as follows: USD/CAD 1.26; EURCAD 1.48; GBP/CAD 1.73. ** Hedge percentages based on contracts in place as at March 1,
2021 as a percentage of current production guidance.
                                                                                                                                                                                                                                                     20
SUMMARY

            ►      Unique portfolio of internationally diversified assets
                     o       Exposure to global commodity price benchmarks reduces cash flow volatility
                     o       Will support the return to a dividend capital markets model (over $40/share of dividends from 2003 to early 2020)

            ►      Long history of strong profitability and free cash flow generation
                     o       High margin, low decline assets with strong capital efficiencies
                     o       Generated ~$1.4 billion of FCF from 2016 through 2020
                     o       Vermilion has delivered an average 11% ROACE since inception

            ►      Significant leverage to recovering global commodity prices
                     o       2021E FCF in excess of $350MM at US$60/bbl WTI*
                     o       +US$1/bbl change in oil = +$17MM of FCF**
                     o       +C$1/mmcf change in European natural gas = +$28MM of FCF**

            ►      Compelling investment opportunity
                     o       Currently trading at one of the highest free cash flow yields amongst our peers (over 20%)***

            ►      Industry leader in sustainability and ESG performance
                     o       Focused on ESG for over a decade with continued recognition by independent ESG agencies
* Based on company estimates and commodity strip at March 15, 2021, with flat WTI pricing from March forward, and includes the impact of existing hedges. March 15, 2021 strip pricing: Brent = WTI plus US$2.95/bbl; LSB =
WTI less US$4.40/bbl; TTF $8.22/mmbtu; AECO $2.60/mmbtu; CAD/USD 1.25; CAD/EUR 1.50 and CAD/AUD 0.97. ** Sensitivities are represented on an unhedged basis. *** Based on RBC research (see slide 12).                        21
ASSET OVERVIEW

                 22
VERMILION PRODUCTION

                      105,000

                       90,000

                       75,000

                       60,000
              BOE/D

                       45,000

                       30,000

                       15,000

                             0
                                   2003       2004       2005      2006       2007       2008 2009* 2010* 2011* 2012* 2013* 2014* 2015* 2016                                            2017       2018      2019       2020 2021E
               E&D CAPEX
               AS % OF FFO** 50%              36%        40%        38%       43%        32%       59%        115% 100%            77%        77%        80%       85%        43%        49%       57%        53%       64%   40%

                                                                                               North America                                        International

    LOW REINVESTMENT RATIO DRIVES STRONG FREE CASH FLOW
 * 2009-2015: Includes E&D Capex of $496MM and negative FFO of $46MM associated with the Corrib project in Ireland, which produced first gas on December 30, 2015. ** 2021 FFO estimate based on March 15, 2021 strip
pricing and company estimates. 2021 strip at March 15, 2021: Brent (US$/bbl) $64.30; WTI (US$/bbl) $61.35; LSB = WTI less (US$/bbl) $4.40; TTF ($/mmbtu) $8.22; AECO ($/mmbtu) $2.60; CAD/USD 1.25; CAD/EUR 1.50 and
CAD/AUD 0.97. Refer to the “FFO Sensitivity” slide in the Supplemental Information section of this presentation for more details on pricing assumptions. Estimates include existing hedges and excludes interest.
                                                                                                                                                                                                                                     23
EUROPE

                                        NETHERLANDS                                               GERMANY
IRELAND                                 ► #2 onshore gas producer                                 ► Established production operations
► 20% operated interest in the Corrib   ► Large and growing inventory of drilling opportunities      and substantial exploratory land
    Natural Gas Project                                                                              position in the North German Basin
► Corrib field constitutes ~90% of
    Ireland’s gas production
                                                                                                   CENTRAL & EASTERN EUROPE
                                                                                                   ► Approximately 3.4 million acres of
FRANCE                                                                                                undeveloped land across four countries
► #1 domestic oil producer with ¾                                                                     (Hungary, Croatia and Slovakia)
   share of the domestic industry                                                                  ► Focused on under-invested basins

► Extensive inventory of workovers,                                                                   prospective for both oil and gas that
   recompletions, waterfloods and                                                                     can benefit from new technology
   infill drilling                                                                                 ► Exploring certain farm-out opportunities
                                                                                                      to reduce exposure to higher risk
                                                                                                      assets

                                                                                                                                            24
CEE EXPLORATION POTENTIAL

              VERMILION HAS BUILT A HIGHLY PROSPECTIVE EXPLORATION PORTFOLIO ACROSS CEE
              ►        Approximately 3.4 million net acres of undeveloped land across three countries (Hungary, Croatia and Slovakia)
              ►        Focused on under-invested basins prospective for both oil and gas that can benefit from new technology
              ►        Exploring certain farm-out opportunities to reduce exposure to higher risk assets
              CROATIA
              ►        2.2 million net acres with five licenses prospective for natural gas and light oil
              ►        Drilled two successful gas wells in 2019 on the SA-10 block which tested at 15 mmcf/d and 17 mmcf/d, respectively*
              ►        Identified 10 additional prospects in close vicinity to the new SA-10 gas discoveries
              ►        First production from SA-10 block planned for 2022
              HUNGARY
              ►        950,000 net acres with four licenses prospective for shallow gas and light oil
              ►        Drilled four (3.3 net) gas wells in 2019 which have produced over 1.0 bcf to date
              ►        Identified nine additional prospects for future drilling
              ►        Kadarkut License is prospective for oil with first well planned for Q1 2021
              SLOVAKIA
              ►        240,000 net acres with two licenses prospective for natural gas
                        o    Trnava Licence – a series of unproduced gas discoveries made during the 1950’s planned to be developed
                             using Vermilion’s newly acquired proprietary 3D seismic data set. Several un-drilled fault-blocks imaged by 3D
                             will also be tested.
                        o    Topolcany Licence – plan to acquire new 3D seismic across a prospective area immediately adjacent to the
                             Trnava Licence

     FOCUSED ON ESTABLISHING LOW COST POSITIONS IN THE UNDER-EXPLOITED PANNONIAN BASIN
* Ceric-01 well (100% working interest) tested at a final flow rate of 15.0 mmcf/d at a stabilized flowing wellhead pressure of 851 psi on a 0.86 inch diameter choke during a one hour flow period following perforating. An additional 18 hour flow test was later conducted at reduced rates to
limit flaring. During this test, the well flowed at a rate of 6.2 mmcf/d at a stabilized flowing pressure of 1,376 psi on a 0.37 inch choke. No formation water was produced during the tests. The well encountered 32 feet of net pay in two Upper Miocene Pannonian sandstones from 3,346-
3,353 and 3,828-3,861 feet. Only the lower zone was tested. Berak-01 well (100% working interest) tested at a rate of 17.2 mmcf/d during a four-hour flow period with a stabilized flowing wellhead pressure of 908 psi on a 0.875 inch diameter choke. A final shut in wellhead pressure of
1,186 psi was recorded following the flow test. The flow test continued an additional 12 hours at reduced choke sizes to minimize flaring. No formation water was produced during the test. The well logged 21 feet of net gas pay with an average porosity of 32% from the Upper Miocene
Pannonian sandstone occurring within a gross measured depth interval of 3,006-3,033 feet. Test results are not necessarily indicative of long-term performance or ultimate recovery.
                                                                                                                                                                                                                                                                                                     25
AUSTRALIA

    ►   100% operated interest in Wandoo, an offshore oil field
        approximately 80 km N.W. of Australia (55m water depth)

    ►   Horizontal well development with 20 producing wellbores and
        five dual lateral sidetracks tied into two platforms

    ►   Two well-program planned for 1H 2022

    ►   Contracted Wandoo crude oil sales receive a premium to
        Dated Brent index

STABLE ASSET DELIVERING PREMIUM TO BRENT PRICING AND STRONG FREE CASH FLOW

                                                                             26
NORTH AMERICA

  CANADA
  ►   Targeting light oil and condensate-rich natural gas in West Central Alberta and light
      oil in SE Saskatchewan
  ►   Over 400,000 net acres in West Pembina targeting the Mannville (2,400 – 2,700m
      depth) and Cardium (1,800m depth) formations with shared surface infrastructure
  ►   Approximately 500,000 net acres of land in southeast Saskatchewan with
      development potential in several stacked high-return targets

  UNITED STATES
  ►   Targeting light oil opportunities in the Powder River Basin in northeastern Wyoming
  ►   Over 130,000 net acres (90% operated WI) in the Powder River Basin targeting
      Turner Sand development in the Hilight (2,600m) and East Finn (1,500m) assets

SIGNIFICANTLY ADVANTAGED PLAYS IN THE NORTH AMERICAN INDUSTRY

                                                                                              27
ESG PERFORMANCE

                  28
ENVIRONMENTAL SUSTAINABILITY

            ►      We are playing a meaningful role in the energy transition by reducing
                   the environmental impact of our traditional energy production and
                   developing renewable energy projects
                     o      We deploy energy and emissions efficiency improvement projects
                            throughout our operations
                     o      In France, oil operations provide geothermal heat to industrial-scaled
                            agriculture and eco-friendly housing projects with strong social impact

            ►      Vermilion has been consistently recognized for outstanding
                   sustainability performance
            ►      Our strategy is aligned with the UN’s Global Goals for Sustainable
                   Development (SDGs)
            ►      We believe sustainability-oriented investors, governments and citizens
                   will have their greatest positive impact by turning to Best-In-Class
                   operators like Vermilion during the energy transition

    VALUES MATTER: WE HAVE MADE SUSTAINABILITY CENTRAL TO OUR STRATEGY
View our Sustainability Report online at http://sustainability.vermilionenergy.com                    29
ENVIRONMENTAL PERFORMANCE

            CDP (FORMERLY CARBON DISCLOSURE PROJECT)
            ► CDP is a not-for-profit that provides a global disclosure system for investors and companies to
               manage their environmental impacts, including Climate (results at right)
            ► Submitted to CDP Water for the first time in 2020, achieving a B rating (highest ranking, and
                                                                                                                                                           2020   Leadership Level rating of A-
               one of seven, for Canadian oil and gas sector companies)                                                                                            One of five Canadian oil and gas sector companies, one of seven
                                                                                                                                                                   in North America, and 20 globally to achieve this level (Top 10%)
            ► Vermilion reduced emissions intensity by 44% from 2014 to 2017
                                                                                                                                                           2019   Leadership Level rating of A-
                                                                                                                                                                   One of two Canadian oil and gas sector companies, one of four in
            PARENTIS SUSTAINABILITY PARTNERSHIP (2012)                                                                                                             North America, and 16 globally to achieve this level (Top 6%)
            ► Vermilion was the recipient of France’s Circular Economy Award for our project to supply
                                                                                                                                                           2018   Leadership Level rating of A-
               geothermal heat from our oil operation to local tomato greenhouses                                                                                  Only Canadian oil and gas sector company, one of two in North
                                                                                                                                                                   America, and 13 globally to achieve this level (Top 5%)
            ► Project provides 8 MW of renewable energy and prevents the emission of 10,000 tonnes of
               CO2 per year                                                                                                                                2017   Leadership Level rating of A-
                                                                                                                                                                   Only Canadian energy sector company, one of two in North
                                                                                                                                                                   America, and 18 globally to achieve this level (Top 4%)
            LA TESTE ECO-NEIGHBOURHOOD (2016)                                                                                                              2016   "A list" level (highest ranking possible)
            ► Our operations in La Teste, France support an eco-neighborhood heated using recycled                                                                 One of 193 companies globally, one of five energy companies in
                                                                                                                                                                   the world, and the only North American company to make the list
                geothermal heat from our oil operation
                                                                                                                                                           2015   Leading energy company on the Canadian
            ► 30-year partnership provides up to 80% of the heat for 550 homes by supplying 1 MW of                                                               Climate Disclosure Leadership Index (CLDI)
                renewable energy and preventing the emission of 500 tonnes of CO2 per year                                                                         First Canadian energy company to achieve the top score of 100

    VERMILION IS A CLIMATE LEADER IN OUR PEER GROUP
Vermilion’s emissions data are externally verified under ISO 14064-3. View our Sustainability Report online at http://sustainability.vermilionenergy.com                                                                           30
SOCIAL PERFORMANCE

           ►     Give back through strategic community investment
                   o      In the past five years, Vermilion has invested more than $9.2 million
                          and 11,100 hours of volunteer time in our communities

           ►     Demonstrate excellent results in annual employee survey provided
                 by the Great Place to Work Institute to evaluate workplace culture
                   o      Recognized in 2020 Best Workplaces competition as top 40 in
                          Canada and top 30 in Germany*
                   o      Since 2010, Vermilion has been ranked among the best workplaces
                          in Canada

           ►     Maintain a strong corporate culture
                   o      Live and breathe core values of Excellence, Trust, Respect and
                          Responsibility
                   o      Creates a high performing organizations

   COMMITTED TO THE CARE OF OUR PEOPLE AND THE ENRICHMENT OF THE COMMUNITIES WHERE WE LIVE AND WORK
* Vermilion was the only energy company recognized out of more than 600 participating Canadian companies. In Germany, we also placed 5th in the Lower Saxony and Bremen Region competition and
1st in the industry competition. View our Sustainability Report online at http://sustainability.vermilionenergy.com                                                                              31
PARENTIS SUSTAINABILITY PARTNERSHIP

  ►   Vermilion received France’s Circular Economy Award for our project to supply geothermal heat from our oil operation to local greenhouses
  ►   The award recognizes economically successful enterprises that operate within a “circular economy,” in which businesses and processes conserve, reuse
      and recycle resources
  ►   Provides 8 MW of renewable energy and prevents the emission of 10,000 tonnes of CO2/year
                                               Environmental and Economic Benefits
                                               ►    Our recycled energy project produces 7,500 tonnes of tomatoes per year and avoids ~10,000 tonnes of CO2-equivalent emissions
                                               ►    This project created 250 direct agricultural jobs in a region in need of investment
                                               ►    It also launched a long-term, economically and environmentally sustainable local industry projected to increase to 500 jobs through
                                                    ongoing greenhouse investment
                                               ►    Recycles geothermal energy that is a byproduct of Vermilion’s oil operation
                                               ►    Makes local tomatoes available and affordable, reducing the need for imports with associated transportation emissions

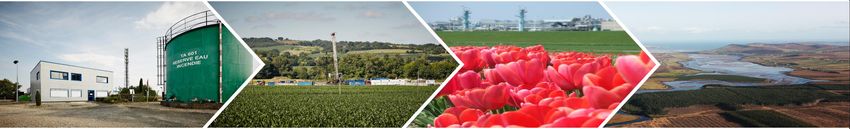
                                               Co-Location of Oil Field and Greenhouse
                                               ►    Located in the Aquitaine Basin, our Parentis Lake is the second largest onshore oil field in Europe
                                               ►    Vermilion’s Parentis pre-existing office and battery are in the foreground of this aerial photograph
                                               ►    15 hectares of tomato-producing greenhouses are now located next to our office to take advantage of our geothermal energy
                                                    (background of aerial photograph)

                                               Operation
                                               ►    Our oil operation produces a mix of hot oil and water, which comes out of the ground naturally heated to 60°C
                                               ►    Hot water is sent through a closed-loop heat exchanger with the Tom D’Aqui greenhouse heating system
                                               ►    Water is reused by pumping it back underground in an enhanced oil-recovery waterflood project

PARTNERSHIP CREATES A NEW ENVIRONMENTALLY AND ECONOMICALLY SUSTAINABLE INDUSTRY

                                                                                                                                                                                          32
LA TESTE ECO-NEIGHBOURHOOD

  ►   Our operations in La Teste, France now support an eco-neighborhood heated the same way as the tomato greenhouses, using recycled geothermal
      energy from our oil operation
  ►   30-year partnership to provide 80% of the energy required for 550 homes
  ►   Provides 1 MW of renewable energy and prevents the emission of 500 tonnes of CO2/year
                                                   What is an Eco-Neighborhood?
                                                   ►    Developed urban space that has sustainable development principles as its main concern
                                                   ►    Adapted to the natural characteristics of the land to the fullest extent possible
                                                   ►    Eco-Neighborhood seal of approval created by French government in 2012

                                                   Objectives of the Eco-Neighborhood
                                                   ►     Reduce energy consumption and develop the use of renewable energies
                                                   ►     Optimize mobility management
                                                   ►     Reduce water consumption
                                                   ►     Minimize waste production
                                                   ►     Promote biodiversity
                                                   ►     Promote socio-economic, cultural and generational diversity

                                                   La Teste Project in Aquitaine Basin
                                                   ►    30% of housing units are designated for social (also known as low-income) housing
                                                   ►    Vermilion partnership will generate a 50% decrease in energy bills
                                                   ►    Vermilion is also participating in the conservation and management of protected plant species
                                                   ►    Part of our Les Arbousiers Nord oil field, where protected plants grow naturally, will be sheltered from future urban development

ADVANCES BOTH ENVIRONMENTAL SUSTAINABILITY AND ECONOMIC INCLUSIVITY

                                                                                                                                                                                            33
ANALYST COVERAGE

                  FIRM                             ANALYST
          ATB Capital Markets               Patrick J. O’Rourke, CFA
           BMO Nesbitt Burns                   Ray Kwan, P.Eng.
           Canaccord Genuity                   Anthony Petrucci
          CIBC Capital Markets                  Dave Popowich
              Credit Suisse                      Manav Gupta
              Eight Capital                      Phil Skolnick
               J.P. Morgan                       Arun Jayaram
National Bank of Canada Financial Markets         Travis Wood
              Peters & Co.                      Dan Grager, CA
            Raymond James                    Jeremy McCrea, CFA
          RBC Capital Markets                  Greg Pardy, CFA
             Scotia Capital                       Gavin Wylie
            TD Securities Inc.                Menno Hulshof, CFA
      Veritas Investment Research            Jeffrey Craig, CPA, CA

                                                                       34
ADVISORY

This presentation is for information purposes only and is not intended to, and should not be construed to constitute, an offer to sell or the solicitation of an offer to buy, securities of Vermilion. This presentation and its contents should not
be construed, under any circumstances, as investment, tax or legal advice. Any person viewing this presentation acknowledges the need to conduct their own thorough investigation into Vermilion and its activities before considering any
investment in its securities.
Certain statements included or incorporated by reference in this presentation may constitute "forward-looking statements" or "forward-looking information" within the meaning of applicable Canadian and United States securities laws
(collectively, "forward-looking statements"). Forward-looking statements are typically identified by words such as "anticipate", "continue", "estimate", "expect", "forecast", “focus”, "may", "will", "project", "could", "plan", "intend", "should",
"believe", "outlook", "potential", "target", "seek", "budget", "predict", "might" and similar words suggesting future events or future performance. All statements other than statements of historical fact may be forward-looking statements.
Forward-looking statements in this presentation may include, but are not limited to, matters relating to: business strategies, plans and objectives (including over the near, medium and longer-term); forecast (or estimated) fund flows from
operations (FFO) and free cash flow (FCF), FCF yield, production mix and FFO contribution; commodity pricing and FFO sensitivity; dividends; share buybacks; and hedging. In addition, statements relating to "reserves" or "resources"
are deemed to be forward-looking statements as they involve the implied assessment, based on certain estimates and assumptions, that the reserves and resources described exist in the quantities predicted or estimated and can be
profitably produced in the future.
Forward-looking statements are based on Vermilion’s current expectations and assumptions and are subject to a number of risks and uncertainties that could materially affect future results. In addition to assumptions identified in this
presentation, assumptions have also been made regarding: availability of equipment, services and supplies; marketing of crude oil, natural gas liquids and natural gas; timely receipt of required regulatory approvals; foreign currency
exchange rates and interest rates; and timing and results of development activities. Risks include, but are not limited to, general economic risks and uncertainties, future commodity prices, exchange rates, interest rates, geological risk,
political risk, regulatory approval risk, production demand, transportation restrictions, risks associated with COVID-19, changes in tax, royalty and regulatory regimes and risks associated with international activities. Additional risks and
uncertainties are described in Vermilion’s Annual Information Form, as well as Vermilion’s Management’s Discussion and Analysis (“MD&A”) which are filed on SEDAR at www.sedar.com and on the SEC’s EDGAR system at
www.sec.gov. Due to the risks, uncertainties and assumptions inherent in forward-looking statements, prospective investors in the Company's securities should not place undue reliance on these forward-looking statements. Forward
looking statements are made as of the date hereof and Vermilion undertakes no obligation to update publicly or revise any forward looking statements, whether as a result of new information, future events, or otherwise, unless required
by applicable securities laws.
All references are to Canadian dollars unless otherwise specified.
This presentation contains certain non-standardized financial measures including net debt and fund flows from operations as well as non-GAAP measures including netbacks that are not determined in accordance with International
Financial Reporting Standards (“IFRS”) as issued by the International Accounting Standards Board. These measures as presented do not have any standardized meaning prescribed by IFRS and therefore may not be comparable with
calculations of similar measures by other companies. Reference is made to Vermilion's publicly filed documents, including our most recently filed MD&A, for a discussion of these measures, including a reconciliation of fund flows from
operations to cash flow from operating activities and net debt to long-term debt. Management believes that, in conjunction with results presented in accordance with IFRS, these measures assist in providing a more complete
understanding of certain aspects of Vermilion’s results of operations and financial performance. Investors are cautioned, however, that these measures should not be construed as an alternative to measures determined in accordance
with IFRS as an indication of our performance.
Certain natural gas volumes have been converted on the basis of six thousand cubic feet of gas to one barrel equivalent of oil. Barrels of oil equivalent (boe’s) may be misleading, particularly if used in isolation. A boe conversion ratio of
six thousand cubic feet to one barrel of oil is based on an energy equivalency conversion method primarily applicable at the burner tip and does not represent a value equivalency at the wellhead.
Reserves Definitions
All reserves estimates in this presentation are derived from evaluation reports (dated February 12, 2021 with an effective date of December 31, 2020 relating to our year-end reserves) prepared by GLJ Petroleum Consultants Ltd.
(“GLJ”), an independent qualified reserves evaluator, in accordance with the Canadian Oil and Gas Evaluation Handbook (the "COGEH") and National Instrument 51-101 – Standards of Disclosure for Oil and Gas Activities. The following
provides the definitions of the various reserves categories used in this presentation as set out in the COGEH. Reserves are estimated remaining quantities of oil and natural gas and related substances anticipated to be recoverable from
known accumulations, as of a given date, based on the analysis of drilling, geological, geophysical and engineering data; the use of established technology; and specified economic conditions, which are generally accepted as being
reasonable. Reserves are classified according to the degree of certainty associated with the estimates as follows:
Proved Reserves are those reserves that can be estimated with a high degree of certainty to be recoverable. It is likely that the actual remaining quantities recovered will exceed the estimated proved (“1P”) reserves.
Probable Reserves are those additional reserves that are less certain to be recovered than proved reserves. It is equally likely that the actual remaining quantities recovered will be greater or less than the sum of the estimated proved
plus probable (“2P”) reserves.
For more detail, including the forecast price and cost assumptions used by GLJ in preparing their evaluation reports, the chance of development, the chance of discovery, and other country specific contingencies, please refer to
Vermilion’s Annual Information Form for the year ended December 31, 2020 available under the Company profile at www.sedar.com.
                                                                                                                                                                                                                                                         35
You can also read