Common Properties of Lubricants that Affect Vehicle Fuel Efficiency: A North American Historical Perspective

Page created by Jeremy Garner
 
CONTINUE READING
Common Properties of Lubricants that Affect Vehicle Fuel Efficiency: A North American Historical Perspective
lubricants
Review
Common Properties of Lubricants that Affect Vehicle
Fuel Efficiency: A North American
Historical Perspective
Mark T. Devlin
 Afton Chemical Corporation, 500 Spring Street, Richmond, VA 23218, USA; mark.devlin@aftonchemical.com;
 Tel.: +1-804-788-6322
                                                                                                   
 Received: 28 June 2018; Accepted: 30 July 2018; Published: 3 August 2018                          

 Abstract: The development of advanced lubricants to improve vehicle fuel efficiency can appear
 to be as simple as lowering the viscosity and frictional properties of a fluid. However, applied
 research studies have shown that it is quite difficult to quantify the fuel efficiency properties of
 advanced lubricants in vehicles. A review of the historical research predominantly performed in
 North America in this area reveals that there are many factors to consider in order to demonstrate the
 effectiveness of advanced lubricants. First, the methodology used to measure vehicle fuel efficiency
 will impact the results since there are many factors not related to the lubricant which will influence
 vehicle fuel efficiency. Second, developing advanced fuel-efficient lubricants under well controlled
 conditions overlooks the issue that lubricant properties such as viscosity and friction affect the
 operating conditions encountered by the lubricant in the vehicle. Finally, the physical properties of
 lubricants that historically control fuel economy do not have the same effect on fuel efficiency in all
 vehicles. The proper vehicle or system level test needs to be selected to properly assess the benefits of
 new advanced lubricants.

 Keywords: fuel efficiency; lubricants; viscosity; friction

1. Introduction
     Worldwide government regulations describing vehicle fuel efficiency and exhaust emissions
requirements are major technical drivers for improvements to all automotive lubricants. For example,
in 1980 in the US, the minimum corporate average fuel economy (CAFE) for a passenger car and light
duty truck was approximately 23 MPG. In 2010, this CAFE minimum was approximately 30 MPG
and is projected to be over 50 MPG by 2025. For heavy-duty trucks, particulate emission and NOx
reductions have been the focus of US regulations. In 1998, the maximum allowed NOx and particulate
emissions were 14.4 g/kW-h and 0.8 g/kW-h, respectively. In 2015, these maximum emissions were
0.27 g/kW-h of NOx and 0.013 g/kW-h of particulates. For passenger cars and light duty trucks, there is
now a focus on reducing particulate emissions since vehicles equipped with turbocharged gasoline
direct injection engines (TGDI), which can improve fuel efficiency, emit exhaust soot. For heavy-duty
trucks, reducing CO2 emissions is becoming a priority by requiring annual increases in fuel economy
of between 2.0% and 2.5% from 2018 until 2027 [1,2].
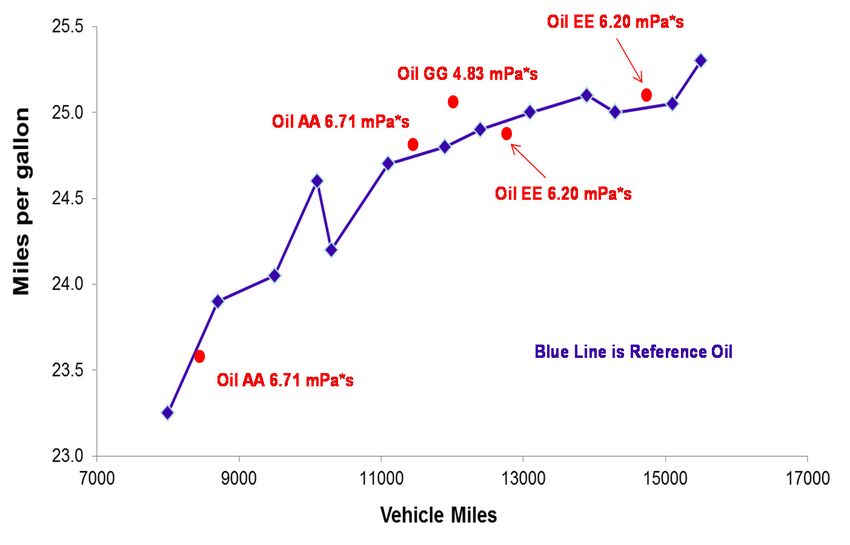
     The increased need for advanced lubricants to improve fuel efficiency is reflected in the increase
in research related to fuel efficiency lubricants. Figure 1 shows the number of technical papers related
to lubricant derived fuel economy published by the Society of Automotive Engineers (SAE) from the
1960s through the 2000s. The number of publications has steadily increased over this time frame,
with most research focused on engine oils. A steady increase in publications related to transmission
fluids and gear oils also occurred since it is becoming necessary to extract fuel economy performance

Lubricants 2018, 6, 68; doi:10.3390/lubricants6030068                       www.mdpi.com/journal/lubricants
Common Properties of Lubricants that Affect Vehicle Fuel Efficiency: A North American Historical Perspective
Lubricants 2018, 6, x FOR PEER REVIEW                                                                                             2 of 15

Lubricants 2018, 6, 68                                                                                                            2 of 15
transmission fluids and gear oils also occurred since it is becoming necessary to extract fuel economy
performance throughout the drivetrain. When summarizing lubricant technical trends, review
papers oftenthe
throughout       focus  on future
                    drivetrain.    looking
                                 When        technologies.
                                         summarizing          For example,
                                                         lubricant   technical  Victor  Wong
                                                                                  trends,       andpapers
                                                                                           review    Simon often
                                                                                                              Tungfocus
                                                                                                                     have
written
on  futureanlooking
              excellent   review of the
                      technologies.    Forcurrent
                                           example,state  of engine
                                                       Victor  Wong oilandlubricant
                                                                             Simon Tungtechnology     to reduce
                                                                                            have written          friction
                                                                                                             an excellent
and improve
review   of thefuel   efficiency
                  current   state [3]. These reviews
                                  of engine             and discussions
                                              oil lubricant    technologyintotrade     journals
                                                                                  reduce          often
                                                                                           friction  anddescribe
                                                                                                           improve future
                                                                                                                      fuel
technologies
efficiency  [3]. that
                  Thesemay   have and
                         reviews   special  lubrication
                                        discussions       needsjournals
                                                      in trade    [3–5]. There     are also excellent
                                                                            often describe                discussions
                                                                                              future technologies       of
                                                                                                                      that
how have
may    current   and lubrication
             special   new lubricant
                                   needsadditive   technology
                                          [3–5]. There   are alsoaffects
                                                                   excellentfriction  and thus
                                                                                discussions       fuel current
                                                                                              of how    efficiency
                                                                                                                 and[6–9].
                                                                                                                      new
However,additive
lubricant    we oftentechnology
                         do not look   back friction
                                    affects  to remind
                                                     andus   what
                                                           thus     past
                                                                 fuel      research
                                                                       efficiency     efforts
                                                                                    [6–9].     have already
                                                                                           However,            taught
                                                                                                        we often        us
                                                                                                                   do not
regarding
look  back to(1)remind
                   measurement      of lubricant
                         us what past              properties
                                         research efforts   haveon    fuel economy;
                                                                  already                 (2) the common
                                                                              taught us regarding               lubricant
                                                                                                       (1) measurement
properties
of lubricantidentified
               propertiespreviously     and (3) (2)
                             on fuel economy;     thatthe
                                                        in common
                                                            all applications,
                                                                       lubricantthese    lubricant
                                                                                    properties       properties
                                                                                                 identified        do not
                                                                                                              previously
always
and      haveinthe
     (3) that     allsame   relative effects.
                      applications,  these lubricant properties do not always have the same relative effects.

                                  1400
                                             Engine Oil
                                  1200
                                             Gear Oil
                                  1000
               Number of papers

                                             Trans. Fluid

                                   800

                                   600

                                   400

                                   200

                                     0
                                         1960s          1970s           1980s             1990s              2000s

         Figure 1. Society of Automotive Engineers (SAE) papers related to fuel economy and lubricants.
                                                                                            lubricants.

      This retrospective
     This     retrospective discussion
                                 discussion of        fuel efficiency
                                                 of fuel     efficiency willwill focus
                                                                                  focus on   on research
                                                                                                 research performed
                                                                                                                performed at    at Afton
                                                                                                                                   Afton
Chemical      Corporation       and    predominantly        covers   research    related
Chemical Corporation and predominantly covers research related to North American fuel economyto North     American      fuel   economy
concerns [10–57].
concerns     [10–57]. Papers
                          Papersfromfromother
                                            otherresearch
                                                     researchgroups
                                                                  groups  areare
                                                                               listed
                                                                                   listed in in
                                                                                             thethe
                                                                                                  reference
                                                                                                       reference section   to show
                                                                                                                     section          the
                                                                                                                                to show
commonality
the commonality    between
                         between observations
                                     observations   throughout
                                                        throughout   thetheindustry
                                                                              industry[58–94].
                                                                                            [58–94].SomeSomeofofthe the studies     cited
                                                                                                                         studies cited
included      vehicles,    driving    cycles   or  engines     of  interest   to  researchers
included vehicles, driving cycles or engines of interest to researchers in Japan, Europe and South  in  Japan,    Europe     and   South
America [12,19,26,27,32,42,58,61,65,69,70,73,76,77,86].
America      [12,19,26,27,32,42,58,61,65,69,70,73,76,77,86]. Therefore,   Therefore, this  this review
                                                                                                review may  may be be applicable
                                                                                                                       applicable to to aa
global understanding
global   understanding of          fuel economy.
                               of fuel    economy. It   It is  critical to
                                                            is critical  to distinguish
                                                                             distinguish between
                                                                                               between research
                                                                                                             research efforts
                                                                                                                        efforts where
                                                                                                                                   where
lubricants      have   a   direct  impact      on  fuel    efficiency    versus     research
lubricants have a direct impact on fuel efficiency versus research where lubricants ensure that  where       lubricants    ensure    that
mechanical systems
mechanical       systems designed
                             designed to   to improve
                                                improve fuel fuel efficiency
                                                                    efficiency operate
                                                                                  operate properly
                                                                                               properly [47–56].
                                                                                                              [47–56]. For
                                                                                                                         For example,
                                                                                                                               example,
when    operating     engines     at  low  speeds    in  order   to  improve     the    conversion
when operating engines at low speeds in order to improve the conversion of chemical to mechanical       of  chemical    to  mechanical
energy,pre-ignition
energy,    pre-ignitionevents events     (LSPI)
                                     (LSPI)   cancan
                                                   occuroccur
                                                            that that
                                                                  causecause
                                                                          damage damageto the to  the engine.
                                                                                               engine.              Preventing
                                                                                                           Preventing               LSPI
                                                                                                                          LSPI enables
enables
the        the operation
    operation      of engines  of engines
                                  under more  under     more efficient
                                                    efficient   conditions conditions
                                                                               so that fuel so that    fuel economy
                                                                                                 economy                  is improved
                                                                                                                is improved      [51–56].
[51–56].    There     are   engine     oil  additives     that   affect   LSPI    and      fuel
There are engine oil additives that affect LSPI and fuel efficiency, and those will be discussed efficiency,      and   those    will be
                                                                                                                                       in
discussed      in Section     4. The    focus   in this   review     will  be  on    lubricant
Section 4. The focus in this review will be on lubricant properties that have a direct impact     properties       that  have    a direct
                                                                                                                                       on
impact
fuel      on fuel efficiency.
     efficiency.
      It is  critical to
     It is critical    to point
                           point out
                                  out that
                                         that energy
                                              energy balance
                                                         balance analyses
                                                                    analyses have
                                                                                have shownshown that
                                                                                                   that the
                                                                                                          the amount
                                                                                                                amount of of energy
                                                                                                                               energy toto
operate   a   vehicle   is approximately        40%   of  the  energy    created    from     combusting
operate a vehicle is approximately 40% of the energy created from combusting fuel [3,4]. Energy loss           fuel [3,4].  Energy   loss
due to
due  to friction
         friction in
                   in the
                        the engine,
                             engine, transmission
                                        transmission and  and axles
                                                                axles accounts
                                                                        accounts for  for approximately
                                                                                           approximately 5–15%   5–15% ofof the
                                                                                                                             the energy
                                                                                                                                  energy
created     from    combusting         fuel.  Therefore,       45–55%     of   the     energy    is   lost
created from combusting fuel. Therefore, 45–55% of the energy is lost due to non-frictional inefficiencies    due   to  non-frictional
inefficiencies
in the vehicle,in      the vehicle,
                   including             including
                                  inefficient          inefficient
                                                 conversion           conversion
                                                                 of chemical           of chemical energy.
                                                                                  to mechanical          to mechanical
                                                                                                                    A majorityenergy.   A
                                                                                                                                   of the
majority     of the  forty   years   of  lubricant   research     has   focused    on    recapturing
forty years of lubricant research has focused on recapturing the 5–15% of energy lost due to friction.    the   5–15%   of  energy   lost
Common Properties of Lubricants that Affect Vehicle Fuel Efficiency: A North American Historical Perspective
Lubricants 2018, 6, 68                                                                                                           3 of 15

Future  lubricant advancements to enable mechanical devices that improve powertrain and drivetrain
      Lubricants 2018, 6, x FOR PEER REVIEW                                             3 of 15
efficiency will help recapture a larger amount of the lost energy.
      due to friction. Future lubricant advancements to enable mechanical devices that improve
2. Difficulties
     powertrainwith Measuring
                and drivetrain    the Effect
                               efficiency will of Lubricants
                                               help recapture aon  Fuelamount
                                                                larger  Economy
                                                                              of the lost energy.
      Government fuel economy regulations are based on measuring fuel economy in vehicles. Tests to
      2. Difficulties with Measuring the Effect of Lubricants on Fuel Economy
measure the fuel efficiency properties of lubricants can also be performed in fired and motored engine
            Government
tests, as well   as system  fuel economy
                               level          regulations
                                      efficiency            areautomatic
                                                    tests for   based on measuring
                                                                               transmission fuel economy
                                                                                                   fluids orinaxle
                                                                                                                 vehicles.   Tests
                                                                                                                      oils. Therefore,
      to measure the fuel efficiency properties of lubricants can also be performed in fired and motored
before discussing lubricant properties that affect fuel economy, the issues that can arise in measuring
      engine tests, as well as system level efficiency tests for automatic transmission fluids or axle oils.
fuel economy in vehicles versus isolated systems needs to be explored.
      Therefore, before discussing lubricant properties that affect fuel economy, the issues that can arise in
      In vehicle fuel
      measuring    fuel economy
                         economyintesting,
                                         vehiclesvehicles    are driven
                                                  versus isolated            under
                                                                       systems   needsdifferent     driving cycles such as those
                                                                                         to be explored.
shown in In Figure   2 (US06    and   the  New    European     Driving     Cycle    (NEDC)
               vehicle fuel economy testing, vehicles are driven under different driving        refer   to cycles
                                                                                                           driving    cycles
                                                                                                                   such       required
                                                                                                                         as those
by the   US Environmental
      shown    in Figure 2 (US06    Protection
                                        and the NewAgency      (EPA)Driving
                                                         European         and European
                                                                                  Cycle (NEDC)  Union,     respectively).
                                                                                                       refer  to driving cycles That is,
thererequired
       are accelerations
                 by the US and      decelerations
                                Environmental           as wellAgency
                                                  Protection     as steady-state
                                                                            (EPA) and   speed     conditions.
                                                                                           European      Union, These      changes in
                                                                                                                   respectively).
engineThat  is, there conditions
         operating      are accelerations     and decelerations
                                      will result   in changes in     asthe
                                                                          well  as steady-state
                                                                             temperature,            speed conditions.
                                                                                                 pressure                   These
                                                                                                              and shear conditions
      changes   in engine    operating    conditions   will result  in  changes   in the  temperature,
that a lubricant experiences. These changes in physical conditions will affect the rheological              pressure   and  shear and
      conditions    that   a  lubricant    experiences.    These     changes    in   physical
frictional properties of lubricants and will be discussed in more detail in Sections 3–5.        conditions      will  affect  the
      rheological and frictional properties of lubricants and will be discussed in more detail in
      Human or robot drivers are used to follow the specific driving cycles and the drivers must match
      Sections 3–5.
the speedHuman
            versus or time    profiles within specific tolerances. However, there is an inherent imprecision in
                          robot drivers are used to follow the specific driving cycles and the drivers must
following    these    profiles
      match the speed versus     whentimecontrol
                                             profilesis within
                                                        through      the gas
                                                                specific        and brake
                                                                            tolerances.          pedals.
                                                                                           However,          Forisexample,
                                                                                                         there       an inherentduring
the development
      imprecision in of      the Sequence
                         following              VID fuel
                                       these profiles    wheneconomy
                                                                control is  test,  a consortium
                                                                               through     the gas and   of brake
                                                                                                             companies
                                                                                                                     pedals.reviewed
                                                                                                                               For
automaker-submitted
      example, during the     datadevelopment
                                    from more than  of the600Sequence
                                                               vehicle tests
                                                                           VID [94].     The conclusions
                                                                                  fuel economy                   were that changes
                                                                                                       test, a consortium        of
      companies
in lubricant        reviewed
               properties         automaker-submitted
                               were                           data from
                                     too subtle to statistically              more than
                                                                         determine     in the600      vehicle
                                                                                                 vehicle        tests
                                                                                                            tests.     [94]. The
                                                                                                                    Multiple    drivers
were conclusions
       used in thiswere
                      study that changes
                               and          in lubricant
                                    the effect            properties
                                                 of the driver    maywere welltoo  subtle
                                                                                have         to statistically
                                                                                       overwhelmed          thedetermine
                                                                                                                 results. Asin the
                                                                                                                                a result,
      vehicle  tests.  Multiple   drivers    were  used   in this  study   and   the  effect
vehicle fuel economy procedures have been developed with better control of the driving cycle   of  the  driver   may   well  have and
      overwhelmed the results. As a result, vehicle fuel economy procedures have been developed with
lubricant   effects can be observed [26]. Even with vehicle testing improvements, the cycles shown do
      better control of the driving cycle and lubricant effects can be observed [26]. Even with vehicle
not always reflect real world driving conditions, and in real world conditions, the effect of lubricants
      testing improvements, the cycles shown do not always reflect real world driving conditions, and in
may be    too small to statistically quantify [94].
      real world conditions, the effect of lubricants may be too small to statistically quantify [94].

                                 140
                                                               US06
           Vehicle speed, km/h

                                 120
                                 100
                                         80
                                         60
                                         40
                                         20
                                          0
                                               0   100   200          300             400              500              600
                                                                  Test time, s
                                         140
                                                                  NEDC
                   Vehicle speed, km/h

                                         120
                                         100
                                          80
                                          60
                                          40
                                          20
                                          0
                                               0   200   400              600          800              1000             1200
                                                                      Test time, s

      Figure 2. Driving
          Figure         cycles
                 2. Driving     used
                            cycles    toto
                                   used  measure
                                           measurevehicle
                                                   vehicle fuel economy.NEDC
                                                           fuel economy. NEDC  = New
                                                                             = New   European
                                                                                   European     Driving
                                                                                            Driving Cycle.Cycle.

                        In fired engine or system level tests, fuel efficiency is typically measured under a variety of
     In fired engine or system level tests, fuel efficiency is typically measured under a variety of steady
      steady state conditions that are computer controlled to very tight tolerances. Table 1 shows the
state conditions that are computer controlled to very tight tolerances. Table 1 shows the steady state
      steady state operating conditions for the Sequence VID engine test (ASTM D7589) which is used to
operating  conditions
      measure   the fuelfor the Sequence
                         economy          VID engine
                                   performance         test (ASTM
                                                 of passenger      D7589)
                                                              car motor     which
                                                                         oils.     is used
                                                                               Steady state to measureVID
                                                                                             Sequence  the fuel
economy performance of passenger car motor oils. Steady state Sequence VID operating conditions are
Lubricants 2018, 6, 68                                                                                                                   4 of 15

based on six conditions that represent a 2006 Buick LaCrosse being driven using the US EPA Federal
Test Procedure and Highway Fuel Economy cycles. In addition, fuel economy is measured for up
to 30 min under each Sequence VID steady state condition, so there is plenty of time for the system
to stabilize. This improves the precision of the system level tests versus the vehicle tests. However,
in these Lubricants
         system2018,level
                       6, xtests, fuelREVIEW
                            FOR PEER   economy is not measured during transient operating conditions
                                                                                               4 of 15 where
a significant amount of fuel is consumed.
           operating conditions are based on six conditions that represent a 2006 Buick LaCrosse being driven
           using 1.the
          Table        US EPA
                     Steady stateFederal Test used
                                  conditions  Procedure and Highway
                                                   to measure          Fuel Economy
                                                              fuel economy            cycles. VID
                                                                            in the Sequence   In addition, fuel
                                                                                                  engine test.
          economy is measured for up to 30 min under each Sequence VID steady state condition, so there is
          plenty of time for the
         Parameter               system
                              Stage  1 to stabilize.
                                             Stage 2This improves
                                                             Stage 3the precision
                                                                            Stageof4 the system level
                                                                                            Stage 5 tests versus
                                                                                                          Stage 6
          the vehicle tests. However, in these system level tests, fuel economy is not measured during
        Speed,  r/min
          transient operating2000  ± 5 where
                               conditions   2000a ±  5      1500
                                                  significant    ± 5 of fuel695
                                                              amount             ±5
                                                                              is consumed.  695 ± 5       695 ± 5
       Load Cell, N·m        105.0 ± 0.1 105.0 ± 0.1 105.0 ± 0.1           20.0 ± 0.1     20.0 ± 0.1    40.0 ± 0.1
       Oil Gallery, ◦C         115 ± 2conditions65used
                                                   ± 2to measure   ± economy
                                                              115fuel 2      115  ±Sequence
                                                                                    2       35 ±  2 test. 115 ± 2
                Table  1. Steady state                                       in the         VID engine

                          Parameter          Stage 1       Stage 2        Stage 3      Stage 4      Stage 5      Stage 6
      Fuel consumption        in vehicle
                      Speed, r/min        2000tests
                                                ± 5 is usually
                                                         2000 ± 5 determined
                                                                         1500 ± 5        from
                                                                                          695 ± 5measurements
                                                                                                       695 ± 5      695of± vehicle
                                                                                                                           5          emissions.
                    Load Cell, N·m
Using physical properties                105.0fuel,
                                    of the     ± 0.1 such
                                                        105.0as ± 0.1   105.0 ±and
                                                                   density       0.1 fuel
                                                                                        20.0 ±heating
                                                                                               0.1 20.0 capacity,
                                                                                                           ± 0.1 40.0 ±the0.1 amount of fuel
                     Oil Gallery, °C       115 ± 2         65 ± 2         115 ± 2         115 ± 2       35 ± 2      115 ± 2
consumed is calculated. Environmental conditions affect the fuel combustion process and emissions.
In vehicle fuel
              Fuel economy
                     consumption  testing,      theretests
                                       in vehicle        are ismethodologies
                                                                    usually determined    that from
                                                                                                 are described
                                                                                                         measurements  to correct
                                                                                                                             of vehiclefor these
environmental
         emissions.conditions.
                      Using physical  These      corrections
                                           properties     of the arefuel, not
                                                                           suchalways
                                                                                   as densityperfect     andheating
                                                                                                  and fuel       can skew      fuel the
                                                                                                                         capacity,     economy
         amount in
measurements      of fuel consumed
                      vehicle   tests. isIncalculated.
                                             system level  Environmental        conditions
                                                                  tests and vehicle            affect
                                                                                            tests, thetheamount
                                                                                                           fuel combustion      process
                                                                                                                     of fuel consumed         can
         andmeasured.
be directly   emissions. InThis
                              vehicle   fuel economycan
                                    measurement            testing,
                                                                 be athere
                                                                        more areaccurate
                                                                                  methodologiesway to thatdetermine
                                                                                                            are described thetofuel
                                                                                                                                 correct
                                                                                                                                       efficiency
         for these environmental conditions. These corrections are not always perfect and can skew fuel
properties of lubricants. System level tests in motored engines, transmissions and axles have also been
         economy measurements in vehicle tests. In system level tests and vehicle tests, the amount of fuel
designedconsumed
           to measure     lubricant
                     can be               efficiencyThis
                              directly measured.         by measurement
                                                               tracking thecan    torque     into accurate
                                                                                      be a more    and outway    of the  mechanical
                                                                                                                     to determine     the device
of interest. This   is a more     precise     way    to  track     the  ability    of  lubricants      to
         fuel efficiency properties of lubricants. System level tests in motored engines, transmissions andreduce     friction   and    improve
efficiency. However,
         axles have alsothese      tests aretoa measure
                           been designed           further lubricant
                                                                step away      from the
                                                                            efficiency        “real world”
                                                                                          by tracking             measurement
                                                                                                         the torque    into and outof   of vehicle
         the mechanical
fuel efficiency  required  device    of interest. This
                               by government                is a more precise way to track the ability of lubricants to
                                                       regulations.
         reduce friction and improve efficiency. However, these tests are a further step away from the “real
      In vehicle   and fired engine tests, the fuel efficiency of candidate lubricants is compared to that
         world” measurement of vehicle fuel efficiency required by government regulations.
of baseline lubricants.       The intent is to calculate the percent fuel economy improvement (%FEI) of
              In vehicle and fired engine tests, the fuel efficiency of candidate lubricants is compared to that
the candidate    lubricant     versus
         of baseline lubricants.          the baseline
                                    The intent                lubricant.
                                                  is to calculate             For example,
                                                                      the percent    fuel economy  Figure     3 shows(%FEI)
                                                                                                       improvement         the fuel    economy
                                                                                                                                  of the
performance      measured
         candidate   lubricantfor    a baseline
                                 versus               engine
                                           the baseline            oil in For
                                                             lubricant.    a vehicle
                                                                                 example,  over   time
                                                                                              Figure      (blue line).
                                                                                                        3 shows    the fuelIneconomy
                                                                                                                               between tests
with theperformance
           baseline oil, measured
                            candidate for a oils
                                             baseline
                                                    are engine
                                                          tested.oilThe in a fuel
                                                                              vehicle    over timeperformance
                                                                                     economy          (blue line). In between       tests
                                                                                                                         of the baseline       oil
improves with
            as the
                thebaseline
                     vehicleoil,is candidate
                                    aged andoils    thisareoccurs
                                                              tested. rapidly
                                                                        The fuel at economy
                                                                                        lower performance
                                                                                                  vehicle miles    of the
                                                                                                                       andbaseline     oil
                                                                                                                              more slowly       at
         improves as the vehicle is aged and this occurs rapidly at lower vehicle miles and more slowly at
higher vehicle miles. Running-in conditions affect fuel economy since parts are worn or tribofilms
         higher vehicle miles. Running-in conditions affect fuel economy since parts are worn or tribofilms
form onform
          the surfaces    of engine
               on the surfaces            parts
                                  of engine       (see
                                               parts     Section
                                                      (see  Section5). 5). These    effects
                                                                           These effects       also
                                                                                             also varyvary
                                                                                                         withwith    the engine
                                                                                                                the engine           oils in use
                                                                                                                             oils in use
during these
         duringrunning-in       timetime
                 these running-in       frames.
                                             frames.

                                             Figure
                                          Figure    3. Effectofofvehicle
                                                 3. Effect        vehicle age
                                                                          ageon
                                                                              onfuel
                                                                                 fueleconomy.
                                                                                       economy.
Lubricants 2018, 6, 68                                                                                       5 of 15

      The issue is determining which result for the baseline oil needs to be compared to the result
for the candidate oil. In Figure 3, straight lines are drawn between each baseline oil fuel economy
result. Fuel economy for candidate oils is then compared to the baseline oil result on the point of the
line at which the candidate oils are tested. For example, candidate oil AA was tested twice in this
vehicle. In one case, the measured fuel economy is above the line between adjacent baseline results,
and in another case, the measured fuel economy is below the line between adjacent baseline results.
Furthermore, the result for the test with AA at approximately 8500 miles is in between two baseline
oils that differ by a large amount (~0.7 MPG). It is not clear which result for AA is correct. Similar
shifts in baseline oil results are observed in fired engine tests. More sophisticated treatments of the
changes in baseline oil results have been used to improve the precision of fuel economy testing.
      Overall, it is very critical to be aware of the methodology used to measure fuel efficiency when
interpreting the fuel economy performance of lubricants. The balance is between improvement in the
precision of the test and determining fuel efficiency performance that is relevant to the actual operation
of a vehicle. This discussion is not meant to judge which methodology is the best for achieving this
balance. There are many ways that researchers have used to achieve the proper balance. Instead,
when summarizing the common properties of lubricants that affect fuel efficiency, the overall trends
in lubricant performance need to be considered since fuel efficiency results from separate studies are
influenced by many factors that are not related to the lubricant.

3. Effect of Viscosity on Fuel Economy
     It is generally agreed that fuel economy is improved when a lower viscosity lubricant is used
in place of a higher viscosity lubricant. This is reflected in engine oil performance and viscosity
specifications as well as the general trend for the need for lower viscosity transmission and axle oils.
For example, Table 2 shows key differences between the SAE J300 engine oil viscosity specifications in
2009 and 2015 for selective viscosity grades. The low temperature cranking (Cold Cranking Simulator
CCS: ASTM D5293) and pumping viscosity (mini-rotor viscometer (MRV): D4684) limits describe the
tradeoff between being able to start an engine and the ability for the oil to be pumped around an
engine, respectively. These low temperature performance specifications have not changed between
2009 and 2015.

             Table 2. Selected SAE J300 engine oil viscosity classification specifications: 2009 vs. 2015.

                                                                        Kinematic          High Shear Viscosity
                         Low T Cranking        Low T Pumping
     SAE Viscosity                                                  Viscosity at 100 ◦ C    at 150 ◦ C (mPa·s)
                         Viscosity (mPa·s)     Viscosity (mPa·s)
        Grade                                                        (mm2 /s) ASTM            ASTM D4683,
                          ASTM D5293            ASTM D4684
                                                                      D445 or D7042          D4741 or D5481
          2009
          0W             2.9
          2015
          0W             2.0
           16                                                             6.1–8.2                   >2.3
           20                                                             6.9–9.3                   >2.6
           30                                                             9.2–12.5                  >2.9

      High shear viscosity (HSV), which can be measured using several ASTM methods (D4683, D4741
or D5481) is the critical rheological property that influences fuel economy. In the past five years, several
new high temperature viscosity categories (8, 12 and 16) have been introduced. The limits on HSV at
150 ◦ C are >1.7 mPa·s, >2.0 mPa·s and >2.3 mPa·s, respectively, for these three viscosity grades. Today,
Lubricants 2018, 6, 68                                                                                           6 of 15

many engine manufacturers recommend engines oils that meet the SAE 0W20 and SAE 5W20 viscosity
specifications, and a few engine manufacturers recommend engine oils that meet the SAE 0W16 and
0W8 viscosity specifications. Engine oils that meet the 8 and 12 viscosity specifications are not yet on
the market, but clearly engine oils with these lower HSVs could be recommended to further improve
fuel economy.
      In previous correlations between viscosity and fuel efficiency, viscosity under conditions other
than those at high shear and 150 ◦ C have been measured. Kinematic viscosity at 40 ◦ C, viscosity
index and even CCS viscosity at low temperature have been used in correlations to fuel efficiency.
These properties are easy to measure using ASTM methods. ASTM has also created methods to
measure the high shear viscosity of engine oils at temperatures lower than 150 ◦ C (for example, D6616).
While these ASTM methods make it easy to measure the rheological properties of lubricants at specific
conditions, Table 1 shows that fuel economy is measured at temperatures that are not specifically
described in ASTM methods.
      Furthermore, in vehicle efficiency tests and some system level tests, the temperature of the
lubricant is not controlled, and the lubricant may encounter different shear and pressure regimes.
Shear can reduce the viscosity of the lubricant and pressure can increase the viscosity of the lubricant,
which would affect fuel efficiency. Therefore, lubricant rheological properties at multiple operating
conditions need to be determined in order to get a true measure of the effect of lubricant rheology
on fuel efficiency. Table 3 shows the operating temperatures for a series of axle oils tested in an axle
efficiency rig. The HSVs of these gear oils (GOs) were measured at 100 ◦ C. The HSVs of the gear oils at
the measured operating temperatures are also shown in Table 3. GO 18 and GO 19 have the highest
100 ◦ C HSVs so we would expect these to have the poorest efficiency results. However, at operating
temperature GO 18 has the lowest high shear viscosity. It is critical to measure viscosity at the correct
operating conditions to observe the true effect of lubricant viscosity on fuel economy.

       Table 3. Viscosities and operating temperatures for gears oil in an axle efficiency rig. GO = gear oil.

                     Kinematic Viscosity     HSV at 100 ◦ C         Operating             HSV at Operating
        Oil
                       at 100 ◦ C (cSt)        (mPa·s)           Temperature (◦ C)       Temperature (mPa·s)
       GO17                 14.92                 11.91                 104                       7.72
       GO14                 15.41                 12.52                 120                       7.52
       GO13                 15.79                 13.02                 116                       7.30
       GO16                 16.21                 13.07                 119                       8.10
       GO15                 16.40                 13.09                 117                       8.38
       GO20                 17.66                 13.94                 118                      12.45
       GO18                 16.79                 14.10                 116                       7.30
       GO19                 17.11                 14.15                 129                       9.24

4. Balance of Viscosity and Elastohydrodynamic Film Thickness
      While lower viscosity fluids clearly provide improved fuel efficiency it is also well known that
lower viscosity fluids form thinner elastohydrodynamic (EHD) films. This is illustrated in Figure 4
where the film thickness of several gear oils and transmission fluids are shown as a function of
temperature. For the gear oils, the 100 ◦ C kinematic viscosities are all ~15.0 cSt, and for the transmission
fluids, the 100 ◦ C kinematic viscosities are all ~7.5 cSt. Film thickness was measured using an optical
interferometer at an entrainment speed of 1 m/s and at 35 N. Of course, this is a very familiar graph
to tribologists.
      Other familiar graphs are shown in Figures 5 and 6 where friction as a function of film thickness
is shown. The data in Figure 5 is for a series of different base oils (designated by their American
Petroleum Institute (API) classification) and the data in Figure 6 is for a base oil with different anti-wear
additives. For the base oils shown in Figure 5, the 100 ◦ C kinematic viscosities are all ~4.0 cSt. For the
lubricants shown in Figure 6, the 100 ◦ C kinematic viscosities are all ~4.0 cSt. In both graphs, friction
was measured using a Mini-Traction Machine (MTM) at 100 ◦ C, 20% slide-to-roll ratio and 35 N on
Lubricants 2018, 6, 68                                                                                                                             7 of 15

Lubricants 2018, 6, x FOR PEER REVIEW                                                                                                              7 of 15
Lubricants 2018, 6, x FOR PEER REVIEW                                                                                                             7 of 15
steel surfaces with similar surface roughness. Typically, MTM friction curves are plotted as friction
 were measured
versus
were    measured
          speed. The     as aEHD
                         as   a function
                                 function     of speed
                                                  speed under
                                     film thicknesses
                                             of              under
                                                               of the   the
                                                                       the    same
                                                                          fluids
                                                                             same   shownload and
                                                                                        load     and     temperature
                                                                                                 in Figures
                                                                                                       temperature            conditions
                                                                                                                   5 and 6conditions
                                                                                                                                were measured as friction
                                                                                                                                             as   friction
                                                                                                                                                       as a
 measurements
function
measurements of speed   in the
                       in   the
                            under MTM.
                                 MTM.      Therefore,
                                      theTherefore,
                                            same loadMTM     MTM      friction can
                                                             and temperature
                                                                     friction      can be  be plotted
                                                                                              plotted as
                                                                                          conditions        as
                                                                                                            asaafriction
                                                                                                                    function
                                                                                                                   function       of speed.
                                                                                                                                     speed.
                                                                                                                              measurements
                                                                                                                                 of                 in the
MTM.   As   film
         Therefore, thickness
                           MTM      decreases
                                    friction    can (orbe if  rougher
                                                           plotted     as   surfaces
                                                                            a  function     are
                                                                                             of   used),
                                                                                                  speed.
      As film thickness decreases (or if rougher surfaces are used), the surfaces start to come into          the    surfaces      start  to  come     into
 contact
       As  and
           film    friction
                  thickness     increases.
                                  decreases    Again,
                                                (or   if   this
                                                         rougher  is  not   surprising.
                                                                      surfaces      are         It
                                                                                           used),  should
                                                                                                     the
contact and friction increases. Again, this is not surprising. It should be noted that in Figure 6, the          be
                                                                                                           surfaces   noted
                                                                                                                         start  that
                                                                                                                                 to   in
                                                                                                                                    come  Figure
                                                                                                                                            into     6, the
                                                                                                                                                  contact
 blackfriction
and
black    line shows
        line    shows
                  increases. an anti-wear
                             an   anti-wear       additive
                                   Again, thisadditive           that results
                                                    is not surprising.
                                                                that      results      in aa reduction
                                                                                It should
                                                                                     in       reduction
                                                                                                 be noted that    in friction
                                                                                                                 in   friction
                                                                                                                        in Figure  at 6,
                                                                                                                                  at   low
                                                                                                                                      low     EHD
                                                                                                                                         theEHD
                                                                                                                                              blackfilmfilm
                                                                                                                                                       line
 thickness
shows    an    (compared
              anti-wear            to
                              additive the   blue
                                           that        line)
                                                 results     inbut
                                                                 a     causes
                                                                   reduction       friction
                                                                                   in   friction
thickness (compared to the blue line) but causes friction to increase at higher film thickness.   toat increase
                                                                                                         low    EHD    at   higher
                                                                                                                         film          film
                                                                                                                               thickness      thickness.
                                                                                                                                             (compared
 Detergents
to
Detergents       that are
    the blue line)
                that     are known
                         but   knownfriction
                               causes      to influence
                                          to   influence       LSPI also
                                                      to increase
                                                              LSPI      also
                                                                       at       havefilm
                                                                           higher
                                                                               have       an effect
                                                                                         an   effect
                                                                                               thickness.on friction
                                                                                                        on     friction
                                                                                                                  Detergentsmeasured
                                                                                                                           measuredthat arein the
                                                                                                                                          in   the MTM
                                                                                                                                              known MTM   to
 (100  °C,
influence   20%
              LSPI  slide-to-roll
                      also    have   anratio,
                                         effect 35onN    and
                                                       friction100   mm/s)
                                                                   measured      [8,53].
                                                                                   in   the  Oils
                                                                                             MTM    containing
                                                                                                        (100    ◦ C,   Ca-based
                                                                                                                      20%             detergents
                                                                                                                             slide-to-roll   ratio,   have
                                                                                                                                                      35  N
(100 °C, 20% slide-to-roll ratio, 35 N and 100 mm/s) [8,53]. Oils containing Ca-based detergents have
 lower
and   100friction
            mm/s)     coefficients
                         [8,53].    Oils(~0.040)
                                          containing than     oils  containing
                                                             Ca-based       detergents  Mg-based
                                                                                               have
lower friction coefficients (~0.040) than oils containing Mg-based detergents (~0.070). In developing    detergents
                                                                                                         lower             (~0.070).
                                                                                                                    friction            In
                                                                                                                                coefficientsdeveloping
                                                                                                                                                 (~0.040)
 new lubricant
than
new    lubricant
       oils  containingtechnology,
                               Mg-based
                      technology,         data
                                         data     (such as
                                             detergents
                                                 (such      as(~0.070).
                                                                 that seen
                                                                that     seen    in
                                                                              Inin    Figures 4–6)
                                                                                  developing
                                                                                     Figures       4–6)
                                                                                                      newis islubricant
                                                                                                                 generated
                                                                                                                generated         under very
                                                                                                                             technology,
                                                                                                                                 under     very
                                                                                                                                              data tightly
                                                                                                                                                     (such
                                                                                                                                                  tightly
 controlled
as  that  seen  conditions.
                 in  Figures       However,
                                  4–6)  is         in
                                            generated   a  vehicle,
                                                            under        engine,
                                                                      very    tightly transmission
                                                                                          controlled
controlled conditions. However, in a vehicle, engine, transmission or axle, different well-designed         or    axle,
                                                                                                           conditions.     different
                                                                                                                              However,  well-designed
                                                                                                                                            in  a vehicle,
 lubricants
engine,
lubricants     do not
               do    not always
           transmission     always
                                or axle,operate     under
                                            different
                                       operate     under       the same
                                                                     same conditions.
                                                          well-designed
                                                              the              conditions.
                                                                                 lubricants This   This
                                                                                                   do   notmeans
                                                                                                               always
                                                                                                           means        that
                                                                                                                       that    whileunder
                                                                                                                           operate
                                                                                                                              while     there is
                                                                                                                                       there    is ample
                                                                                                                                                the ample
                                                                                                                                                     same
 evidence that
conditions.
evidence      that
                 This reducing
                         means that
                     reducing        viscosity     improves
                                          whileimproves
                                    viscosity       there is ample efficiency,
                                                                           evidence
                                                                   efficiency,      ifif viscosity
                                                                                          viscosity
                                                                                           that reducing is reduced
                                                                                                        is   reduced
                                                                                                                   viscositytoo improves
                                                                                                                           too    much, the
                                                                                                                                 much,     theefficiency,
                                                                                                                                                 effect of
                                                                                                                                                effect    of
 viscosity
if viscosity  onis efficiency
                    reduced        may
                                  too     not
                                       much,
viscosity on efficiency may not be evident.     be
                                                 the evident.
                                                        effect  of   viscosity     on     efficiency      may      not   be  evident.

                                            200
                                           200
                                            180
                                           180
                                            160
                                           160
                                                                                   GearOils
                                                                                        Oils
                                    (nm)

                                            140                                    Gear
                          Thickness(nm)

                                           140
                                            120
                                           120
                     FilmThickness

                                            100
                                           100
                                             80
                                            80
                    Film

                                             60
                                            60
                                             40
                                            40                              TransmissionFluids
                                                                            Transmission Fluids
                                             20
                                            20
                                              0
                                             0
                                                     40          50    60     70       80          90      100    110        120       130
                                                    40          50    60     70       80          90      100    110        120       130
                                                                                      Temperature(C)
                                                                                     Temperature  (C)

        Figure 4.
       Figure
       Figure  4. Effect
                  Effect  of
                   Effectof   temperature
                          of temperature  on
                              temperature on   film
                                           on film   thickness
                                               film thickness   for
                                                     thickness for   two
                                                                for two  different
                                                                     two different gear oils
                                                                         different gear
                                                                                   gear oils and
                                                                                        oils and two
                                                                                             and  two different
                                                                                                 two  different
                                                                                                      different
        transmissionfluids.
       transmission
       transmission  fluids.
                     fluids.

                                                    0.08
                                                   0.08

                                                    0.07
                                                   0.07

                                                    0.06
                                                   0.06

                                                    0.05
                                           Coef.

                                                   0.05
                                  FrictionCoef.

                                                    0.04
                                                   0.04
                                 Friction

                                                    0.03
                                                   0.03
                                                                                                                        GroupIIII
                                                                                                                        Group
                                                    0.02
                                                   0.02                                                                      GroupIIIs
                                                                                                                             Group IIIs
                                                    0.01
                                                   0.01
                                                                                                                        GroupIV
                                                                                                                        Group IV
                                                    0.00
                                                   0.00
                                                            1                                10                                      100
                                                           1                                10                                      100
                                                                                    Film Thickness (nm)
                                                                                   Film Thickness (nm)
                                                    Figure5.
                                                    Figure 5.Friction
                                                              Frictionversus
                                                                       versusfilm
                                                                              filmthickness
                                                                                   thicknessfor
                                                                                             forfour
                                                                                                 fourdifferent
                                                                                                      differentbase
                                                                                                                baseoils.
                                                                                                                     oils.
                                                    Figure 5. Friction versus film thickness for four different base oils.
Lubricants 2018, 6, 68                                                                                                                              8 of 15
       Lubricants 2018, 6, x FOR PEER REVIEW                                                                                                  8 of 15

       Lubricants 2018, 6, x FOR PEER REVIEW                                                                                                  8 of 15
                                                          0.14

                                                         0.14
                                                          0.12                   AW1

                                                         0.12                   AW1
                                                          0.10
                                                                                                              AW2

                                           Coef. Coef.
                                                         0.10
                                                                                AW3
                                                          0.08
                                                                                                              AW2
                                         Friction
                                                                               AW3
                                                         0.08
                                                          0.06
                                  Friction

                                                         0.06
                                                          0.04

                                                         0.04
                                                          0.02

                                                         0.02
                                                          0.00
                                                                 1                              10                                100
                                                         0.00                         Film Thickness (nm)
                                                                 1                             10                                 100
                                                                                     Film Thickness (nm)
               Figure
           Figure      6. Friction
                  6. Friction      versus
                                versus    film
                                       film    thicknessfor
                                             thickness   forlubricants
                                                             lubricants with
                                                                        withdifferent
                                                                             differentanti-wear (AW)
                                                                                        anti-wear    additives.
                                                                                                  (AW)  additives.
                 Figure 6. Friction versus film thickness for lubricants with different anti-wear (AW) additives.
             The question is whether this shift in lubrication regimes and subsequent increase in friction is
      The question is whether this shift in lubrication regimes and subsequent increase in friction is
       observed in fuel efficiency testing. Figure 7 shows the fuel economy properties of engine oils with
observed    The  question
             in fuel          is whether      this Figure
                                                    shift in lubrication     regimes      and subsequent      increase engine
                                                                                                                          in friction    is with
       different  150 efficiency       testing.
                        °C HSVs measured                     7 showswith
                                                    in four vehicles       the  fuelL,economy
                                                                                2.3       3.1 L, 3.8 properties
                                                                                                     L and 5.7 L of                 oils
                                                                                                                      engines [45,88].
      observed ◦in fuel efficiency testing. Figure 7 shows the fuel economy properties of engine oils with
different
       These150     C HSVs
               engine    oils allmeasured
                                   contain theinsame  fouradditive
                                                            vehicles     with 2.3
                                                                       systems    andL,     3.1 L,control
                                                                                         friction  3.8 L and
                                                                                                           agents.5.7ForL engines
                                                                                                                            all of these[45,88].
      different 150 °C HSVs measured in four vehicles with 2.3 L, 3.1 L, 3.8 L and 5.7 L engines [45,88].
Thesefluids,
        engine theoils   all contain
                    boundary      frictionthecoefficients
                                                same additive
                                                            measured  systems     andFrequency
                                                                          in a High       friction control     agents.Rig
                                                                                                      Reciprocating         Forat all
                                                                                                                                  100of °Cthese
      These engine oils all contain the same additive systems and friction control agents. For all of these ◦
fluids,  the
       and    boundary
            130  °C and 4 friction
                              N load are coefficients
                                              ~0.130. The  measured       in
                                                             100 °C kinematic a High      Frequency
                                                                                      viscosities  and Reciprocating
                                                                                                        high shear viscosities
      fluids, the boundary friction coefficients measured in a High Frequency Reciprocating Rig at 100 °C                      Rig  at  100 C
                                                                                                                                       for
and 130   ◦ Cfluids
       these  and   4 varied
                       N  load  inare
                                    a similar
                                       ~0.130.   fashion
                                                   The  100  ◦ Cthe
                                                          with         kinematic
                                                                  kinematic          viscositiesand
                                                                                 viscosities      varying
                                                                                                      high   from ~13.0
                                                                                                             shear           to ~5.5 for
                                                                                                                      viscosities     cSt.these
      and 130 °C and 4 N load are ~0.130. The 100 °C kinematic viscosities and high shear viscosities for
       The
fluidsthese highinshear
        varied             viscosities    are shown   thein Figure 7. viscosities
                                                                         For the three       vehicles  with~13.0
                                                                                                              2.3 L,to3.1   L and   3.8 L high
             fluidsavaried
                       similar in fashion
                                   a similarwithfashion   kinematic
                                                          with   the kinematic viscositiesvarying   from
                                                                                                  varying   from ~13.0  ~5.5to cSt.
                                                                                                                                ~5.5 The
                                                                                                                                      cSt.
       engines,
shearThe         as
        viscosities   the  viscosity
                        areviscosities
                             shown in   of  the   engine   oils  is reduced,     fuel  economy     measured      under     city  driving
            high shear                    areFigure
                                               shown7.in ForFigurethe7.three
                                                                         For thevehicles      with 2.3
                                                                                    three vehicles       L, 2.3
                                                                                                      with    3.1 L,L 3.1
                                                                                                                      andL 3.8andL3.8 engines,
                                                                                                                                         L
       conditions increases, as does combined city and highway fuel economy (COMFE). The standard
      engines,   as  the  viscosity     of the    engine  oils  is  reduced,    fuel   economy
as the viscosity of the engine oils is reduced, fuel economy measured under city driving conditionsmeasured      under     city  driving
       deviation in the measurement of vehicle fuel economy is ~0.2%. Fuel economy measured under
      conditions
increases,   as doesincreases,
                         combined  as does
                                        city combined
                                               and highway  city fuel
                                                                   and economy
                                                                         highway fuel        economy
                                                                                        (COMFE).        (COMFE).
                                                                                                      The  standard     The    standardin the
                                                                                                                           deviation
       highway conditions also increases as viscosity decreases, except when viscosity is less than 2.7
      deviation
measurement        in  the   measurement         of  vehicle  fuel   economy       is ~0.2%.    Fuel  economy      measured       under
       mPa·s. Forofthe vehicle
                          vehiclefuelwitheconomy
                                           the 5.7 L is    ~0.2%.
                                                        engine,       Fuel economy
                                                                   a reduction              measured
                                                                                  in viscosity    has nounder
                                                                                                          effect on highway       conditions
                                                                                                                       fuel economy.
      highway conditions also increases as viscosity decreases, except when viscosity is less than 2.7
also increases
       Therefore,asdepending
                       viscosity on  decreases,
                                         the vehicle except   when viscosity
                                                        or operating      conditions,is less   than 2.7 in
                                                                                           a reduction   mPa    ·s. For can
                                                                                                            viscosity      the improve
                                                                                                                                vehicle with
      mPa·s. For the vehicle with the 5.7 L engine, a reduction in viscosity has no effect on fuel economy.
the 5.7  L engine,
       fuel efficiency,a reduction
                          but there isina viscosity
                                             limit to how hasmuch
                                                                no effect     on fuel
                                                                       viscosity    can beeconomy.
                                                                                             reduced Therefore,
                                                                                                       before theredepending
                                                                                                                        is no effect of  on the
      Therefore, depending on the vehicle or operating conditions, a reduction in viscosity can improve
vehicleviscosity
          or      on fuel conditions,
             operating      economy. a reduction in viscosity can improve fuel efficiency, but there is a limit
      fuel efficiency, but there is a limit to how much viscosity can be reduced before there is no effect of
to how    much on
      viscosity   viscosity
                      fuel       can be reduced before there is no effect of viscosity on fuel economy.
                         2.0economy.
                                                                     Vehicles with 2.3L; 3.1L; 3.8L Engines
                                                                                                                          HWY
                                 1.5
                                 2.0
                                                                     Vehicles with 2.3L; 3.1L; 3.8L Engines               City
                                 1.0                                                                                      HWY
                                 1.5                                                                                      COMFE
                                                                                                                          City
                                 0.5
                                 1.0
                     %FEI %FEI

                                                                                                                          COMFE
                                 0.0
                                 0.5
                                  -0.5
                                  0.0
                                  -1.0
                                 -0.5
                                                         2.0         2.5                       3.0                  3.5                 4.0
                                 -1.0                                              HSV at 150C (mPa*s)
                                     2.0                             2.5                       3.0                  3.5                 4.0
                                  2.0                                              HSV at 150C (mPa*s)
                                                                                                                          HWY
                                  1.5
                                  2.0                                       Vehicle with 5.7L Engine
                                                                                                                          City
                                  1.0                                                                                     HWY
                                  1.5                                      Vehicle with 5.7L Engine                       COMFE
                                                                                                                          City
                                  0.5
                                  1.0
                     %FEI %FEI

                                                                                                                          COMFE
                                  0.0
                                  0.5
                                  -0.5
                                  0.0
                                  -1.0
                                 -0.5
                                                         2.0         2.5                        3.0                 3.5                 4.0
                                 -1.0                                               HSV at 150C (mPa*s)
                                                         2.0         2.5                       3.0                  3.5                 4.0
                                                                                   HSV at 150C (mPa*s)

      Figure 7. Effect of viscosity on fuel economy measured in vehicles. %FEI = percent fuel economy
      improvement. HWY = highway. COMFE = combined city and highway fuel economy.
Lubricants 2018, 6, x FOR PEER REVIEW                                                                                                 9 of 15

      Figure 7. Effect of viscosity on fuel economy measured in vehicles. %FEI = percent fuel economy
      improvement. HWY = highway. COMFE = combined city and highway fuel economy.
Lubricants 2018, 6, 68                                                                                                                9 of 15

5. Lubricant Effects on Boundary and EHD Friction
5. Lubricant
      Fuel economyEffectsimprovements
                            on Boundary and     are EHD      Friction just upon a reduction in lubricant viscosity.
                                                      not dependent
ThereFuelhaseconomy
                been over        forty years are
                           improvements           of research
                                                      not dependent to understand
                                                                              just uponfriction       reduction
                                                                                            a reduction              in the viscosity.
                                                                                                             in lubricant      various
lubrication    regimes     shown     in Figures     5 and   6.  Hugh      Spikes   has  written    several
There has been over forty years of research to understand friction reduction in the various lubrication       excellent   discussions
describing
regimes shown  the in effect  of lubricant
                         Figures   5 and 6. Hughadditive
                                                       Spikestechnologies        on friction
                                                                 has written several             [6–9].discussions
                                                                                           excellent      The review       of friction
                                                                                                                       describing   the
modifier      technology        includes     the    effects    of    traditional      surfactants,
effect of lubricant additive technologies on friction [6–9]. The review of friction modifier technology Molybdenum-containing
additives,
includes the  as effects
                  well asofpolymers
                              traditional and   nanoparticles.
                                             surfactants,            These are additives that
                                                              Molybdenum-containing                    the industry
                                                                                                  additives,    as wellhasas used  and
                                                                                                                             polymers
is beginning      to  use  (nanoparticles)       to  improve      fuel    economy.     As   shown      in
and nanoparticles. These are additives that the industry has used and is beginning to use (nanoparticles) Figure    5, it is also well
known
to improvethat changes       in base As
                 fuel economy.         oil shown
                                            structure in can    reduce
                                                           Figure     5, itfriction
                                                                             is also and
                                                                                       wellimprove
                                                                                              known that fuel economy.
                                                                                                               changes inWhat  base we
                                                                                                                                     oil
often  overlook
structure            is the friction
             can reduce      effect ofand
                                        other   surface-active
                                             improve                  agentsWhat
                                                          fuel economy.         such asweanti-wear      additives
                                                                                           often overlook       is theand  detergents
                                                                                                                       effect  of other
on  friction. Figure
surface-active           6 shows
                     agents   such that    by choosing
                                     as anti-wear           the proper
                                                       additives             anti-wear additives,
                                                                      and detergents       on friction. friction
                                                                                                           Figurecan    be controlled
                                                                                                                     6 shows    that by
as film  thickness      decreases.
choosing the proper anti-wear additives, friction can be controlled as film thickness decreases.
      Friction
       Friction control
                   control byby anti-wear
                                  anti-wear additives
                                                additives and and detergents
                                                                     detergents is   is related
                                                                                        related to to the
                                                                                                      the formation
                                                                                                            formation of  of chemical
                                                                                                                              chemical
tribofilms    on   surfaces    [7,8,10,11].   Figure    8  shows     the   effect  of the  formation
tribofilms on surfaces [7,8,10,11]. Figure 8 shows the effect of the formation of surface tribofilms      of  surface   tribofilms  on
friction
on frictionin the
               in theboundary
                         boundary   lubrication
                                      lubrication   regime
                                                       regime  [11].
                                                                  [11].AsAsthe thethickness
                                                                                   thicknessofofthe  the Zinc    dithiodiphosphate
                                                                                                          Zinc dithiodiphosphate
(ZDDP)      film   grows,     friction   increases.     The    film    is  then   worn
(ZDDP) film grows, friction increases. The film is then worn away and friction decreases. away      and   friction   decreases.    The
                                                                                                                          The growth
growth     and    wearing     away     of  the   tribofilm    is  accompanied         by   a  change
and wearing away of the tribofilm is accompanied by a change in the morphology and composition of        in  the   morphology      and
composition
the film. These   of the
                      twofilm.    These
                            factors       twofriction.
                                      affect    factors affect      friction.
                                                           Tribofilms           Tribofilms
                                                                            formed             formed anti-wear
                                                                                      by metal-free       by metal-free      anti-wear
                                                                                                                       additives   and
additives    and    detergents     have  similar    effects  on   friction.    Furthermore,      the
detergents have similar effects on friction. Furthermore, the temperature, pressure and shear stress  temperature,      pressure   and
shear   stress encountered
encountered       by a lubricant   byaffect
                                       a lubricant
                                              tribofilmaffect   tribofilmasformation,
                                                           formation,                        as do theand
                                                                                do the metallurgy         metallurgy      and surface
                                                                                                              surface roughness      of
roughness      of the   materials    on  which     the
the materials on which the tribofilms form [7,8,10,11]. tribofilms     form    [7,8,10,11].

                                                                         MTM Friction vs. Time
                                          0.140
                                                                           20 mins
                                          0.130                             46 nm
                                          0.120

                                          0.110
                                                                                30 mins         40 mins    50 mins   60 mins
                Coefficient of Friction

                                          0.100                                  27 nm           31 nm      31 nm     34 nm

                                          0.090

                                          0.080

                                          0.070
                                                        10 mins
                                          0.060
                                                         24 nm
                                          0.050

                                          0.040
                                                  0    500        1000   1500          2000         2500      3000   3500      4000
                                                                                     Time (s)

                                           Figure 8.
                                           Figure    Changesin
                                                  8. Changes inMini-Traction
                                                               Mini-Traction Machine
                                                                             Machine (MTM)
                                                                                     (MTM) friction
                                                                                           friction as
                                                                                                    as tribofilms
                                                                                                       tribofilms form.
                                                                                                                  form.

       This
       This creates
             creates aa quandary
                        quandary when
                                    when new
                                          new lubricant
                                                 lubricant technologies
                                                            technologies areare developed
                                                                                developed to
                                                                                           to control
                                                                                                control friction
                                                                                                        friction and
                                                                                                                  and
improve
improve fuelfuel economy. Different
                              Different parts
                                         parts in
                                                in aa mechanical
                                                       mechanical device
                                                                     device (engine,
                                                                             (engine, transmission
                                                                                      transmission and and axle)
                                                                                                            axle) are
                                                                                                                   are
made
made from
        from different
                different materials,
                          materials, as
                                      as well as having different surface finishes. These conditions
                                                                                                 conditions would
                                                                                                               would
all
all change
     changethe thetribofilms
                    tribofilmsformed
                                formedonon surfaces
                                             surfaces and  thethe
                                                         and   frictional  properties
                                                                   frictional         of the
                                                                               properties of tribofilm.   In an In
                                                                                              the tribofilm.    evenan
more    complicated
even more                feed-back
               complicated           loop,loop,
                              feed-back      friction   affects
                                                  friction       surface
                                                           affects  surfacetemperatures
                                                                             temperatureswhich
                                                                                            whichwouldwould control
                                                                                                              control
tribofilm
tribofilm formation
            formation andand friction,
                              friction, which
                                        which would
                                                would again
                                                         again change
                                                                change surface
                                                                          surface temperatures
                                                                                  temperatures [38,40,57]. All All of
                                                                                                                    of
this  suggests   that  developing   new  lubricant    technology    to improve   vehicle fuel  efficiency
this suggests that developing new lubricant technology to improve vehicle fuel efficiency would be         would   be
very difficult. However, as long as all aspects of tribology are considered when new technology is
developed, and these properties are measured under multiple relevant conditions, progress can be
Lubricants 2018, 6, 68                                                                                        10 of 15

made. The development of new inorganic nanoparticles to improve fuel efficiency is an excellent
example of this process [36].

6. Relative Effect of Viscosity, Boundary and EHD Friction on Fuel Economy
      In choosing the engine, transmission or axle in which to test new lubricant technology, it is
important to make sure the system is responsive to the tribological properties that are being improved.
As shown in Figure 7, there are cases where viscosity has no effect on fuel efficiency. For many years,
researchers have tried to determine the relative effect of viscosity, boundary friction and EHD friction
on efficiency in engines, transmissions and axles [42,45,88–93]. In these research efforts, a series of
lubricants with different tribological properties are developed. The fuel economy improvements as
a result of using these lubricants are measured. Finally, correlations between changes in viscosity,
boundary friction, EHD friction and fuel economy are determined. These correlations are often in
the form of multi-linear regression equations. From these equations, the general effect of changes in
tribological properties on fuel economy can be calculated.
      Table 4 shows several examples of the output from these analyses for engine oil effects on fuel
economy. The effects of a 20% reduction in viscosity, boundary friction or EHD friction on %FEI are
listed. These values are calculated from correlations between these lubricant properties and %FEI
measured in various fuel economy tests. The higher the %FEI, as a result of a 20% reduction in each
physical property, indicates a greater benefit of that physical property. The effect of each physical
property is not the same in each test. Viscosity has the greatest effect in the Sequence VIB test. Boundary
friction has the greatest effect on combined city and highway fuel economy (COMFE) in vehicles with
5.7 L engines and EHD friction has the greatest effect in the COMFE test in vehicles with 2.3 L, 3.1 L
and 3.8 L engines. Perhaps more importantly, if new additives are designed that optimize viscosity or
EHD friction, there is no point in testing them in the vehicle with the 5.7 L engine because this test
does not respond to these physical properties.

                            Table 4. Relative effect of lubricant properties on fuel economy.

                           %FEI That Results from 20%    %FEI That Results from 20%      %FEI That Results from 20%
   Fuel Economy Test
                             Reduction in Viscosity     Reduction in Boundary Friction   Reduction in EHD Friction
    COMFE Vehicles
   with 2.3 L, 3.1 L and             1.2%                           0.4%                           0.5%
      3.8 L engines
    COMFE Vehicle
                                      0.0                            0.6                            0.0
    with 5.7 L engine
      Sequence VIB                    2.0                            0.3                            0.4
      Sequence VID                    0.2                            0.3                            0.2

7. Conclusions
     The development of advanced lubricants to improve vehicle fuel efficiency can appear to be as
simple as lowering the viscosity and frictional properties of a fluid. However, applied research studies
have shown that it is quite difficult to quantify the fuel efficiency properties of advanced lubricants
in vehicles. The methodology used to measure vehicle or system level fuel efficiency will impact the
interpretation of results. This means that driving cycles, vehicle condition and control systems need to
be closely monitored. Measurement of fuel efficiency under real world driving conditions includes
many factors that are not related to the lubricant. This makes it difficult to determine the effect of the
lubricants unless all of the non-lubricant factors are taken into consideration (see Figures 2 and 3).
     To improve correlations between fuel efficiency and the rheological or tribological properties of
advanced lubricants, these properties need to be measured under relevant conditions. This means
that the effect of temperature, shear and pressure on lubricant properties needs to be considered.
This may be complicated since lubricant properties such as friction and tribofilm formation will
affect the operating conditions that the lubricant encounters (see Tables 1 and 3). Advanced lubricants
Lubricants 2018, 6, 68                                                                                         11 of 15

intended to control a single rheological or tribological property can affect other properties. For example,
the formation of tribofilms may result in a reduction in friction under one set of conditions and an
increase in friction under a different set of conditions (See Figure 6).
     Finally, advanced lubricants need to be evaluated in “real world” systems to confirm their
beneficial performance. However, all “real world” systems do not respond to all physical properties
that historically control fuel economy. The proper vehicle or system level test needs to be selected to
properly assess the benefits of new advanced lubricants (see Table 4).

Funding: This research received no external funding.
Conflicts of Interest: The author declares no conflict of interest.

References
1.    National Highway Transportation Administration. Available online: www.NHTSA.gov (accessed on 1 June 2018).
2.    United States Environmental Protection Agency. Available online: www.epa.gov (accessed on 1 June 2018).
3.    Wong, V.W.; Tung, S.C. Overview of Automotive Engine Friction and Reduction Trends—Effects of surface,
      material, and lubricant-additive technologies. Friction 2016, 4, 1–28. [CrossRef]
4.    Tung, S.C.; McMillian, M.L. Automotive tribology overview of current advances and challenges for the
      future. Tribol. Int. 2004, 37, 517–536. [CrossRef]
5.    McGuire, N. The Drive for Efficient Performance. Tribol. Lubr. Technol. 2018, 74, 34–43.
6.    Spikes, H. Friction Modifier Additives. Tribol. Lett. 2015, 60. [CrossRef]
7.    Zhang, J.; Spikes, H. On the Mechanism of ZDDP Antiwear Film Formation. Tribol. Lett. 2016, 63. [CrossRef]
8.    Topolovec-Miklozic, K.; Forbus, T.R.; Spikes, H. Film Forming and Friction Properties of Overbased Calcium
      Sulphonate Detergents. Tribol. Lett. 2008, 29, 33–44. [CrossRef]
9.    Jie, Z.; Tan, A.; Spikes, H. Effect of Base Oil Structure on Elastohydrodynamic Friction. Tribol. Lett. 2017, 65,
      1–24.
10.   Liu, Z.; Gangopadhyay, A.; Lam, W.; Devlin, M. The Effect of Friction Modifiers and DI Package on Friction
      Reduction Potential of Next Generation Engine Oils: Part I Fresh Oils; SAE 2018-01-0933; SAE: Warrendale, PA,
      USA, 2018.
11.   Devlin, M.T.; Guevremont, J.M.; Hewette, C.; Ingram, M.; Pollard, G.; Wyatt, W. Effect of Metallurgy on the
      Formation of Tribofilms and Wear Prevention; SAE 2017-01-2357; SAE: Warrendale, PA, USA, 2017.
12.   Kwak, Y.; Cleveland, C. Continuously Variable Transmission (CVT) Fuel Economy; SAE 2017-01-2355; SAE:
      Warrendale, PA, USA, 2017.
13.   Liu, Z.; Gangopadhyay, A.; Simko, S.; Lam, W.; Devlin, M.T. The Effect of Friction Modifiers and Additive
      Packages on Friction Reduction Potential of Next Generation Engine Oils—Part I: Fresh Oils. In Proceedings
      of the 72nd STLE Annual Meeting, Atlanta, GA, USA, 21–25 May 2017.
14.   Gangopadhyay, A.; Liu, Z.; Simko, S.; Lam, W.; Devlin, M.T. The Effect of Friction Modifiers and Additive
      Packages on Friction Reduction Potential of Next Generation Engine Oils—Part II: Aged Oils. In Proceedings
      of the 72nd STLE Annual Meeting, Atlanta, GA, USA, 21–25 May 2017.
15.   Guinther, G.; Devlin, M. Lubricant Developments for Advanced Drivetrain Hardware. In Proceedings of the
      71st STLE Annual Meeting, Las Vegas, NV, USA, 15–19 May 2016.
16.   Carroll, J.B. Transmission Fluids and Fuel Economy—What does the future hold? In Proceedings of the SAE
      2014 Commercial Vehicle Engineering Congress (COMVEC), Rosemont, IL, USA, 7–9 October 2014.
17.   Yang, L.; Neville, A.; Brown, A.; Ransom, P.; Morina, A. Effect of lubricant additives on the WDLC coating
      structure when tested in boundary lubrication regime. In Proceedings of the Leeds-Lyon Conference,
      Leeds, UK, 2–5 September 2014.
18.   Carroll, J.B. Targeted Transmission Fluid Property Design for Improved Fuel Economy. In Proceedings of the
      2nd International CTI Symposium China, Shanghai, China, 18–20 September 2013.
19.   Rollin, T.J. Enabling Transmission Fluid Technologies for Improved Fuel Efficiency. In Proceedings of the
      19th Annual Fuels and Lubes Asia Conference, Suzhou, China, 13–15 March 2013.
20.   Guinther, G.H.; Bell, I. Global Perspective on Fuel Economy: Correlation of Modern Engine Oil Tests to Real
      World Performance. In Proceedings of the 2013 STLE Annual Meeting, Detroit, MI, USA, 5–9 May 2013.
Lubricants 2018, 6, 68                                                                                           12 of 15

21.   Guinther, G.H.; Styer, J. Correlation of the Sequence VI Laboratory Fuel Economy Test to Real World Fuel Economy;
      SAE 2013-01-0297; SAE: Warrendale, PA, USA, 2013.
22.   Guinther, G.H. Bumper to Bumper Fuel Economy Demonstration, a Vehicle-Based Approach to Evaluating
      Energy-Saving Technologies. In Proceedings of the SAE 2013 Fuels, Lubricants & Aftertreatment Symposium,
      Long Beach, CA, USA, 18–21 November 2013.
23.   Yang, L.; Neville, A.; Brown, A.; Ransom, P.; Morina, A. Study of GMO concentration on the boundary
      lubricated W-doped DLC coatings. In Proceedings of the 40th Leeds-Lyon Symposium on Tribology,
      Lyon, France, 4–6 September 2013.
24.   Yang, L.; Neville, A.; Brown, A.; Ransom, P.; Morina, A. Effect of Temperature on Tribological Performances
      of WDLC Coatings in Model Oils. In Proceedings of the 2013 STLE Annual Meeting, Detroit, MI, USA,
      5–9 May 2013.
25.   Styer, J.; Guinther, G.H. Fuel Economy beyond ILSAC GF-5: Correlation of Modern Engine Oil Tests to Real World
      Performance; SAE 2012-01-1618; SAE: Warrendale, PA, USA, 2012.
26.   Guinther, G.H.; Styer, J. Development of a Novel Vehicle-Based Method to Assess the Impact of Lubricant Quality on
      Passenger Car Energy Efficiency; SAE 2012-01-1619; SAE: Warrendale, PA, USA, 2012.
27.   Culley, S.A.; Devlin, M.T.; McAllister, J.; Rollins, A.J.; Iyer, R.; Maelger, H. Reduction in CO2 Emissions by
      Optimization of Transmission Fluids for Improved Vehicle Fuel Economy. In Proceedings of the International
      Joint Tribology Conference, Hiroshima, Japan, 30 October–3 November 2011.
28.   Guevremont, J.M.; Garelick, K.; Sheets, R.; Hux, K.; Heaps, C.; Devlin, M.T. Composition and Frictional
      Properties of Tribofilms Formed with Ashless Antiwear Additives. In Proceedings of the 66th STLE Annual
      Meeting and Exhibition, Atlanta, GA, USA, 15–19 May 2011.
29.   Devlin, M.T.; Hux, K.; Garelick, K.; Warren, S.; Duggal, R.; Ding, J.; Culley, S.; Iyer, R.; Tersigni, S. Effect of
      ATF Physical Properties on Fuel Efficiency. In Proceedings of the Fall SAE Fuels and Lubricants Conference,
      San Diego, CA, USA, 26 October 2010.
30.   Hewette, C.; DeGonia, D.; Jao, T.-C.; Rollin, A.J. Development of Fuel Economy Axle Fluid Technology.
      In Proceedings of the 16th Annual Asia Fuels and Lubes Conference, Singapore, 1–5 March 2010.
31.   Guevremont, J.M.; Garelick, K.; Loper, J.; Lagona, J.; Sheets, R.; Hux, K.; Devlin, M.T. Influence of Friction
      Modifiers on Boundary Film Formation Properties. In Proceedings of the 65th STLE Annual Meeting and
      Exhibition, Las Vegas, NV, USA, 19 May 2010.
32.   Tersigni, S.H.; Iyer, R.N.; Henly, T.J.; Yatsunami, K.; Glasgow, M.B.; Carlson, J.; Tang, T.; Devlin, M.T.;
      Rollin, A.J. Fuel Efficiency Testing of Automatic Transmission Fluids. In Proceedings of the World Tribology
      Congress IV, Kyoto, Japan, 6–11 September 2009.
33.   Devlin, M.T.; Guevremont, J.M.; Garelick, K.; Hux, K.; Smith, A.; Jao, T.-C. The Effect of Sulfur and
      Phosphorus Content of Anti-wear Additives on Friction and Boundary Film Formation. In Proceedings of
      the Royal Society of Chemistry’s Additives 2009 Conference, York, UK, 20–21 June 2009.
34.   Devlin, M.T.; Guevremont, J.M.; Thompson, K.; Kolakowski, K.; Garelick, K.; Jao, T.-C. Boundary Film
      Formation Properties of Anti-wear/Friction Modifiers Combinations. In Proceedings of the 16th International
      Colloquium Tribology, Esslingen, Germany, 15–17 January 2008.
35.   Devlin, M.T.; Guevremont, J.M.; Thompson, K.; Smith, A.; Garelick, K.; Jao, T.-C. Boundary Film Strength
      and Composition of Tribofilms formed by Anti-wear/Friction Modifier Combinations. In Proceedings of the
      STLE Annual Meeting, Cleveland, OH, USA, 19–21 May 2008.
36.   Devlin, M.T.; Aradi, A.A.; Guevremont, J.M.; Jao, T.-C.; Abdelsayed, V.; El-Shall, M. Friction and
      Film-Formation Properties of Oil-Soluble Inorganic Nanoparticles; SAE 2008-01-2460; SAE: Warrendale, PA,
      USA, 2008.
37.   Devlin, M.T.; Kuo, C.C.; Pietras, J.M.; Yun, Z. Bench Test Modeling for Current and Future PCMO Fuel
      Economy Requirements. In Proceedings of the PetroChina Lubricants Conference 2007, Ningbo, China,
      17–18 September 2007.
38.   Devlin, M.T.; Senn, J.; Turner, T.L.; Milner, J.; Jao, T.-C. Reduction in Axle Oil Operating Temperatures by
      Fluids with Optimized Torque Transfer Efficiencies. Lubr. Sci. 2006, 18, 7–23. [CrossRef]
39.   Devlin, M.T. Effect of Changes in SAE J300 Low Temperature Specifications on Fuel Economy. In Proceedings
      of the SAE J300 Open Forum, SAE Powertrain and Fluid Systems Conference, San Antonio, TX, USA,
      25 October 2005.
You can also read