Regional Market Analysis - Economic Trends across RBC Region End 2020 Update Issue #8 February 2021
←
→
Page content transcription
If your browser does not render page correctly, please read the page content below
Regional Market Analysis
Economic Trends across RBC Region
End 2020 Update

                                         Issue #8
                                    February 2021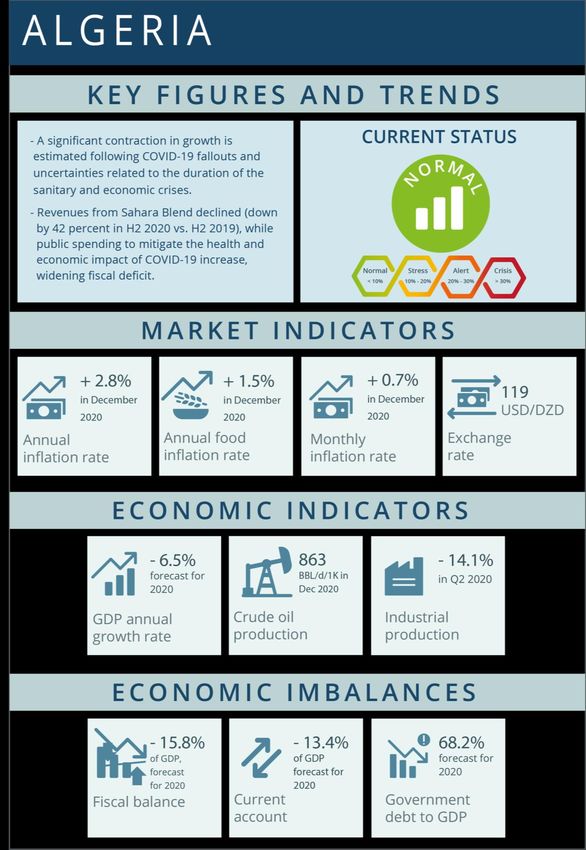
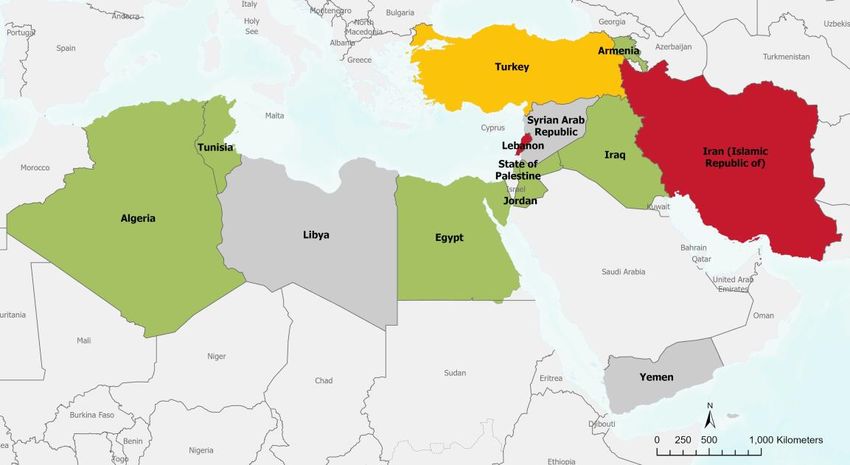
Regional Market Analysis – End 2020 Update Regional Market Analysis Introduction The aim of the report is to give a general overview about the market situation of 13 countries in the region in the simplest way possible. The Market Status indicator shows the overall level of market challenges in the country, which is classified based on annual consumer inflation or food inflation rates as follows: To better understand the market situation and the possible reasons for price trend developments, this report is complemented by a description of a different range of economic indicators. Regional Overview as of December 2020 Existing and long-lasting crises proved to have a more powerful role in suffocating economies, than the pandemic itself. Indeed, countries facing existing and ongoing crises were most affected by the pandemic as already weak economic conditions were further exacerbated. Countries affected by protracted conflict, financial crisis, social unrest or imposed sanctions (e.g. Iran, Lebanon, Libya, Syria, Yemen) were among the most severely affected by the fallouts of COVID-19. In addition, economies of the region highly dependent on oil (e.g. Algeria, Libya, Iran, Iraq) or on tourism (e.g. Egypt, Jordan, Lebanon, Tunisia) were particularly affected by the impact that the pandemic had on global demand and supply of natural resources and the consequences of policies implemented to curb the contagion. The pandemic worsened the oil crisis looming at the end of 2019, which resulted into a decline in global oil demand and significant fall in oil prices throughout 2020. This translated into an average 48 drop in oil revenues at the regional level. With respect to tourism, closure of borders and travel restrictions significantly reduced receipts from this sector (on average down 57 percent at the regional level). At the policy level, containment measures to curb the contagion, affected the retail sector, contributing to a contraction of most economies of the region in 2020. The global slowdown in the retail sector also affected the inflow of remittances (on average down 20 percent at the regional level), which accounts for the main source of capital inflows for many countries of the region while serving as a social safety net as they compensate for the lack of essential public goods. Due to the above-mentioned reasons, Lebanon recorded one the most severe contraction in economic growth (down 25 percent). Intensified conflict in Libya compound with a sharp decline in oil revenues (the main source of government revenues), resulted into an economic downturn of 41 percent in 2020. The compound effect of COVID-19 and pre-existing long-lasting crises was also reflected in general price level, with annual fluctuations varying across the countries of the region. Countries facing challenges other than the pandemic saw the most alarming and highest spikes. Syria and Lebanon recorded an annual increase in the cost of the food basket at 236 and 130 percent, respectively; prices in Iran were as high as 28 percent. In Yemen, ongoing conflict and depletion of foreign reserves were reflected in a continuous depreciation in the local currency and considerable annual increase in the value of the food basket (up more than 28 percent in December 2020). July –December 2020 Page 2
Regional Market Analysis – End 2020 Update
List of Abbreviations
m-o-m Month over month
OPEC Organization of the Petroleum Exporting Countries
Q1 First quarter
Q2 Second quarter
Q3 Third quarter
Q4 Fourth quarter
H1 First half
H2 Second half
SNAP Safety Nets Alert Platform
tb/d Thousand barrels per day
ToT Terms of trade
WFP World Food Programme
y-o-y Year over year
Overview about the covered indicators
Economic indicators:
• Current account
• Fiscal balance
• Gross Domestic Product (GDP) growth rates
• Government budget
• Government debt
• Industrial and agricultural production indices
• Trade balance.
Socio-economic indicators:
• Unemployment rates, which considers labour force between the age of 15 and 64 years old
• Youth unemployment rates, which covers labour force between 15-24 years old.
Market indicators:
• Inflation rates, which represent percentage change in Consumer Price Index (CPI). This report
covers both total and food inflation rates; changes in prices of different food commodities are
calculated through WFP SNAP platform
• Exchange rates, which affect inflation rates and purchasing power of households. A depreciation in
the currency leads to higher import costs translated into higher inflation rates affecting mainly net
importing countries.
The economic indicators described in this report provide a snapshot of the economy of a country and,
eventually, of the wellbeing of its population. When the GDP growth rates decreases, unemployment rates,
budget deficit, government debt and inflation rates increase while trade deficit widens. All this affects the
wellbeing of the society, mainly the most vulnerable segments of the population.
July –December 2020 Page 3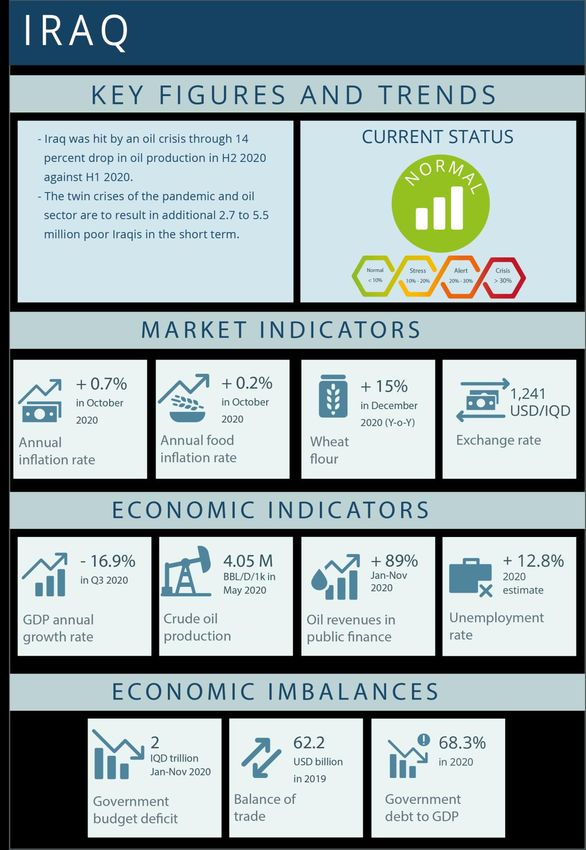
Regional Market Analysis – End 2020 Update
Annual inflation rates, December 2020
Annual food inflation rates, December 2020
Normal (< 10%) Stress (10% - 20%) Alert (20% - 30%) Crisis (> 30%)
Data sources: WFP, UNGIWG, GeoNames, GAUL, and OCHA.
The designations employed and the presentation of material in the map(s) do not imply the expression of any opinion on
the part of WFP concerning the legal or constitutional status of any country, territory, city or sea, or concerning the
delimitation of its frontiers or boundaries.
Notes on the data:
* All figures represent annual rates in December 2020 except for the following:
• Total and food inflation → Iraq (October 2020, latest available), Lebanon (November 2020, latest available).
**Libya, Syria and Yemen food inflation represent WFP monitored food basket.
***No (recent) data available on annual inflation rates for Libya, Syria and Yemen (grey shaded areas).
July –December 2020 Page 4
Regional Market Analysis – End 2020 Update July –December 2020 Page 5
Regional Market Analysis – End 2020 Update
Due to U.S. sanctions and fallouts of COVID-19 pandemic, Iran’s economy is undergoing a third consecutive
year of recession, with growth estimated to contract by 8.1 percent in 2020 1. Reduced expenditure is
expected to affect the non-oil private sector, while weaker foreign demand will further weigh on the oil
industry. Indeed, oil output remained a record low in November for the fifth month, while non-oil foreign
trade has contracted sharply since the outset of the pandemic.
Headline inflation slightly Figure 1: Inflation and exchange rate, Jan-Jun 2020
dropped in December 2020
(from 46.4 percent in 70 1.2
November to 44.8 percent); 60
58 1
however, it remained
50
elevated due to ongoing 0.8
45
supply chain disruptions and 40
the heavy depreciation of 0.6
%
30
the rial. The decline
0.4
observed is due slight 20
decrease in price of 0.2
10
transport (65.2 vs. 96.5
0 2 0
percent in November) and
Jul-20 Aug-20 Sep-20 Oct-20 Nov-20 Dec-20
communication (24.5 vs.
25.4 percent). Yet, inflation Annual inflation rates Annual food inflation rates
accelerated for other goods Monthly inflation Informal exchange rate
and services such as food
and non-alcoholic beverages Source: Statistical Center of Iran
(58.0 vs. 56.7 percent); housing and utilities (26.1 vs. 26.0 percent) and health and medical services (34.5 vs.
33.9 percent). On a monthly basis, consumer prices were up 2 percent in December, after a 5.2 percent
growth in November.
According to FocusEconomics’ forecasts, inflation in 2020 is projected to remain elevated; however, lower
than 2019 (27.6 percent vs. 36.2 percent)2 due to a high base effect and subdued economic activity. Headline
inflation for 20213 is estimated to fall at an average of 22.2 percent.
The decline in net exports observed in 2019/2020 (down 26.9) led to a deterioration of external balances,
with current account surplus representing 0.9 percent of GDP. In addition, imports also contracted following
rationing of foreign exchange reserves and U.S. sanctions. Due to COVID-19 and the authorities’ widening the
import ban list, non-oil trade contracted by 31 percent (y-o-y, nominal) between April and August.
Following the fall in oil revenue, fiscal deficit to GDP ratio deteriorated (from -1.6 in 2019 to -3.7 percent in
2020)4.
The worsening economic situation deteriorated participation and employment rates, with the number of
employed people falling from 24.3 million in 2019/2020 to 1.5 million in Q1 2020/2021. The unemployment
rate in 2019/20 and Q1 2020/21 fell to 10.7 percent and 9.8 percent, respectively5.
1
FocusEconomics’ forecasts
2
Solar Hijri calendar
3
Solar Hijri calendar
4
World Bank: Iran's Economic Update, October 2020
5
World Bank: Iran's Economic Update, October 2020
July –December 2020 Page 6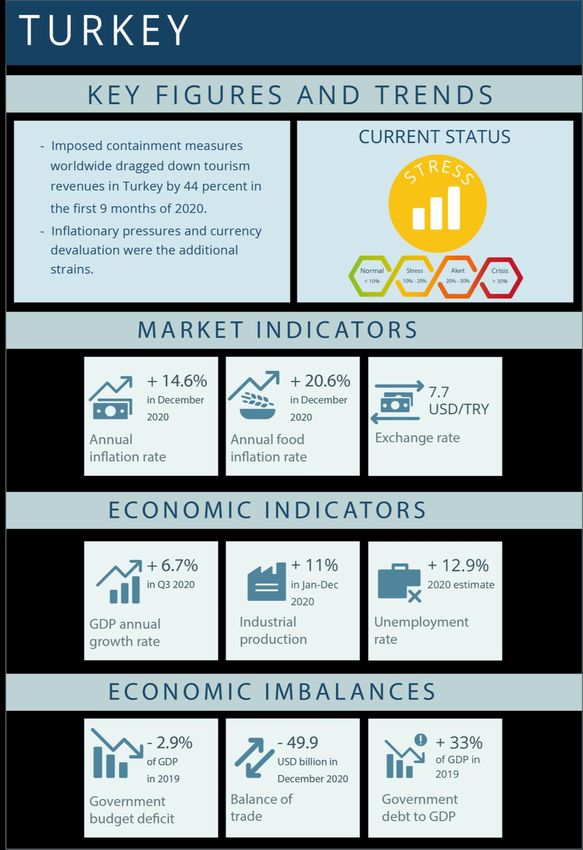
Regional Market Analysis – End 2020 Update July –December 2020 Page 7
Regional Market Analysis – End 2020 Update
Economic conditions remain bleak due to the compound effect of the currency crisis, COVID-19, socio-political
instability and the aftereffects of the Beirut port explosion in August. According to FocusEconomics’
estimates, GDP is seen to contract further in 2020 (down 25 percent) to then rebound in 2021 but still with
negative sign at -2.5 percent. Fiscal deficit and public debt are seen staying extremely elevated (-9.3 and 170.4
percent of GDP in 2020, respectively)6.
Throughout the second half of 2020, the average informal exchange rate remained stable at around USD/LBP
8,000 – accounting for double the rate applied by banks for withdrawals in LBP from dollar denominated
accounts (LBP3,900/USD). Nevertheless, the exchange rate plummeted due political developments. For
instance, at the end of September the rate nearly reached USD/LBP 9,000, following the resignation of the
designated Prime Minister; in mid-October, it dropped to USD/LBP 6,500 in the aftermath of the nomination
of a new Prime Minister and the introduction of limits on LBP cash withdrawals.
Similar to the trends observed in Figure 2: Inflation and exchange rates, Jul-Dec 2020
the informal exchange rate, the 500 10,000
price of the basic food basket7 was 402
stable between July and December; 400 8,000
8,286
however more than double
300 6,000
USD/LBP
expensive compared to the same
%
period last year. By the same 200 4,000
token, inflation rates remained 146
100 2,000
excruciatingly high; with annual 1,508
inflation peaking 145.8 percent in 0 0
December, from 133.4 percent in Jul-20 Aug-20 Sep-20 Oct-20 Nov-20 Dec-20
November. Food and non-food
Annual inflation rates Annual food inflation rates
prices are extremely high as a Official exchange rate Informal exchange rate
result of the sharp depreciation ofSources: CAS, Lirarate.com and FXtop
the Lebanese pound amid a deep political, economic and financial crisis affecting the country since late 2019.
Annual food inflation jumped 402.3 percent and additional upward pressure came, among others, from
restaurants and hotels (609 percent y-o-y); furnishings, household equipment and routine maintenance
(655.1 percent), clothing and footwear (559.8 percent). Considering the full year 2020, the inflation rate
averaged 84.9 percent – that is the highest rate recorded since 20138. Inflation is seen to remain extremely
elevated in 2021 (at an average of 49.9 percent) as the volatile parallel market exchange rate and the possible
removal of subsidies on basic items and posing an upside risk9.
The Central Bank announced in late 2020 that it could not keep the current subsidy mechanism and that it
will be halted once the minimum reserve requirements threshold is reached. As official foreign reserves were
estimated to stand at nearly USD 17.9 billion at the end of November 2020 – implying only USD 800 million
available for the subsidization of wheat, fuel and pharmaceutical products at the official rate and
subsidisation of the basket of food items at the banks’ exchange rate (USD/LBP 3,900) – discussions about
possible modifications to the subsidies system are ongoing and are expected to be implemented at the
beginning of 202110.
6
FocusEconomics’ forecasts
7
The SMEB food basket is based on a monthly ration per person of 6 kg of rice, 3.9 kg of bulgur, 1.5 kg of pasta, 1.5 kg of
white beans, 1.5 kg of sugar, 0.9 litres of sunflower oil, 0.3 kg of salt and 1.2 kg of canned meat
8
Central Administration of Statistics
9
FocusEconomics’ forecasts
10
WFP Lebanon: VAM Update on Food Price and Market Trends, December 2020
July –December 2020 Page 8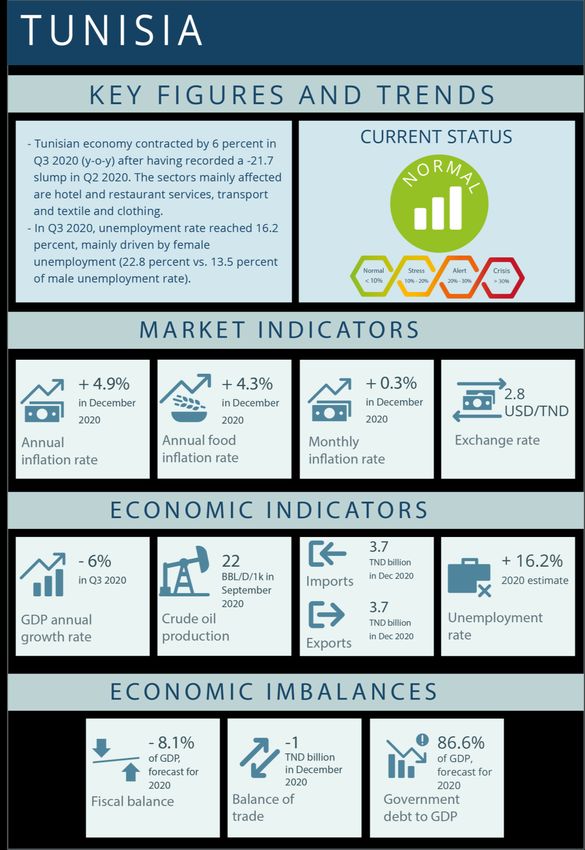
Regional Market Analysis – End 2020 Update July –December 2020 Page 9
Regional Market Analysis – End 2020 Update
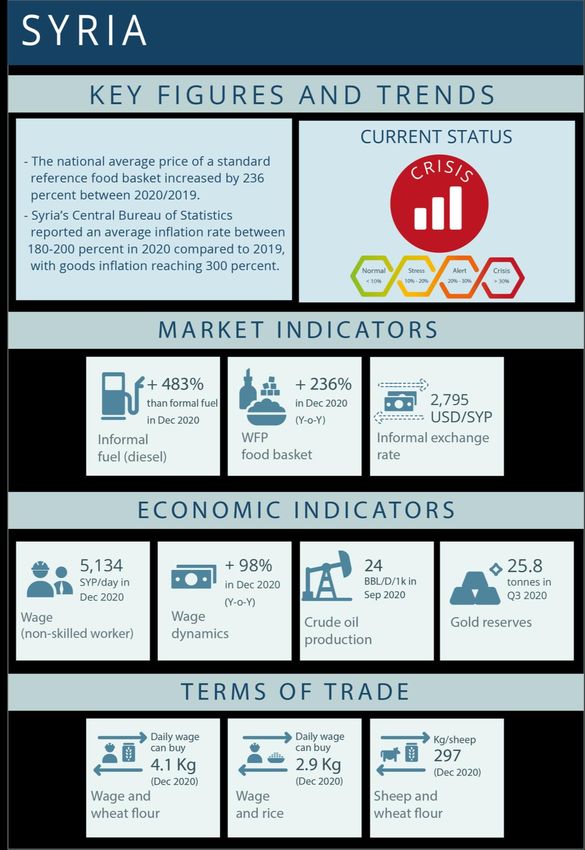
In H2 2020, the price of WFP’s national reference Table 1: Average and variation cost of the food basket,
food basket11 averaged SYP 92,214. Despite the high Jul-Dec 2020
cost, the price of the food basket remained stable Governorate Jul-Dec average Jul-Dec variation
Aleppo 90,459 56%
between July and October 2020, but then increased
Damascus 87,835 28%
towards the end of the year. At the governorate
Dar'a 91,076 26%
level, Aleppo recorded the highest 6-month increase
Deir-ez-Zor 81,409 32%
(up 56 percent), followed by Tartous (up 38 percent) Hama 88,755 36%
and Homs (up 37 percent). In terms of actual costs, Al-Hasakeh 86,921 23%
Idleb recorded the most expensive food basket Homs 88,825 37%
throughout H2 2020 (32 percent higher than the Idleb 121,805 13%
national average); while Deir-ez-Zor recorded the Lattakia 97,072 29%
least expensive food basket (12 percent lower than Ar-Raqqa 88,184 29%
the national average). Rural Damascus 90,872 18%
As-Sweida 90,094 27%
After having stabilized between July and October,
Tartous 96,392 38%
prices of all components of the food basket
Quneitra 91,289 25%
recorded an increase towards the end of the year,
National average 92,214 29%
which can be attributed to the lack of fuel and
Source: WFP field monitoring
worsening of the informal exchange rate.
Throughout H2 2020, the Syrian pound depreciated in the informal exchange rate market from SYP
2,262/USD in July to SYP 2,795/USD in December, while the official exchange rate remained stable throughout
the year at SYP 1,250/USD. The gap between the official and the informal exchange rates has more than
doubled towards the end of the year.
Similarly, the price of fuel in the Figure 3: Price of fuel and exchange rate, Jul-Dec 2020
informal market has recorded a
significant increase during the
second half of 2020, especially after
October. The informal national
average price of transport diesel
reached SYP 1,015/litre in
December 2020– that is almost
more than five times higher than
the formal price of diesel (SYP
174/litre). Following the decrease
of subsidized heating diesel
allocation and the increase in
demand during the winter season,
the informal national average price
of heating diesel has also increased
(up 20 percent between November
and December 2020, reaching SYP Source: WFP field monitoring
1,050/litre). The increased demand for heating during winter combined with the continued lack of availability
of formal butane cylinders resulted in a sharp increase in the price of butane gas cylinders, reaching SYP
19,014/refill in December – that is almost 6 times higher than the formal butane price (SYP 2,785/refill).
11
WFP’s national average reference food basket, a group of basic dry goods providing 2,060 kcal a day for a family of five during a month.
The basket includes 37 kg of bread, 19 kg of rice, 19 kg of lentils, 5 kg of sugar, and 7 litres of vegetable oil.
July –December 2020 Page 10Regional Market Analysis – End 2020 Update July –December 2020 Page 11
Regional Market Analysis – End 2020 Update
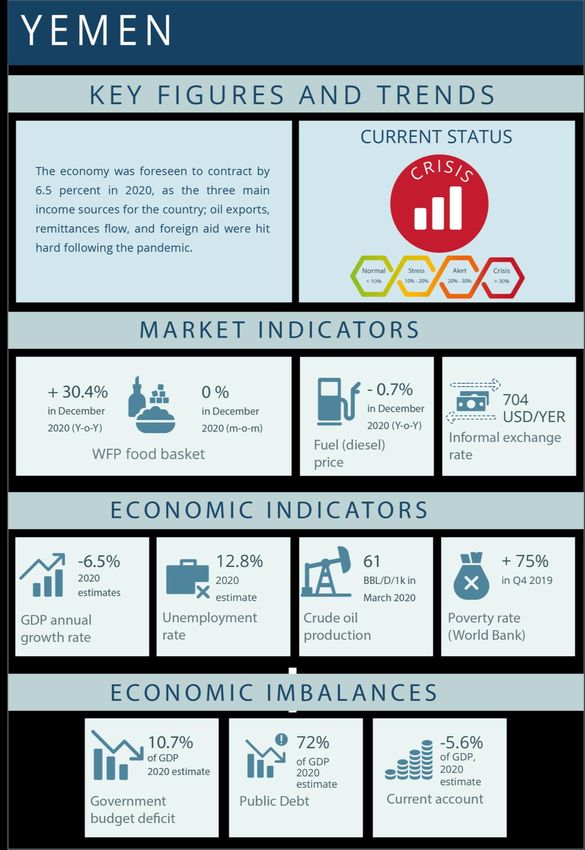
The year of 2020 was particularly though for Yemen as the country went through a series of compounding
crises, namely the ongoing protracted conflict, global drop in oil prices, the pandemic and associated
containment measures, and the downsize in humanitarian assistance.
At the macrolevel, the economy was estimated to contract by 6.5 percent in 2020. Government imbalances
persisted as budget deficit widened (accounting for 10.7 percent of GDP), cumulative government debt
reached 72.3 percent of GDP and current account recorded a deficit (representing 5.6 percent of GDP)12.
The economy relies on three main income sources: oil exports, remittances and foreign aid. Oil revenues
dropped, following the global decline in demand and prices throughout 2020.
In terms of remittances (accounting for 13 percent of GDP in 2019, that is USD 3.8 billion), one in ten Yemenis
heavily relies on inflows that are mainly sourced from GCC countries, which have also been affected by the
sharp decline in oil prices, production cuts and stringent measures to contain COVID-1913. Data collected by
the Cash Consortium of Yemen (CCY) in November 2020 indicates that the inflow to Yemen has significantly
dropped as 65 percent of surveyed exchange shops reported remittances did not return to pre-COVID level14.
Foreign aid witnessed a huge drop (from USD 4.1 billion in 2019 down to USD 1.9 billion in 2020).
Furthermore, the USD 2.2. billion Saudi cash deposit – which helps importers to buy staple commodities at
subsidized exchange rates, has almost exhausted. A new cash deposit for foreign aid is crucial for the central
bank to secure funds for imports of basic food commodities15.
Currency volatility added further Figure 4: Cost of the food basket and informal exchange rate, 2020
strains to the fragile economy: the 720
6,000
parallel exchange rate passed from
USD/YER 606 in January to USD/YER 704 4,500 660
USD/YER
YER
in December 2020 (14 percent 3,000
devaluation in Yemeni Rial). The 600
1,500
depreciation was reflected in food
prices as the cost of food basket - 540
Nov
Jan
Jun
Oct
Feb
Jul
Apr
Aug
Dec
Sep
H1
H2
Mar
May
recorded a 28 percent increase from
January to December 2020. The upward Food Basket Informal exchange rate
trend is mainly driven by the relatively
higher cost of food basket commodities Source: WFP field monitoring
in areas under the control of Internationally Recognized Government (IRG) – up 48 percent in December
compared to January, against a 10 percent average in areas under Sanaa’ based authorities.
Fuel shortages – and the related price increase – also affected the country, especially the second half of the
year. Diesel and petrol gasoline prices were 20 and 28 percent higher in H2 2020 against H1 2020 due to the
decrease in foreign exchange reserves, which, in turn, affected the IRG’s ability to pay international energy
suppliers.
The novel outbreak along with the above-mentioned economic pressures were translated into nearly one
third of surveyed households reporting challenges to accessing the market. Lack of money followed by the
disease outbreak were the top two reasons behind lack of market accessibility16.
12
Forecasts are based on RBC VAM in collaboration with Focus Economics
13
Oxfam: Remittances to Yemen plummet as needs surge amid war and coronavirus, June 2020
14
OCHA Yemen: Rial reaches all-time low in southern governorates, compounding threats to food security, before
rallying by the year-end, 13th January 2021
15
OCHA Yemen: Rial reaches all-time low in southern governorates, compounding threats to food security, before
rallying by the year-end, 13th January 2021
16
mVAM data collected by WFP.
July –December 2020 Page 12Regional Market Analysis – End 2020 Update July –December 2020 Page 13
Regional Market Analysis – End 2020 Update
In 2020, cumulative COVID-19 cases in Turkey reached 2.2 million – that is the highest number in the region
(43 percent of total cases). Containment measures imposed worldwide dragged down tourism revenues in
the first 9 months of 2020 to USD 4.1 billion, which accounts for a 44 percent drop against the corresponding
period of 201917. Despite this, tourism revenues in Q3 (that is the period in which most tourism revenues are
captured) accounted for 71 percent of total tourism revenues, implying that the sector has played a key role
in 2020. Nevertheless, revenues in Q3 2020 were lower than Q3 2019 by 19.2 percent.
Expansionary policies to stimulate Figure 5: Inflation and exchange rate, 2020
economic growth through policy rate
22 9
cuts; administrative and regulatory
measures to boost credit coupled 21 8
18
with cheap and rapid lending growth 8
by state-owned banks resulted into 7
USD/TRY
14
inflationary pressures and currency 15
%
6
devaluation, which, in turn, put
additional strain on the economy. 18 10
5
As of December 2020, annual
6 4
inflation rate recorded 14.6 percent,
Nov-20
Apr-20
Oct-20
Mar-20
Jun-20
Jul-20
Jan-20
Aug-20
Dec-20
Feb-20
Sep-20
the highest rate since August 2019, May-20
whilst the Turkish Lira depreciated to
Annual inflation Annual food inflation
7.7 USD/TRY against 5.9 in January
Exchange rate
2020. Facing the depreciation, the
Source: Turkish Statistical Institute and FXtop
Turkish government decided to
increase lending rates to 18.5 percent in December 2020 (5.75 percentage points up compared to January
2020). Food prices were more severely affected as annual food inflation soared to 20.6 percent in December
2020. The cost of food basket saw similar fluctuations with an annual increase of 23 percent.
Unemployment rate reached 12.7 percent in October 202019; the situation was even more alarming for the
young generations as youth unemployment rate reached 24.9 in the same reference period. In addition, the
rate of unregistered employment was as high as 19.9 percent20, whilst 31 percent of those who are employed
is not covered by any social security schema, posing concerns about vulnerable segments of the population
who are employed in the informal economy and often have no access social safety nets.
According to IMF forecasts, the economy is foreseen to grow by 5 percent in 2021, which could eventually
translate into more job opportunities and lower unemployment rates.
The socio-economic situation and the fallout of COVID-19 also affected Syrian refuges hosted in Turkey.
Suspension of face-to-face classes and the need to adjust to distance learning solutions forced Syrian
refugees to invest more on remote education related costs such as internet. According to the latest In-Camp
Post-Distribution Monitoring Report by WFP, the share of expenditure on food on total expenditure went
down from 75 percent in Q1 2020 to 68 percent in Q3 2020, with a shift of expenditure towards education –
possibly due to additional cost required for remote education (such as internet costs) – and savings –
probably due to the uncertainty of pandemic and macro-economic conditions.
17
Turkish Statistical Institute
18
IMF: Turkey: Staff Concluding Statement of the 2021 Article IV Mission, 25th January 2021
19
Turkish Statistical Insitute: Labour Force Statistics, October 2020, latest available
20
19.9 percent covers those who are in the non-agricultural sector
July –December 2020 Page 14Regional Market Analysis – End 2020 Update July –December 2020 Page 15
Regional Market Analysis – End 2020 Update
Industrial production kept on Figure 6: Yearly variation in production and price of Sahara Blend, 2019-2020
falling during Q2 2020 (down
14.1 percent compared to Q2 1,200 100
2019 and down 10.4 percent -46% -34% -45% -45% -44% -38%
compared to Q1 2020). The 1,000
80
decline has significantly affected
Quantity (thousands)
800
the energy sector (down 6.8 60
Price (USD)
percent y-o-y), mainly 600
hydrocarbons (down 8.5 40
400
percent) and mining industry
(down 3.6 percent). The decline 20
200
observed was mainly caused by
0 0
the implementation of
July Aug Sep Oct Nov Dec
measures to contain the 2019 Barrels/day 2020 Barrels/day 2019 Price 2020 Price
contagion across the world,
Source: OPEC
which reduced global demand
for oil and hydrocarbons, affecting revenues of economies that are heavily dependent on the energy sector.
Algeria recorded a significant decline in revenues from Sahara Blend (on average down by 42 percent in H2
2020 compared to H2 2019). All this, coupled with increased public expenditure for the implementation of
policies to mitigate the health and economic impact of COVID-19 on households21 has widened fiscal deficit
(from 9.6 percent of GDP in 2019 to 15.8 percent in 2020) and public debt (from 47 percent of GDP in 2019
to 68.2 percent of GDP in 2020).
Due to the above-mentioned Figure 7: Inflation and exchange rate, Jul-Dec 2020
reasons, prospects on growth 4 125
remain uncertain; however, the
3
latest estimates from World Bank 119
120
2
suggest a significant contraction 1
115
in growth as a result of COVID-19
USD/DZD
0
%
and uncertainties related to the
110
duration of the sanitary and
economic crises. GDP is seen to -2
105
contract by 6.5 percent to then
rebound to 3.8 percent in 202122. -4 100
Jul-20 Aug-20 Sep-20 Oct-20 Nov-20 Dec-20
After having strengthened against
Annual inflation Annual food inflation Exchange rate
the USD, the Algerian Dinar (DZA)
Source: Office National des Statistiques (ONS) and FXtop
has stabilized since April 2020,
which is reflected in inflation rates. In December 2020, headline inflation reached 2.8 percent (up from 2.4
percent in November 2020). Annual food inflation was negative between August and September, then
increased to 1.5 percent in December, mainly led by the increase of prices of fresh fish (up 24.4 percent
compared to 2019), fruit (up 9.2 percent) and oil and other fats (up 8.2 percent). Despite low inflation and
stable but high unemployment rates (11.4 percent in 2019 with higher rates for women at 20.4 percent23),
slowing growth is limiting the potential for job creation and poverty alleviation.
21
IMF – Policy Responses to COVID-19
22
World Bank: Macro Poverty Outlook - MENA, October 2020
23
ILO estimates
July –December 2020 Page 16Regional Market Analysis – End 2020 Update July –December 2020 Page 17
Regional Market Analysis – End 2020 Update
Due to the fallout from COVID-19 and a six-week conflict between Azerbaijan and ethnic Armenian forces
over the disputed enclave of Nagorno-Karabakh, the Armenian economy shrank 9.1 percent y-o-y in Q3
202024. Almost all sectors of the economy recorded declines; however, the services sector was the most
severely affected. The central bank has forecasted that the economy would contract 6.2 percent by the end
of 2020 and get back to 4-5 percent growth in 2021 following a recovery of external demand, rebound of
tourism industry and strengthened consumer and business confidence. Uncertainty over the path of the
health crisis and hostilities between Armenia and Azerbaijan remains.
The pandemic did not have a Figure 8: Inflation rates, Jul-Dec 2020
significant impact on general price
6
level in Armenia between January
and November 2020, reflecting 5
deflation in food and world oil
4
prices and lower aggregate 4
demand. According to WFP’s
%
Market Functionality and Supply 2
Chain; Resilience of Supply Chains
and Profitability of Production
survey, traders kept prices of 0
essential commodities – such as Jul-20 Aug-20 Sep-20 Oct-20 Nov-20 Dec-20
staple food – low, allowing
Annual food inflation rates Annual inflation rates
consumers – who witnessed a
deterioration in their disposable Source: National statistics office (Armstat)
income due to the fallout of COVID-19 – to pay in cash instead of buying on credit. In addition, Armenia’s food
market did not experience deficits in supply as traders prefer relying on smaller stocks and relating with many
suppliers, which, in turn, allows them to quickly adjust to changes in consumer demand.
Yet, December annual and food inflation surged to 3.7 and 4.9 respectively. December rate was the highest
annual rate recorded since March 2018, which has been mainly pushed up by prices of alcoholic beverages
and tobacco (10.4 percent); food & non-alcoholic beverages (4.9 percent); transport (4.7 percent) and
miscellaneous goods and services (5.5 percent). In terms of m-o-m variation, consumer prices in December
increased 3.4 percent compared to 1.3 percent of the previous month; which accounts for the highest m-o-
m rate observed since January of 2012.
In Q3 2020, Government Debt in Armenia reached an all-time high of 3,826 AMD billion, which was mainly
driven by the implementation of measures to face the pandemic. Indeed, public spending in the first seven
months of 2020 went up 19 percent y-o-y25, corresponding to an estimated cost of around 2.3 percent of
GDP. The observed increase in domestic and external borrowing widened the deficit, while pushing public
debt to approximately 60 percent of GDP.
Despite it narrowed down, current account deficit is remained elevated, reaching USD 70 M in Q3 2020. In
the same period, unemployment rate was as high as 18.1 percent; however, stable compared with 2019 rate
(17.9 percent)26.
24
National statistics office (Armstat)
25
World Bank: Macro-Poverty Outlook, October 2020
26
National statistics office (Armstat)
July –December 2020 Page 18Regional Market Analysis – End 2020 Update July –December 2020 Page 19
Regional Market Analysis – End 2020 Update
As of the 31st of December 2020, the total number of COVID-19 cases in Egypt reached 138,062, ranking the
country in the 63rd place in terms of global cumulative cases. The government of Egypt implemented some
measures to contain the second wave of contagion; however, they were limited to the mandatory use of face
masks in public spaces and the mandatory negative PCR test for passengers travelling to Egypt.
Following the pandemic, the overall economy slightly contracted by 1.7percent 27 28 in Q2 202029. Such
deceleration was mainly linked to a significant drop in tourism revenues (84.1 percent), manufacturing
industry (15.9 percent), and gas extractions (15.4 percent). Egypt is the fifth-largest recipient of remittances
in the world, accounting for USD 26.8 billion in 2019 and nearly 10 percent of GDP30. Remittances flow fell by
21 percent in Q2 2020 compared to Q1 2020 (that is USD 1.7 billion). In terms of y-o-y variation, remittances
received in Q2 2020 were 10 percent lower than the inflow in Q2 2019. In terms of external sector, trade
balance reached a deficit of USD 36.5 billion (accounting for 10.1 percent of GDP) in the fiscal year
2019/202031 and a deficit of USD 8.4 million in Q2 2020 (that is 2.3 percent of GDP). Despite trade deficits,
gross official reserves were relatively stable throughout the first 10 months of 2020 at an average level of
USD 39.7 billion, covering nearly 7.5 months of merchandize imports. Unemployment rate in 2020 stood at
10.1 percent, almost double the word rate32.
Price levels came to lessen the Figure 14: Food basket and exchange rate, 2020, Jan-Dec 2020
hardship of the pandemic. Annual
215 16
inflation rate stood at 4.5 percent in
H2 2020, slightly lower than rates of 16
H1 2020 and H2 2019 (5.6 percent 210
16
USD/EGP
and 5.8 percent, respectively).
Figure 14 shows the cost of the food
EGP
16
basket followed the evolution of the 205
pandemic, peaking in late spring 15
and decreasing in H2 2020. In line
200 15
with inflation, the cost of food
Nov-20
Apr-20
Jul-20
Oct-20
Mar-20
Jan-20
Jun-20
Aug-20
Dec-20
Feb-20
May-20
Sep-20
basket33 in H2 2020 stood at an
average of EGP 209 – lower than
averages of H1 2020 and H2 2019 by Food basket cost -LHS Exchange rate -RHS
2.1 and 2.4 percent, respectively. Source: FXtop,CAPMAS , WFP calculation
Price stability is a plus to the purchasing power of households, especially for the most vulnerable ones. Yet,
the latest report released by the World Bank34 estimates poverty to have increased following COVID-19. On
a basis per headcount of 3.20 USD, poverty rate in Egypt is estimated to have increased from 24.1 percent in
2019 to 30.5 percent in 2020, ranking Egypt at the second place in terms of highest global poverty rates,
following Iraq. At USD 5.50 per headcount, poverty rate is estimated at 73.8 percent (up from 68.9 percent of
projected pre-COVID-19 level) — the highest in the region.
27
Macroeconomic figures are obtained from CBE latest monthly market bulletin.
28
The growth rate of GDP at market prices (constant prices)
29
Latest available data at the time of conducting the analysis
30
OECD report, April 2020
31
Fiscal year starts in July of a typical year (e.g. 2019) and ends in June of the following year (e.g. 2020)
32
World Bank Indicators
33
The reference food basket includes 1.5 kg of lentils, 0.9 kg of frozen chicken, 1.5 liters of maize oil, 2 kg of pasta, 2.3 kg
of rice, 1.4 kg of sugar, 5 kg of wheat flour and 15 eggs.
34
Trading together: Reviving Middle East and North Africa Regional Integration in the Post-Covid Era & Ahram newpaper,
October 2020
July –December 2020 Page 20Regional Market Analysis – End 2020 Update July –December 2020 Page 21
Regional Market Analysis – End 2020 Update
Prior to the pandemic, Iraq was hit by an oil crisis Figure 9: Oil production and Basrah light prices (2019 vs. 2020)
followed by a decline in global demand and oil prices 5,000 80
towards early 2020, hitting the lowest record in April
4,000
60
2020. Consequently, OPEC signed a historic
3,000
agreement to cut oil production to nearly 10 million
USD/b
tb/d
40
barrels per day35, which resulted in a decrease in oil 2,000
production by 14 percent in H2 2020 compared to the 20
1,000
H1 2020. Oil prices increased by 15 percent passing
from USD 38.5/barrel in H1 2020 up to USD 44.4/barrel 0 0
Q1 Q2 Q3 Q4 H1- Avg H2-Avg
in H2 2020; yet, lower than the average of 2019. Being
Oil production 2019 Oil production 2020
heavily dependent on oil36, the country saw a sharp fall
Oil prices 2020 Oil prices 2019
in its government revenues (almost down 48 percent
Source: OPEC
in the first 11 months of 2020 compared to the
corresponding period in 201937); the budget deficit widened in the same reference period in 2020, reaching an
alarming record of IQD 2 trillion38.
The economy was further challenged by the pandemic, as GDP contracted by 16. 9 percent in Q3 2020 against Q3
2019. The contraction was not only limited to oil, but also affected the non-oil sector (i.e. services). The services
sector, indeed, was hit hard by the novel outbreak and related containment measures as GDP of non-oil sector
alone contracted by more than 9 percent in Q3 202039 y-o-y.
The pandemic has also threatened job stability as unemployment rate for 2020 was estimated at 12.8percent of the
labor force population40. A recent report by the world bank41 predicted the twin crises of the pandemic and oil
sector to increase poverty rates from 7 to 14 percentage points in the short term. This means that another 2.7 to
5.5 million Iraqis would become poor, in addition to the existing 6.9 million pre-crisis poor. Annual inflation rate
and annual food inflation rate was as low as 0.7 and 0.2 percent respectively in October 202042. According to WFP
field monitoring, prices of food basket commodities were relatively stable in the second half of the year against H1
2020, with a maximum increase of 7 percent for vegetable oil. In terms of annual change, food basket commodities
witnessed a more significant increase for lentils (13 percent) and rice (12 percent) in H2 2020/H2 2019.
On 19th December, the Central Bank of Iraq
adjusted the sale price of dollars Table 1: Price and variation of food basket commodities, 2020
to Iraqi banks and currency exchange rate Variation
Unit Avg Variation
from 1,180 IQD/USD 1,460 IQD/USD – Commodity H2 2020/H1
H2 2020 H2/H1 2020
2019
which represents a nearly 19
Lentils Kg 1,631 5% 13%
percent devaluation in Iraqi Dinar. This led
Rice Kg 1,647 1% 12%
to significant m-o-m increase in
Sugar Kg 985 2% 6%
commodities prices (e.g. up 20 percent for
vegetable oil; up 12 percent for wheat flour; Vegetable oil L 1,482 7% 6%
up 7 percent for rice and up 5 percent for Wheat flour Kg 851 0% -4%
sugar). Source: WFP Field Monitoring
35
OPEC and allies agree to cut oil production to nearly 10 million barrels a day, April 2020, DW
36
Oil revenues represented 89 percent of total revenues in the first 11 months of 2020
37
Latest available at the time of conducting the analysis
38
Ministry of finance reports
39
Central Statistical Organization
40
World bank
41
Protecting Vulnerable Iraqis in the Time of a Pandemic, the Case for Urgent Stimulus and Economic Reforms, World
Bank, Fall 2020
42
Central Statistical Organization
July –December 2020 Page 22Regional Market Analysis – End 2020 Update July –December 2020 Page 23
Regional Market Analysis – End 2020 Update
The pandemic hit hard the economy through a significant drop in tourism revenues and a slowdown in retail
sector activities.
Tourism plays a significant role in the economy representing more than 41 percent of total exports43. Receipts
from this sector declined to USD 1.2 billion, accounting for an alarming fall by 72 percent in the first 9 months
of 2020 against the corresponding period of 2019)44. Accordingly, the third quarter of 2020 experienced
economic slowdown at a GDP rate of -2.2 percent, mainly linked to hotel and restaurants sector (down by 9.1
percent), followed by trade, transport, and communications sector (-6.3 percent)45.
Economic pressures entailed also deterioration in government imbalances. Budget deficit increased by 68
percent in the first 7 months of 2020 against the same period in 2019. This is mainly related to drop in total
revenues (down 14 percent)46. Public debt was foreseen at 108.4 percent of GDP in 2020 and to keep
increasing in 2021 (at 112.4 percent)47. In Q3 2020, current account balance recorded a deficit of USD 743
million against a surplus of USD 88 million in Q3 2019. Throughout the first three quarters of 2020, current
account deficit reached -2.4 billion USD, accounting for an 88 percent increase that was mainly due to a
deterioration in services sector (i.e. tourism).
Purchasing power of households, especially the vulnerable, is stretched following a decline in remittance
inflows and high unemployment. In the first three quarters of 2020, remittances decreased by 10 percent y-
o-y passing from to USD 2.5 billion in 2019 to USD 2.2 billion in 2020. Unemployment rate makes nearly one
fourth of the labour force population (23.9 percent in Q3 2020)48, and recorded an annual average of 14.6
percent49. Figure 10: Cost of the food basket, H2 2020
Prices remained stable thanks to
fixed exchange rate and limited
disruptions in food supplies. In
December 2020, annual inflation
rate decreased by 0.4 percent.
In terms of food prices, the cost of
food basket was stable in H2 2020
against H1 2020 (down by -2
percent). At the governorate level,
Karak kept recording the most
expensive food basket value
through the whole H2 2020. The
cost was higher than the national
Source: Department of Statistics (DoS)
average by 13 percent50. Declined
agricultural production and livestock supply amid the pandemic are the main reasons explaining the higher
cost51. On the contrary, Mafraq recorded the least expensive food basket in most months of H2 2020, lower
than the national average by 6 percent.
43
World development indicators, World Bank
44
Central Bank of Jordan
45
Q3 2020 against Q3 2019. Source: Jordan Department of Statistics
46
Source: Jordan Department of Statistics
47
RBC analysis and FocusEconomics
48
Source: Jordan Department of Statistics
49 World Bank based on International Labour Organization, (modelled estimate). Data retrieved in September 20, 2020
50
WFP field monitoring
51
Al Ghad, April 2020
July –December 2020 Page 24Regional Market Analysis – End 2020 Update July –December 2020 Page 25
Regional Market Analysis – End 2020 Update
Intensified conflict, suspension of oil fields, Figure 11: Oil production and prices, 2020
decreased oil prices and eventually the
1000 60
pandemic have all hit hard the country.
800
Being heavily dependent on oil revenues, the 45
USD/barrel
600
economy suffered the most from oil blockades
tb/d
30
and the decrease in global oil prices and 400
15
demand. The oil blockade resulted into a 200
significant drop in oil production, which fell by 0 0
66 percent in 2020 against 2019 (passing from Q1 2020 Q2 2020 Q3 2020 Q4 2020 Yearly
1.1 million barrels/day to 0.4 million average
barrels/day). Similarly, oil prices went down by Oil production (tb/d) Oil prices (USD/barrel)
37 percent from an average of USD 64 to USD Source: OPEC
40 per barrel52. As shown in the above figure, Q2 was the worst in terms of production and prices; however,
Q4 recorded significant improvements thanks to the political agreement to end the blockade on oil terminals
and the ceasefire.
According to the World Bank’s latest estimates, the contraction in oil sector decelerated economic growth by
41 percent in 2020 following a significant drop in government revenues. In addition, fiscal deficit is seen to
have widened (representing 59 percent of GDP in 202053), while government debt is foreseen to be as high
as 155 percent of GDP.
The repercussions of the intensified conflict were not limited to the oil sector, as disagreements within the
Central Bank board lead to different exchange rates in the country and a monetary crisis imposing strict
limitations on withdrawals. Fortunately, towards the end of 2020, the Central Bank board decided for a
devaluation and standardization of the exchange rate across the country for 4.48 LYD/ USD to be effective
since 3rd January 202154. This decision is Figure 12: Cost of the food basket and exchange rate, 2020
expected to have positive spill overs (e.g. 680 8
closing the gap between official and
parallel rates and controlling currency 640 6
USD/LYD
arbitrage) as well as negative
600 4
LYD
consequences (e.g. higher import costs).
The cost of the food basket was relatively 560 2
stable throughout 2020, except for April,
520 0
recording the highest m-o-m increase
Aug
Jan
Feb
Jul
Nov
Dec
Jun
Sep
Oct
Mar
Apr
May
(up 8 percent) due to the fallouts of
COVID-19 and the increase in food prices Food basket Informal Exchange Rate
during Ramadan. The food basket was Source: SNAP, FXtop
less expensive in H2 2020 than in H1 2020 (2 percent lower).
Households’ purchasing power is further threatened by high unemployment rate, accounting for nearly one
fifth of the labour force population (18.6 percent in 202055). The socio-economic crisis in Libya is more linked
to political instability than the pandemic. If the ceasefire agreement holds, the economy is anticipated to grow
by 76 percent in 202156 despite the fallouts of COVID-19.
52
OPEC monthly reports
53
World bank: Libya’s economic update, October 2020, link
54
Reuters: Libya's divided central bank agrees exchange rate after first meeting in years, December 2020, 0
55
World Bank
56
IMF WEO, October 2020. The significant growth would be related to the low base of 2020.
July –December 2020 Page 26Regional Market Analysis – End 2020 Update July –December 2020 Page 27
Regional Market Analysis – End 2020 Update
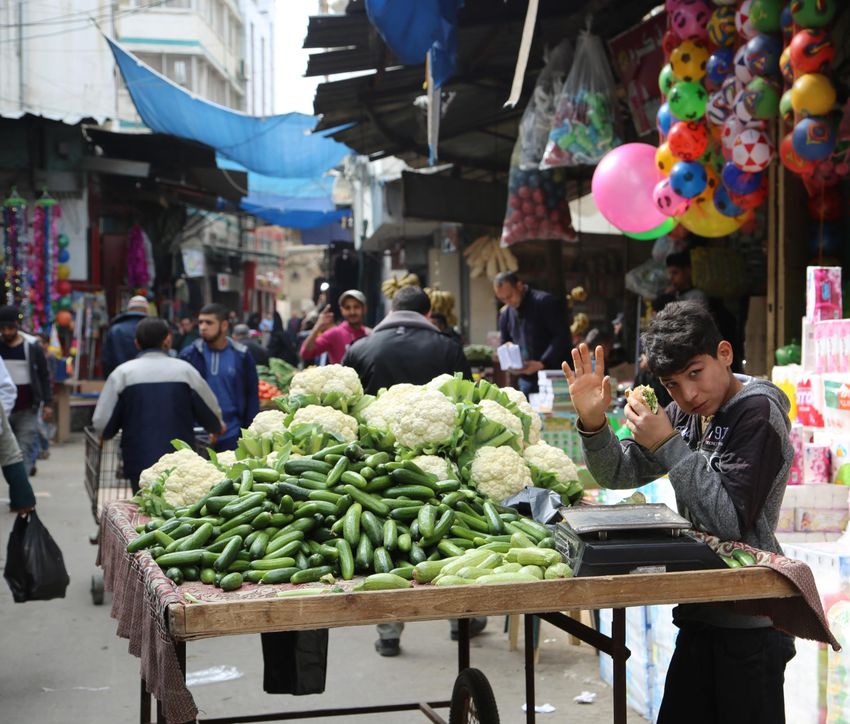
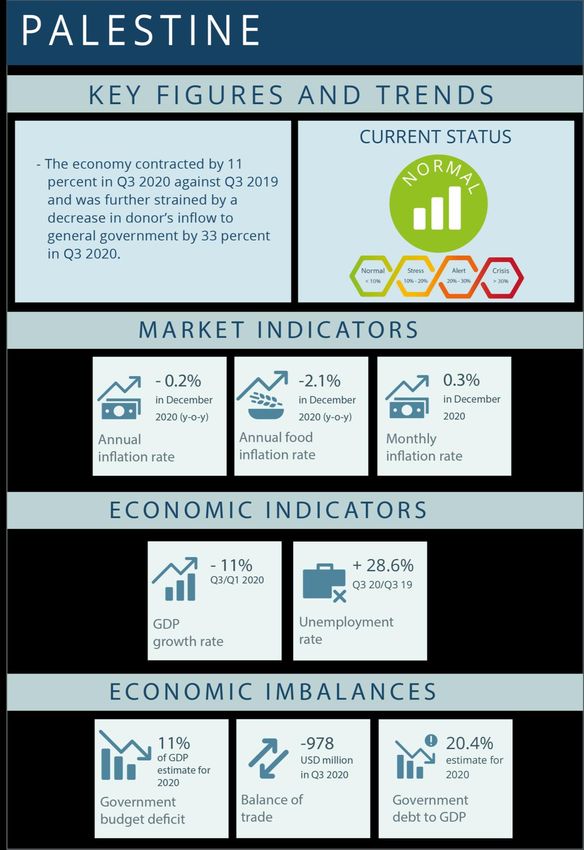
The socio-economic impact of the pandemic was severe in Palestine. The economy contracted by 11 percent
in Q3 2020 against Q3 2019 and was further strained by a decrease in income transfer inflows from donors
to the government by 33 percent in Q3 202057. This has significantly affected the country, which is highly
dependent on grants and aids (approximately 12 percent of total revenues in 2019 – latest available).
According to latest IMF forecasts, government budget was foreseen to record a deficit of 11 percent in 202058.
Despite the difficulties, trade deficit shrank by 19 percent in Q3 2020 against Q3 2019 (passing from USD -1.2
billion to USD -1 billion). Accordingly, current account deficit narrowed by 43 percent, recording a deficit of
USD 0.2 billion in Q3 2020. Lockdown and containment measures implemented to curb the contagion led to
significant drops in employees’ compensations (down 22 percent in Q3 2020/Q3 2019). This was mainly linked
to disruption in commuting of Palestinian workers to Israel – whose revenue accounts for a major source of
income for the Palestinian economy59.
Unemployment rate reached 28.5 percent in Q3 2020 (up from 24.6 percent in Q3 2019), with significant
discrepancies between the West Bank (18.7 percent) and Gaza strip (48.6 percent).
According to a recent survey conducted by the Palestinian Central Bureau of Statistics to assess the socio-
economic impact of COVID-19, 42 percent of Palestinian households lost no less than half of their income
during the lockdown period (March-May), compared to February 202060. Consequently, 41 percent of
households reported their monthly expenditures on food to have declined during the lockdown. When asked
about the most desirable measures to tackle the fallouts of COVID-19, cash transfers and job creation
accounted for the top two policies indicated by households (29 and 21 percent, respectively), West Bank
prefer food assistance as a second priority.
A study on Social Impacts of the COVID-19 Pandemic in Palestine confirmed worsening food insecurity, with
more than one third of farmers, sheepherders, fishermen and small traders facing a shortage/poor food
consumption rates, and more borrowing than before to buy food. A quarter of them also reduced the number
of family meals taken, as a result of the pandemic, and purchased “cheap” or “cheaper” meals than they
normally buy.
Prices came to lessen hardships on households, as annual inflation rate remain stable, at a yearly average of
-0.73 percent. The cost of the food basket61 was also stable in H2 2020 against H2 2019 and H1 2020. Highest
annual increases (H2 2020/H2 2019) were observed for certain commodities such as onions (up 18 percent),
cauliflower (up 11 percent), and eggs (up 9 percent).
Figure 13: Cost of the food basket, 2020
Differences between regions persist, when it comes
to price levels. West Bank records the most 60
44.5 44.5
expensive food basket, which, in turn, increases the 40.3 40.2
40 29.3 28.7
average cost of the food basket for State of
ILS
Palestine. In H2 2020, the cost of food basket in 20
West Bank was 55 percent higher than Gaza levels
(44.5 ILS vs. 28.7 ILS). Higher prices in West Bank 0
could be linked to a more advanced infrastructure H1 2020 H2 2020
West Bank Gaza State of Palestine
and living patterns in this region, compared to Gaza.
Source: Palestinian Central Bureau of Statistics
57
Income transfer inflows from donors captured 67 percent of total inflows to the government in Q3 2020.
58
IMF WEO database, link
59
Macroeconomic data is retrieved from Palestinian Central Bureau of statistics.
60
The survey covered the period between March-May, however the analysis was released in October 2020
61
The reference food basket includes bread (9kg), lentils (0.3 kg), salt (0.15 kg), chickpeas (0.45 kg), and maize oil (0.45 l)
July –December 2020 Page 28Regional Market Analysis – End 2020 Update July –December 2020 Page 29
Regional Market Analysis – End 2020 Update
Due to the fallout of the pandemic, Tunisian economy contracted by 6 percent in Q3 2020 (y-o-y) after having
recorded a -21.7 slump in Q2 2020. The sectors mainly affected are hotel and restaurant services (-42.7
percent), transport (-29.6 percent) and textile and clothing (-19.2 percent)62. Oil production also recorded a
significant decline, mainly in September at 22 BBL/D/1K – the lowest in 2020, representing a y-o-y decrease
by 31.2 percent).
In Q3 2020, unemployment rate reached 16.2 percent63, mainly driven by female unemployment (as high as
22.8 percent compared to 13.5 percent of male unemployment rate).
The flow of remittances in 2020 was stable (up 8 percent compared to 2019, corresponding to USD 1.6 B).
Since imports have fallen at a slower pace than exports, estimates for the current account are expected to
fall compared to 2019 level (8.8 percent of GDP), but remain high (7.1 percent of GDP). In contrast, the fiscal
deficit increased due to an 11 percent decline in revenues in mid-2020, reflecting the reduction in economic
activity and tax deferral measures64.
In terms of prices, annual inflation was stable during H2 2020, showing a slight declining trend between July
and December (from 5.7 to 4.9 percent). Annual food inflation recorded an upward trend in Q3 2020, passing
from 3.9 percent in August to 5.6 percent in October, following the second round of infections hitting the
country from September onwards and the related measures to contain the contagion. A similar trend was
observed between March and April –
Figure 14: Inflation, exchange rate and variation in prices of main
corresponding to the outbreak of
commodities, Jul-Dec 2020
the pandemic in Tunisia, the
consequent implementation of 60 6
curfews and lockdowns and related
50
changes in consumers’ behaviour 5
5%
such as panic buying – when food 40
4%
inflation increased from 3.6 in
4
February, reached 6.3 in March and 30 5%
USD/TND
peaked at 6.4 in April. 10%
20 3
No exchange rate fluctuations were
6% 3
%
observed in H2 2020., as the 10 5%
exchange rate was stable at an 2
4%
average of USD/TND 2.7. 0
1
According to the World Bank, the -10
pandemic is resulting into an
increase in extreme poverty: by -20 0
Jul-20 Aug-20 Sep-20 Oct-20 Nov-20 Dec-20
using the poverty line of USD 5.5
PPP, the 16.6 percent Tunisians will Bread and cereals Meat
fall under extreme poverty. In Fish Milk, cheese, eggs
addition, the proportion of the Oil and fats Fruits
population “vulnerable” to fall into Vegetables Sugar
Annual inflation Annual food inflation
poverty is expected to increase in
Exchange rate
2020, by reaching 22 percent of the
total population. Source: Institute National de la Statistique (INS)
62
Institute Nationale des Statistiques – Quarterly National Accounts
63
Institute Nationale des Statistiques – Unemployment rate evolution by sex (%)
64
World Bank: Macro Poverty Outlook - MENA, October 2020
July –December 2020 Page 30Regional Market Analysis – End 2020 Update
Food inflation observed between March and April was mainly driven by increase in price of vegetables, meat
and sugar (all peaking in October 2020 at 13.1, 7.6 and 6 percent, respectively).
For further information, please contact:
July –December 2020 Page 31
Siddharth Krishnaswamy Omneya Mansour Cinzia Monetta
Regional VAM Advisor Economics and Market Analyst Market and Food Security Analyst
siddharth.krishnaswamy@wfp.org omneya.mansour@wfp.org cinzia.monetta@wfp.orgYou can also read