Tacoma Power 2021-22 Revenue Requirement & Rate Proposals - Public Utility Board 26 August 2020
←
→
Page content transcription
If your browser does not render page correctly, please read the page content below
Tacoma Power 2021-22
Revenue Requirement
   & Rate Proposals
     Public Utility Board
       26 August 2020
Agenda
Overview Section 1 Pricing Proposals Section 3
Revenue Requirement Section 2 Next Steps Section 4
& LRFP Scenarios
2Section 1
Overview
32021-22 Pricing Proposals for PUB Discussion Already Introduced (May 27th PUB Meeting): Residential Prepayment rate Shore Power rate Distributed Generation (DG) rate Non-Firm rate New Large Load rate For Discussion Today: Open Access Transmission Tariff (OATT) update New business service fees update Rate component attribution of increase 4
Long-Range Financial Plan—Forecast Sensitivities
Scenarios:
• Second wave of pandemic shut-downs in 2021
• Loss of large load in 2021
• Critical water in 2021
                                     Standard
• Adverse water in 2021 and 2022     Planning
                                     Scenarios
• Economic rebound
• Low wholesale prices

5
Actual-to-Date Load Variances
Observed retail loads have declined under stay-at-home and phased-restart
orders, compared to the pre-COVID forecast.
2020 January February March April May June July
Weather-Normalized Actual
681.0 657.6 596.6 520.2 454.4 461.7 460.2
Load
October 2019 Forecast Load 679.3 643.3 607.5 549.8 482.3 479.8 486.4
Forecast Variance 0.25% 2.21% -1.80% -5.38% -5.79% -3.77% -3.07%*
*In the month of July, a contract industrial customer conducted their annual maintenance process, which
significantly impacted forecast variance. For this reason, forecast variance reported in that month excludes
contract industrial loads. When contract industrial loads are included, forecast variance increases to -
5.39%.
Tacoma Power continues to monitor the changing situation.
6Section 2
2021-22 Revenue Requirement &
Long-Range Financial Plan Scenarios
7Base Case Forecast: 2 percent Rate Increases
Proposed for 2021 & 2022
This forecast is subject to change, and is dependent upon actual financial performance in future years.
Light shading in future years represents uncertainty associated with revenues and expenses, mostly due to potential
for adverse* or critical water conditions, changes to sales projections, and future debt service.
6-7% 6-7%
5.9% 5.9%
5.8%
4.2% 4.2% 2-4% 2-4% 2-4% 2-4% 2-4% 2-4% 2-4% 2-4%
3.0%
2% 2%
0%
2012 2013 2014 2015 2016 2017 2018 2019 2020 2021 2022 2023 2024 2025 2026 2027 2028 2029 2030
Proposed Rate Increase
8LRFP Scenario Rate Forecasts
Projected Rate Increases
Scenario 2019 2020 2021 2022 2023 2024 2025 2026 2027 2028 2029 2030
Base Case:
Average Water 2.0% 2.0% 2.0% 2.0% 2.0% 2.0% 2.0% 2.0% 2.0% 2.0% 6.0% 6.0%
Conditions
Budget -
Adverse Water 2.0% 2.0% 2.0% 2.0% 2.0% 2.0% 2.0% 2.0% 2.0% 2.0% 6.8% 6.8%
in 2021 & 2022
Critical Water
2.0% 2.0% 2.0% 2.0% 6.0% 2.0% 2.0% 2.0% 2.0% 2.0% 4.5% 4.5%
in 2021
Loss of Large
2.0% 2.0% 2.0% 2.0% 2.0% 2.0% 2.0% 2.0% 3.0% 3.0% 7.0% 7.0%
Customer
Lower
Wholesale 2.0% 2.0% 2.0% 2.0% 5.0% 2.0% 2.0% 2.0% 3.0% 3.0% 4.0% 5.5%
Prices
Second Wave
Pandemic in 2.0% 2.0% 2.0% 2.0% 2.0% 2.0% 2.0% 2.0% 2.0% 3.8% 7.5% 7.5%
2021 & 2022
Preliminary
9Base Case Debt Service Coverage and Liquidity Metrics
Debt Service Coverage Ratio (DSCR) Days of Liquidity Projections
Adverse Water 2020 & 2021 Adverse Water 2020 & 2021
Target = 2.0x Target = 180 Days
4.0
300
3.5
3.0 250
2.5 200
2.0
150
1.5
100
1.0
50
0.5
0.0 0
2019 2020 2021 2022 2023 2024 2025 2026 2027 2028 2029 2030 2019 2020 2021 2022 2023 2024 2025 2026 2027 2028 2029 2030
6.8% rate increase in 2029 & 2030 2% rate increase in 2029 & 2030 2% rate increase Enhanced Aa Target Liquidity
6.8% rate increase
Aa Target DSCR (2.0x) in 2029 & 2030 in 2029 & 2030 Liquidity (180 Days)
10Manage Debt Profile to Minimize Long-Term Rates The Long View: Managing debt service has produced significant savings to date. Planned $150 million bond issuance in 2021. A bond call in 2023 and defeasance in 2025 are desirable to manage debt service and keep rates low. 11
Tacoma Power has AA-level credit ratings1
High ratings enable:
• access to financing (e.g. KeyBank agreement)
• lower interest rate on bonds
Electric Rate & Financial Policy:
• requires debt-service coverage ratios and days cash on hand
  consistent with current rating
• mandates low and consistent rate increases to minimize customer
  impact
• approved by TPU Board and City Council
Strategic Directive SD-2 on Financial Sustainability:
• Outcome 4: “AA-level bond rating, or better, to facilitate access to
  lower-cost financing and produce sustainable debt service expenses.”
• Outcome 7: “Financial management of debt service over the long
  term to maintain reasonable debt-service requirements and meet
  debt service coverage ratios.”

1 Fitch Ratings affirmed Tacoma Power’s AA- rating on August 14, 2020. The full report is included in the Board packet and
  available online.

12
Section 3

     2021-22 Pricing Proposals

13
2021-22 Pricing Proposals for PUB Discussion For Discussion Today: • Open Access Transmission Tariff (OATT) update • New business service fees update • Rate component attribution of increase 14
Update Open Access Transmission Tariff (OATT)
Tacoma Power has chosen to provide transmission service to third parties under a standard
rate, the Open-Access Transmission Tariff. This rate is based on the cost of providing
transmission service.
The OATT was last updated in 2012, using 2009 data. Since that time:
Costs have escalated.
Tacoma Power is accounting for use of more of the transmission system for itself.
Transmission customers are taking a new mix of services
Because the rate has not been updated in many years, some percent increases are high. On an
annualized basis, however, most changes are around 3%.
Some legal language changes may also be incorporated into the OATT at the same time the
rates are changed, to facilitate usage with the EIM.
15Preliminary Open-Access Transmission Tariff (OATT)
OATT Current %
Schedule Name 2019 Increase As %
Schedule (per MWh) Annual
Scheduling, System
1 $0.82 $1.06 $0.24 29% 2%
Control, and Dispatch Initial Revenue
Reactive Supply and Impact Estimate :
2 $0.08 $0.14 $0.06 75% 7%
Voltage Control
Regulation and $1.75 to $2 million
3 $0.34 $0.52 $0.18 53% 1%
Frequency Response additional annual
5 Spinning Reserve $14.45 $20.48 $6.03 42% 2% wheeling revenue to
Tacoma Power
6 Supplemental Reserve $14.45 $20.48 $6.03 42% 2%
7 Point-to-Point $2.99 $3.95 $0.96 32% 3%
Preliminary and subject to change.
16New Business Service Fees Update
Tacoma Power charges standardized fees for common new services work. These fees were last
updated in 2009. Costs have increased such that fee revenue no longer covers costs.
Fees do not reflect general cost escalation over 10+ years.
The Washington State Department of Labor and Industries changed electrical service
disconnect and reconnect rules in 2017. The new ruling exacerbated the total fixed-fee
under-recovery.
In the 2018/2019 period, under-recoveries averaged about $640,000.
Utilizing a sample of actual cost from SAP, staff audited and averaged actual costs for each
type of service work, then adjusted the results for anticipated cost changes, such as wage
increases that are already embedded in union contracts.
Fee under-recoveries increase costs to the general rate base.
17New Business Service Fees Update
Because the fees have not been
updated in many years, the full-cost
update increases range from 15% to
180%. However, they are still
competitive with peer utilities.
In order to prevent cross-subsidization
of fee work by the general ratebase,
Tacoma Power’s long-term goal should
be to raise fees to levels sufficient for
full cost recovery. Whether or not this
is done immediately or in a multi-
phase process is a policy decision.
18New Business Service Fees Update
Actual
Current
Fee Description Average Increase as %
Fee
Cost
A Connect New 200A Service to an Existing SSB $275 $530 $255 93%
B Install and Connect New 200A Service and SSB to an Existing Transformer $1,075 $3,010 $1,935 180%
C Connect New 320A, Single-Phase Service to an Existing Overhead Secondary $675 $1,385 $710 105%
D Connect New 200A, Three-Phase Service to an Existing Overhead Secondary $1,395 $1,630 $235 17%
E Connect 200A, Single-Phase Temporary Service to Existing Overhead $275 $410 $135 49%
F Install New 200A Service, SSB, Conduit, and Wire to an existing Power Pole $2,150 $3,875 $1,725 80%
G Install New 320A Service, SSB, Conduits, and Wire to an existing Power Pole $2,495 $3,960 $1,465 59%
H Install New 200A Service and Wire to Existing Power Pole in Customer Conduit $1,060 $2,895 $1,835 173%
I Connect Street Light Circuit to an OH or UG Secondary Service $185 $380 $195 105%
J Connect Unmetered Cable/DSL Service to OH or UG Secondary Service $185 $380 $195 105%
K Maintenance of Cable/DSL Service to OH or UG Secondary Service $185 $295 $110 59%
L Install Communications Conduits while Installing an SSB $140 $170 $30 21%
M Install a Rental Light Pole on Private Property $532 $610 $78 15%
OH = overhead, UG = underground
19Allocation of Rate Increase to Rate Components • No COSA was performed in preparation for this rate proceeding • All customer classes proposed to receive the same percent increase (2%) • The COSA prepared in 2018 suggested that there is some under-recovery for certain classes in fixed charges and demand charges • The same class revenue percent increase can be put into the fixed charge, the variable charges, or both 20
Options for Rate Components of Residential A. 100% to monthly charge Customer Charge: +$1.85 per month each step B. Same percentage to all rate components (2%) Customer charge: +35¢ per month each step kWh charge: +0.16¢ each step C. Half in monthly charge; half in variable charge Customer charge: +95¢ per month first step, +90¢ per month second step kWh charge: +0.10¢ first step, +0.11¢ second step D. 100% to kWh charge kWh charge: +0.20¢ each step 21
Options for Rate Components of Residential
                              Current     All Fixed                   All Fixed
                                                        Step One                    Step Two
                               Rates         2021                        2022
Energy + Delivery (per kWh)   8.0704 ¢     8.0704 ¢     0.0000 ¢ 0%    8.0704 ¢     0.0000 ¢ 0%
Fixed (per month)              $17.30       $19.15       $1.85   11%    $21.00       $1.85   10%
                              Current    Proportion                  Proportion
                               Rates         2021                        2022
Energy + Delivery (per kWh)   8.0704 ¢     8.2318 ¢     0.1614 ¢ 2%    8.3964 ¢     0.1646 ¢   2%
Fixed (per month)              $17.30       $17.65       $0.35   2%     $18.00       $0.35     2%
                              Current       50/50                       50/50
                               Rates         2021                        2022
Energy + Delivery (per kWh)   8.0704 ¢     8.1671 ¢     0.0967 ¢ 1%    8.2725 ¢     0.1054 ¢   1%
Fixed (per month)              $17.30       $18.25       $0.95   5%     $19.15       $0.90     5%
                              Current    All Variable                All Variable
                               Rates         2021                        2022
Energy + Delivery (per kWh)   8.0704 ¢     8.2689 ¢     0.1985 ¢ 2%    8.4717 ¢     0.2028 ¢   2%
Fixed (per month)              $17.30       $17.30       $0.00   0%     $17.30       $0.00     0%

22
Residential Bills under Alternative Rate Designs
SMALL USER LARGE USER
Current 2021 2022 Current 2021 2022
270 kWh 2,000 kWh
Rates Rates Rates Rates Rates Rates
All Fixed $39.09 $40.94 $42.79 All Fixed $178.71 $180.56 $182.41
+$1.85 +$1.85 +$1.85 +$1.85
4.7% 4.5% 1.0% 1.0%
Proportional $39.09 $39.87 $40.67 Proportional $178.71 $182.28 $185.93
+$0.78 +$0.80 +$3.57 +$3.65
2.0% 2.0% 2.0% 2.0%
50/50 $39.09 $40.30 $41.49 50/50 $178.71 $181.59 $184.60
+$1.21 +$1.18 +$2.88 +$3.01
3.1% 2.9% 1.6% 1.7%
All Variable $39.09 $39.63 $40.17 All Variable $178.71 $182.68 $186.73
+$0.54 +$0.55 +$3.97 +$4.06
1.4% 1.4% 2.2% 2.2%
Average Bill is $92.23 under current rates, $94.09 under 2021 rates (all designs), and $95.93 under 2022 rates (all designs).
23Options for Rate Components of Small General
A. 100% to monthly charge
Customer charge: +$2.95 per month first step,+$3.00 per month second step
B. Same percentage to all rate components
Customer charge: +45¢ per month first step,+50¢ per month second step
kWh charge: +0.16¢ each step
C. Half in monthly charge; half in variable charge
Customer charge: +$1.50 per month each step
kWh charge: +0.09¢ first step,+0.10¢ second step
D. 100% to kWh charge
kWh charge: +0.19¢ each step
24Options for Rate Components of Small General
Current All Fixed All Fixed
Step One Step Two
Rates 2021 2022
Energy + Delivery (per kWh) 7.9823 ¢ 7.9823 ¢ 0.0000 ¢ 0% 7.9823 ¢ 0.0000 ¢ 0%
Fixed (per month) $23.50 $26.45 $2.95 13% $29.45 $3.00 11%
Current Proportional Proportional
Rates 2021 2022
Energy + Delivery (per kWh) 7.9823 ¢ 8.1432 ¢ 0.1609 ¢ 2% 8.3047 ¢ 0.1615 ¢ 2%
Fixed (per month) $23.50 $23.95 $0.45 2% $24.45 $0.50 2%
Current
50/50 2021 50/50 2022
Rates
Energy + Delivery (per kWh) 7.9823 ¢ 8.0759 ¢ 0.0936 ¢ 1% 8.1725 ¢ 0.0966 ¢ 1%
Fixed (per month) $23.50 $25.00 $1.50 6% $26.50 $1.50 6%
Current All Variable All Variable
Rates 2021 2022
Energy + Delivery (per kWh) 7.9823 ¢ 8.1721 ¢ 0.1898 ¢ 2% 8.3661 ¢ 0.1939 ¢ 2%
Fixed (per month) $23.50 $23.50 $0.00 0% $23.50 $0.00 0%
25Small General Bills under Alternative Rate Designs
SMALL USER LARGE USER
Current 2021 2022 Current 2021 2022
500 kWh 3,000 kWh
Rates Rates Rates Rates Rates Rates
All Fixed $63.41 $66.36 $69.36 All Fixed $262.97 $265.92 $268.92
+$2.95 +$3.00 +$2.95 +$3.00
4.7% 4.5% 1.1% 1.1%
Proportional $63.41 $64.67 $65.97 Proportional $262.97 $268.25 $273.59
+$1.25 +$1.31 +$5.28 +$5.35
2.0% 2.0% 2.0% 2.0%
50/50 $63.41 $65.38 $67.36 50/50 $262.97 $267.28 $271.67
+$1.97 +$1.98 +$4.31 +$4.40
3.1% 3.0% 1.6% 1.6%
All Variable $63.41 $64.36 $65.33 All Variable $262.97 $268.66 $274.48
+$0.95 +$0.97 +$5.69 +$5.82
1.5% 1.5% 2.2% 2.2%
Average Bill is $147.19 under current rates, $150.13 under 2021 rates (all designs), and $153.13 under 2022 rates (all designs).
26Alternatives for Large Commercial & Industrial
• Schedule G
‒ The monthly charge was brought to 2018 COSA level last biennium ($80.00)
‒ Recommend to keep the customer charge flat, or not raise it more than 2%
‒ Remainder of rate change in energy (per kWh) and delivery (per kW)
• Schedule HVG/CP
‒ Increase all rate elements proportionately
27Section 4
Next Steps
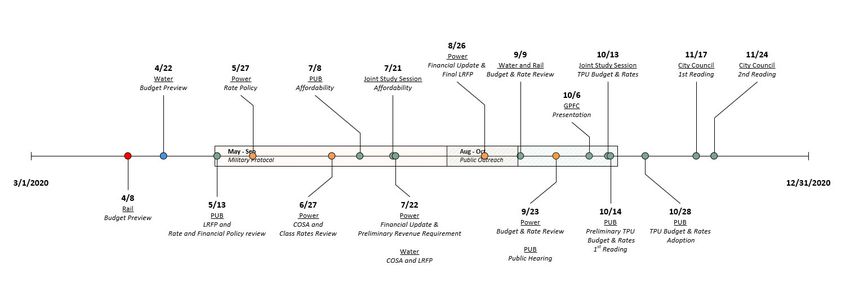
28Rates and Budget Timeline
We are here.
29Open Questions or Feedback from the PUB Introduced May 27th: Residential Prepayment rate Shore Power rate Distributed Generation (DG) rate Non-Firm rate New Large Load rate Discussed Today: Open Access Transmission Tariff (OATT) update New business service fees update Rate component attribution of increase 30
Public Finance
                                                                                                                                       Public Power
                                                                                                                                      United States

Tacoma, Washington
                                                                                                          Ratings
Electric System Revenue Bonds
                                                                                                          Outstanding Debt
                                                                                                          Electric System Revenue Refunding AA–
                                                                                                          Bonds
The rating reflects Tacoma Power’s typically very strong, but volatile financial performance,             Electric System Revenue Bonds     AA–
                                                                                                          Electric System Revenue Refunding AA–
revenue source characteristics, which include a component of variable wholesale revenue.                  Bonds (Taxable)
Given the utility’s reliance on hydroelectric power for the majority of its power supply, financial
performance fluctuates within a certain range with hydrological conditions.                               Rating Outlook
                                                                                                          Stable
Fitch Ratings’ analysis incorporates our expectation the electric system will experience weaker
margins and financial performance periodically. Performance was weaker in 2019, as water levels
reached some of the lowest levels on record, resulting in reduced energy production from
Tacoma Power’s resources, higher purchased power costs and lower wholesale revenue.
However, results for 2020 are expected to recover.
The Stable Outlook reflects average water conditions to date in 2020; an electric rate increase of
2% implemented on July 1, 2020, delayed three months for coronavirus considerations; and
the commencement of a lease of the telecom business. Fitch expects the financial profile will
recover to more typical levels in 2020.
The rating continues to reflect strong rate flexibility and Tacoma Power’s ongoing commitment to
annual rate increases. The city of Tacoma (AA/Stable) has the independent ability to set rates for
the electric utility and rate affordability is considered very high. Service area characteristics are
considered stable with moderate customer growth and unemployment levels that are declining
but still higher than the national level. The utility’s operating cost burden is very low, despite a
consistent 7.5% transfer to the general fund, which was established by voter approval.
Coronavirus Considerations
The coronavirus pandemic and related government containment measures create an uncertain
environment. Coronavirus-related effects to date at the utility are limited and do not indicate
credit impairment. The utility revised expectations in 2020 to reflect a retail load decline of
approximately 5% for the balance of the year and a three-month delay in the rate increase.
Retail revenue is expected to end the year lower than budget but the effects are projected to be
partially mitigated through higher wholesale revenue and management’s implementation of
mid-year expenditure cuts. For planning purposes, Tacoma Power is assuming load will remain
lower as a result of the pandemic through mid-2022.                                                       Applicable Criteria
                                                                                                          Public Sector, Revenue-Supported Entities
While credit effects are limited to date, material changes in revenue and cost profile are occurring      Rating Criteria (March 2020)
across the public power sector and may worsen in the coming months as economic activity suffers           U.S. Public Power Rating Criteria (March 2020)
and government restrictions are potentially maintained or expanded.
Our ratings are forward looking, and Fitch will monitor developments related to the severity and
duration of the virus outbreak, and incorporate revised expectations for future performance and           Related Research
assessment of the Key Rating Drivers.                                                                     Public Power – Fitch Analytical Comparative
                                                                                                          Tool (FACT) – 2020 (June 2020)
Key Rating Drivers                                                                                        U.S. Public Power: Peer Review (June 2020)
Revenue Defensibility: ‘a’; Midrange Service Area and Variable Wholesale Sales: The utility               Fitch Ratings Updates 2020 Sector Outlooks
derives a large majority of revenue from retail electric service that Fitch believes is monopolistic in   to Reflect Coronavirus Impact (March 2020)
terms of demand characteristics. The electric system serves a gradually growing,
non-concentrated, customer load located in and around the city of Tacoma. However, revenue
from competitive sources, including market sales of wholesale electricity, typically accounts for         Analysts
12%–13% of revenue and can be variable, limiting Fitch’s Revenue Defensibility Assessment.
                                                                                                          Kathy Masterson
Operating Risk: ‘aa’; Very Low Cost, Primarily Hydroelectric Power Supply: Power supply needs             +1 512 215-3730
                                                                                                          kathryn.masterson@fitchratings.com
are met through very low cost, primarily hydroelectric generation, resources that are both owned
and contracted. The contracted portion is largely supplied by Bonneville Power Administration             Parker Montgomery
(BPA), which provides approximately half of Tacoma Power’s needs under a long-term contract               +1 212 908-0356
that expires in 2028.                                                                                     parker.montgomery@fitchratings.com

Rating Report │ August 21, 2020                                                                                             fitchratings.com          1
Public Finance
Public Power
United States
Operating Cost Flexibility is considered ‘Weaker’ due to the concentration in a single fuel type,
hydroelectric generation, but the weakness does not constrain the Operating Risk Assessment. Bond Rating History
Rating Action Outlook Date
Ongoing capital investment is needed and is expected to be primarily debt financed.
AA– Affirmed Stable 8/14/20
Financial Profile: ‘aa’; Weaker Financial Performance in 2019: The Financial Profile is considered AA– Upgraded Stable 6/17/10
A+ Affirmed Stable 5/06/04
‘Very Strong’ based on historical performance. Weaker financial metrics in 2019 resulted from A+ Assigned — 5/24/94
unusually low water conditions. Our rating incorporates the expectation financial performance
will fluctuate based on hydrology. Recovery to historical levels is anticipated in 2020,
notwithstanding a degree of further financial pressure introduced by the coronavirus pandemic.
Overall, leverage, measured as net adjusted debt/adjusted funds available for debt service, is
expected to be below 7.0x at YE 2020.
Rating Sensitivities
Factors That Could, Individually or Collectively, Lead to Positive Rating Action/Upgrade:
• Positive rating action is unlikely in the current recessionary environment and in
Tacoma’s specific financial recovery situation following 2019.
Factors That Could, Individually or Collectively, Lead to Negative Rating Action/Downgrade:
• Failure of the system’s leverage ratio to fall below 7.0x in 2020, assuming average water
conditions.
• Rate action for the upcoming biennium budget, 2021 and 2022, does not support a return
to performance consistent with historical levels or the utility’s own financial policies.
Credit Profile
Tacoma Power is a unit of the city of Tacoma under the city’s Department of Public Utilities.
The power utility includes vertically integrated electric services to roughly 178,000 customers.
The electric utility serves approximately 180 square miles in the city and surrounding area of
Pierce County. In addition, Rainier Connect provides cable television and internet services on the
system leased from the utility. Tacoma Power’s financial statements present the electric and prior
telecommunications operations on a consolidated basis.
Revenue Defensibility
The large majority of Tacoma’s revenue is provided by energy sales to retail customers.
However, Fitch’s assessment of the utility’s revenue source characteristics also incorporates
Tacoma’s exposure to more competitive revenue from excess energy sales into the wholesale
power market. These nonfirm sales are subject to variability in hydrological conditions and market
prices. Wholesale revenue typically accounted for between 12% and 13% of total operating
revenue but declined to 8% in 2019, due to unusually low water conditions.
Operational Lease of Telecommunications Business
In addition to revenue from variable wholesale electric sales, revenue from Tacoma’s telecom
business previously accounted for another roughly 6% of operating revenue, which Fitch generally
considers more volatile to competitive revenue. However, Tacoma Power’s telecom business,
Click! Networks, did not generate sufficient revenue to cover its full operating and capital
expenses. The telecom business was, therefore, not considered a risk to revenue defensibility and
was instead considered in the operating cost burden and financial profile.
Tacoma began a process in 2018 to seek a public private partnership model for the telecom
business and reached a long-term lease agreement in 2019 with Rainier Connect, a third-party
telecom provider, to take over operations of the telecom utility. Tacoma continues to own the
telecom system but the operating agreement addresses litigation regarding Tacoma’s historical
expenditures on the telecomm business and is designed to eliminate the electric system subsidy.
Rainier Connect took over providing high-speed internet, cable television and phone service to all
existing customers on Tacoma’s Click! Network as of April 1, 2020. The effect in 2020 financials
will include a reduction in both telecom revenue and expenditure for nine months of the year and
reduced capex in the future. Rainer will be obligated to make an annual lease payment and invest
in necessary improvements in the system infrastructure to keep pace with industry standards and
competitive offerings in the region.
Tacoma, Washington
Rating Report │ August 21, 2020 fitchratings.com 2Public Finance
Public Power
United States
Service Area Characteristics
The utility’s service area exhibits stable demographic trends, while economic conditions are
hindered by an unemployment level that continues to trail the national level by a wide margin at
146% of the national average. Median household income for the city of Tacoma is roughly equal to
the national average, benefitting from access to the solid economic profile of the greater
Puget Sound region.
Customer growth is modest with average annual growth at just over 1% in the last five years,
although the utility projects a continued decline in overall energy sales as the growth driven from
economic development in the service area is not expected to outperform efficiency gains.
Residential customers account for approximately 40% of revenue and there is no customer
concentration in the largest electric customers.
Rate Flexibility
Tacoma Power is a division of the Tacoma Department of Public Utilities, which is governed by a
public utility board appointed by the mayor and confirmed by the city council. The board has
approval authority for most department business, although the biennial budget, rates, and bond
issues must also be approved by the city council. In practice, the board adopts the biennial budget
and rates for the two-year period concurrently. The next adoption will take place in fall 2020 for
the 2021–2022 biennial budget. Approved rates and charges are not subject to external
regulatory approval.
Tacoma’s retail electric rates are competitive at 95% of the state average, as of the most recent
U.S. Energy Information Administration data, and electric service is highly affordable at 1.9% of
the city’s median household income. While the declining trend of both retail loads and wholesale
electric revenue necessitated the current environment of rising retail electric rates, rate
competitiveness and affordability remain very strong.
Recent rate adjustments at 2% per year in 2019–2020 were lower than the 3.0%–5.9% rate
increases enacted in all but one year between 2011 and 2018. Tacoma delayed implementation of
the 2% rate increase in 2020 from the scheduled implementation date of April 1 to July 1, 2020,
due to the economic disruptions related to the coronavirus pandemic. Tacoma updates its long-
range financial plan each August, which includes projected rate increases for planning purposes.
The 2019 financial plan indicates continued base rate increases of 2% annually.
Operating Risk
Tacoma’s portfolio of largely hydroelectric resources, both owned and contracted, produces a
very low operating cost burden, which increased to approximately 8.0 cents per kWh in 2019
from around 6.0 cents in prior years. This reflects a 34% decline in wholesale MWh sales and
higher operating costs. Both events were prompted by one of the lowest hydrological years
on record and operating cost burden is expected to return closer to the historical average.
Operating costs will be lower in 2020 due to an $8 million mid-year reduction in expenditures and
introduction of the operating lease for the telecomm business, which will remove operating
expenses no longer incurred for the Click! Network.
Additionally, Tacoma Power pays a 7.5% gross earnings tax to the city’s general fund, which Fitch
includes in the electric cost burden metric. The gross earnings tax formula is fixed through 2025
by voter approval but the total transfer is also limited to 8% by state law.
Operating Cost Flexibility
As with most Pacific Northwest public power providers Fitch rates, the Operating Cost Flexibility
is assessed as ‘Weaker’ due to the concentration of the utility’s generating mix in a single fuel type:
hydroelectric generation. The reliance on hydroelectric power for nearly all of its power supply
creates the potential for future operating challenges or cost effects.
The utility’s power supply is projected to be sufficient to meet retail needs through 2037 under
“near-critical” water conditions, where critical water is 5th percentile, or the worst water year on
record in the last 80 years. Owned and contracted resources largely consist of low-cost,
well-established, Pacific Northwest hydropower resources.
Owned resources include five hydroelectric projects that account annually for just under half of
the system’s power supply needs. Positively, these owned resources offer flexibility in operations
in that the dams with significant reservoirs allow the utility to manage flow releases and maximize
the value of the resources.
Tacoma, Washington
Rating Report │ August 21, 2020 fitchratings.com 3Public Finance
Public Power
United States
The resources are geographically distributed allowing for some diversification benefits in terms of
watershed and water conditions. The system serves as its own balancing authority and owns and
operates 351 miles of transmission facilities to serve its retail loads.
BPA Contract
Just over half of Tacoma Power’s energy needs are purchased pursuant to a long-term contract
with BPA that expires on Sept. 30, 2028. The contract was amended in 2011 to include a slice
program in addition to the block program. The block product provides a guaranteed energy
amount with blocks varying month-to-month based on the seasonal variations existing in Tacoma
Power’s load. The slice product provides for Tacoma Power to receive a specific percentage
(2.97%) of BPA’s actual output, causing the utility to bear additional hydro-volatility risk
depending on water conditions. The slice portion annually accounts for the larger percentage of
the power Tacoma purchases from BPA.
Environmental Considerations
The State of Washington’s renewable portfolio standard (RPS) was approved by voter initiative in
2006 and requires utilities serving more than 25,000 customers to obtain 15% of their load from
renewable resources by 2020. Eligible resources include incremental hydro, wind, solar or
renewable energy credits (RECs). Large hydro, the majority of Tacoma Power’s generation
portfolio, is not eligible to meet the state’s RPS requirements. Instead, the system meets the
requirements through a combination of incremental hydro projects and the purchase of RECs.
Management estimates the utility will remain in compliance through 2025 with already secured
resources, including banked RECs.
Washington also passed the Clean Energy Transformation Act in 2019, which requires the state to
achieve a power supply free of carbon emissions by 2045. The utility is well positioned, given the
predominantly carbon-free power supply provided by hydroelectric reserves and its BPA contract
that includes hydroelectric and nuclear energy.
Capital Planning and Management
Tacoma Power’s capital planning and management assessment reflects the utility’s high lifecycle
investment needs and increasing age of plant, calculated by Fitch at 23 years. The five-year capital
improvement plan (CIP) totals approximately $332 million for 2020–2024, and is consistent with
recent levels of spending. Over the previous five years capex averaged 115% of depreciation
signaling a healthy amount of investment. The utility generally funds more than half of its capital
investment from debt. The capital plan includes a potential $150 million debt issuance in 2021 to
refinance short-term lines of credit borrowing used to finance capex.
Financial Profile
Weak 2019 Financial Performance; Recovery Expected in 2020
The utility’s Financial Profile is assessed at ‘aa’ but performance is heavily influenced by
hydrological conditions. The 2019 water year in the northwest was one of the lowest water years
on record and Tacoma’s key ratios all weakened as a result. Deterioration in the utility’s financial
performance in fiscal 2019 was expected at the time of Fitch’s review in 2019.
However, the magnitude of decline was greater than expected and has some potential to weaken
the rating, given the ongoing potential for additional volatility and general economic uncertainty
imposed by the coronavirus in 2020. Substantial cash reserves, average hydrological conditions,
expenditure reductions to date in 2020 and planned annual rate increases of at least 2% should
protect financial performance in the near term.
Operating margin declined in 2019 to 0% from more than 10% in 2017 and 2018. Lower cash flow
resulted in Fitch calculated coverage of full obligations (COFO) of just below 1.0x in 2019 and an
increase in the system’s leverage ratio to 9.7x from 5.0x in 2018.
Tacoma used $10 million in reserves from its rate stabilization fund (RSF) and the balance in the
reserve declined to $38 million from $48 million, to offset the decline in wholesale revenue.
Retail revenue remained healthy in 2019 with usage up 1.3% from 2018 levels and a 2.0% retail
rate increase. Expenses experienced greater pressure than revenues due to the expense of
replacing lower hydroelectric output with purchased power as operating expenses increased 18%
compared with 2018 levels.
Tacoma, Washington
Rating Report │ August 21, 2020 fitchratings.com 4Public Finance
Public Power
United States
Adequate Liquidity
Fitch assesses the Liquidity Profile of the utility as ‘Neutral’ given the cash reserves on hand
that account for 161 days cash, even though COFO declined to just below 1.0x in fiscal 2019.
Although cash balances declined from 222 days at YE 2018, reserves are robust, including the
RSF, and necessary to protect against the type of water year that occurred in 2019. Debt service
coverage (DSC) was approximately 2.0x in 2019, down from 4.3x in 2018, but still supportive of a
neutral liquidity profile and ultimately, the rating. DSC, as measured by bond covenants, including
the transfer in of deferred revenue, remained healthy at 2.17x.
The RSF transfer was the first transfer since the fund’s inception in fiscal 2012. The fund was
established to offset or minimize the need for large rate increases in any given year. The RSF is
designed to provide liquidity and flexibility to manage revenue and expenditure volatility inherent
in the utility’s hydroelectric power supply. Management does not forecast another draw on the
RSF over the next five years, given the planned 2% annual rate increases.
Tacoma has additional liquidity in the form of a $150 million line of credit, which can be used to
fund working capital. Inclusion of the available balance resulted in a total liquidity cushion of
229 days at YE 2019. The utility secured a $100 million Note Purchase Agreement in May 2020
with KeyBank N.A. (A–/Negative), largely in response to the pandemic, to provide general credit
and additional liquidity should it be required for operational purposes. Management does not
anticipate drawing on this facility at this time. This new liquidity facility will function as a revolving
line of credit and adds approximately 90 days of liquidity.
Fitch Analytical Stress Test
The Fitch Analytical Stress Test (FAST) base case is largely driven by Tacoma’s pro forma
financials including a slight decline in energy sales in 2020, minimal load growth in the subsequent
four years and a 2% annual retail base rate increase. The base case also considers the lease of the
telecom unit in April 2020, ‘adverse’ water conditions assumed in 2021–2024, and planned capex
of approximately $75 million to $80 million per year financed primarily from debt.
The base case indicates leverage should remain below 8.0x over the next five years, which Fitch
considers adequate for the rating. Leverage is expected below 7.0x at YE 2020 with COFO at or
above 1.4x. While the rate increase was delayed by three months, average water conditions in
2020 and the utility’s targeted $8 million in mid-year expenditure reductions should help restore
financial margins even with retail load softening from the coronavirus.
Thereafter, assuming adverse water assumptions, leverage rises to 8.0x in 2021 and trends lower
through 2024. The use of ‘adverse’ water planning assumptions in the base case is conservative.
While adverse water years do occur, it is highly unlikely the utility would experience four such
years in a row. Fitch, therefore, considers the FAST base case as more relevant in its analysis than
our standard stress case.
We also considered a coronavirus sensitized base case in our analysis that models a 9% decline
in energy sales in 2020 with a recovery in sales occurring in the following three years.
While a decline of this magnitude is in excess of what Tacoma is currently experiencing, the
sensitized case is designed to evaluate the effects of major setbacks in containing the virus and the
potential for the extension or re-imposition of lockdowns. In this scenario, the system’s leverage
ratio rises to nearly 9.0x in 2020 and 2021 but moderates to levels closer to 7.0x, given the
recovery in energy sales. Pressure on liquidity in this scenario could necessitate slightly higher
rate increases in 2021 and 2022 to preserve cash balances in compliance with financial policies.
Debt Profile
The utility’s Debt Profile is ‘Neutral’ to the rating. The utility had $373.6 million in long-term debt
outstanding at YE 2019. Outstanding revenue bonds are entirely fixed rate, with final maturity in
2047. Tacoma has short-term variable-rate debt in the form of a line of credit used on an interim
basis to fund capex. There was $75.2 million outstanding at YE 2019, which will be refinanced as
long-term, fixed-rate debt, currently planned to occur in 2021. Debt service is not level but
includes some spikes in the structure in the outer years. Tacoma is planning to address the spike
through an early defeasance of the debt in order to create a more level debt service schedule.
Tacoma, Washington
Rating Report │ August 21, 2020 fitchratings.com 5Public Finance
Public Power
United States
ESG Considerations
The highest level of Environmental, Social and Corporate Governance (ESG) credit relevance, if
present, is a score of ‘3’. This means ESG issues are credit-neutral or have only a minimal credit
impact on the entity, either due to their nature or to the way in which they are being managed by
the entity. For more information on Fitch’s ESG Relevance Scores, visit www.fitchratings.com/esg.
Tacoma, Washington
Rating Report │ August 21, 2020 fitchratings.com 6Public Finance
Public Power
United States
Financial Summary
2016 2016 2017 2018 2019
($ 000, Audited FYE Dec. 31)
Net Adjusted Debt/Adjusted FADS (x) 5.34 5.87 5.03 5.01 9.68
Net Adjusted Debt Calculation
Total Short-Term Debt — — 250 — —
Total Current Maturities of Long-Term Debt 12,730 12,730 11,575 10,095 9,365
Total Long-Term Debt 457,602 457,602 417,800 461,339 470,425
Total Debt 470,332 470,332 429,625 471,434 479,790
+ Capitalized Fixed Charge – Purchased Power 304,406 304,406 325,974 323,084 386,613
+ Total Pension Obligation (GASB Fitch-Adjusted NPL + FASB PBO) — 125,542 117,411 62,944 127,622
– Total Unrestricted Cash 214,474 214,474 195,176 198,827 177,471
– Restricted Funds for Debt Service 27,162 27,162 26,176 25,047 24,207
Adjusted FADS for Leverage Calculation
Total Operating Revenue 418,614 418,614 446,343 455,291 461,366
Total Operating Expense 388,220 388,220 403,210 389,242 459,566
Operating Income 30,394 30,394 43,133 66,050 1,801
+ Adjustment for Deferred and Subsidy Revenue 3,684 3,684 3,688 3,824 (6,407)
+ Depreciation and Amortization 55,702 55,702 57,231 53,869 48,700
+ Interest Income 2,405 2,405 2,251 3,720 7,607
+ Other Non-Cash Charges — 6,492 7,519 8,233 9,205
FADS 92,186 98,678 113,823 135,696 60,906
+ Adjustment for Purchased Power 38,051 38,051 40,747 40,386 48,327
– Total Transfers/Distributions 30,460 30,462 34,142 34,385 33,985
+ Pension Expense — 5,860 9,170 (15,162) 6,602
Coverage of Full Obligations (x) 1.37 1.46 1.65 1.97 0.94
FADS 92,186 98,678 113,823 135,696 60,906
+ Adjustment for Purchased Power 38,051 38,051 40,747 40,386 48,327
– Total Transfers/Distributions 30,460 30,462 34,142 34,385 33,985
Full Obligations Calculation
Cash Interest Paid 20,014 20,014 19,416 20,060 21,294
Prior Year Current Maturities 14,735 14,735 12,730 11,575 10,095
Total ADS 34,749 34,749 32,146 31,635 31,389
+ Adjustment for Purchased Power 38,051 38,051 40,747 40,386 48,327
Liquidity Cushion (Days) 235 262 318 272 229
Unrestricted Cash (Days) 235 240 210 222 161
Liquidity Calculation
+ Total Unrestricted Cash 214,474 214,474 195,176 198,827 177,471
+ Total Borrowing Capacity — 100,000 100,000 100,000 150,000
– Amounts Unavailable — 80,250 250 55,300 75,250
Cash Operating Expense Calculation
Total Operating Expense 388,220 388,220 403,210 389,242 459,566
– Depreciation and Amortization 55,702 55,702 57,231 53,869 48,700
– Other Non-Cash Charges — 6,492 7,519 8,233 9,205
Cash Operating Expense 332,518 332,518 345,979 335,373 410,865
FYE – Fiscal year end. FADS – Funds available for debt service. GASB – Governmental Accounting Standards Board. NPL – Non-performing loan. FASB – Financial Accounting
Standards Board. PBO – Pension benefit obligation. ADS – Annual debt service.
Sources: Fitch Ratings, Fitch Solutions, Lumesis, U.S. Energy Information Agency, Tacoma, Washington.
Tacoma, Washington
Rating Report │ August 21, 2020 fitchratings.com 7Public Finance
Public Power
United States
The ratings above were solicited and assigned or maintained at the request of the rated
entity/issuer or a related third party. Any exceptions follow below.
ALL FITCH CREDIT RATINGS ARE SUBJECT TO CERTAIN LIMITATIONS AND DISCLAIMERS. PLEASE READ THESE LIMITATIONS AND
DISCLAIMERS BY FOLLOWING THIS LINK: HTTPS://FITCHRATINGS.COM/UNDERSTANDINGCREDITRATINGS. IN ADDITION, RATING
DEFINITIONS AND THE TERMS OF USE OF SUCH RATINGS ARE AVAILABLE ON THE AGENCY'S PUBLIC WEB SITE AT
WWW.FITCHRATINGS.COM. PUBLISHED RATINGS, CRITERIA, AND METHODOLOGIES ARE AVAILABLE FROM THIS SITE AT ALL
TIMES. FITCH'S CODE OF CONDUCT, CONFIDENTIALITY, CONFLICTS OF INTEREST, AFFILIATE FIREWALL, COMPLIANCE, AND
OTHER RELEVANT POLICIES AND PROCEDURES ARE ALSO AVAILABLE FROM THE CODE OF CONDUCT SECTION OF THIS SITE.
FITCH MAY HAVE PROVIDED ANOTHER PERMISSIBLE SERVICE TO THE RATED ENTITY OR ITS RELATED THIRD PARTIES. DETAILS OF
THIS SERVICE FOR RATINGS FOR WHICH THE LEAD ANALYST IS BASED IN AN EU-REGISTERED ENTITY CAN BE FOUND ON THE
ENTITY SUMMARY PAGE FOR THIS ISSUER ON THE FITCH WEBSITE.
Copyright © 2020 by Fitch Ratings, Inc., Fitch Ratings Ltd. and its subsidiaries. 33 Whitehall Street, NY, NY 10004. Telephone: 1-800-753-
4824, (212) 908-0500. Fax: (212) 480-4435. Reproduction or retransmission in whole or in part is prohibited except by permission. All rights
reserved. In issuing and maintaining its ratings and in making other reports (including forecast information), Fitch relies on factual information
it receives from issuers and underwriters and from other sources Fitch believes to be credible. Fitch conducts a reasonable investigation of
the factual information relied upon by it in accordance with its ratings methodology, and obtains reasonable verification of that information
from independent sources, to the extent such sources are available for a given security or in a given jurisdiction. The manner of Fitch’s factual
investigation and the scope of the third-party verification it obtains will vary depending on the nature of the rated security and its issuer, the
requirements and practices in the jurisdiction in which the rated security is offered and sold and/or the issuer is located, the availability and
nature of relevant public information, access to the management of the issuer and its advisers, the availability of pre-existing third-party
verifications such as audit reports, agreed-upon procedures letters, appraisals, actuarial reports, engineering reports, legal opinions and other
reports provided by third parties, the availability of independent and competent third-party verification sources with respect to the particular
security or in the particular jurisdiction of the issuer, and a variety of other factors. Users of Fitch’s ratings and reports should understand that
neither an enhanced factual investigation nor any third-party verification can ensure that all of the information Fitch relies on in connection
with a rating or a report will be accurate and complete. Ultimately, the issuer and its advisers are responsible for the accuracy of the
information they provide to Fitch and to the market in offering documents and other reports. In issuing its ratings and its reports, Fitch must
rely on the work of experts, including independent auditors with respect to financial statements and attorneys with respect to legal and tax
matters. Further, ratings and forecasts of financial and other information are inherently forward-looking and embody assumptions and
predictions about future events that by their nature cannot be verified as facts. As a result, despite any verification of current facts, ratings
and forecasts can be affected by future events or conditions that were not anticipated at the time a rating or forecast was issued or affirmed.
The information in this report is provided “as is” without any representation or warranty of any kind, and Fitch does not represent or warrant
that the report or any of its contents will meet any of the requirements of a recipient of the report. A Fitch rating is an opinion as to the
creditworthiness of a security. This opinion and reports made by Fitch are based on established criteria and methodologies that Fitch is
continuously evaluating and updating. Therefore, ratings and reports are the collective work product of Fitch and no individual, or group of
individuals, is solely responsible for a rating or a report. The rating does not address the risk of loss due to risks other than credit risk, unless
such risk is specifically mentioned. Fitch is not engaged in the offer or sale of any security. All Fitch reports have shared authorship. Individuals
identified in a Fitch report were involved in, but are not solely responsible for, the opinions stated therein. The individuals are named for
contact purposes only. A report providing a Fitch rating is neither a prospectus nor a substitute for the information assembled, verified and
presented to investors by the issuer and its agents in connection with the sale of the securities. Ratings may be changed or withdrawn at any
time for any reason in the sole discretion of Fitch. Fitch does not provide investment advice of any sort. Ratings are not a recommendation to
buy, sell, or hold any security. Ratings do not comment on the adequacy of market price, the suitability of any security for a particular investor,
or the tax-exempt nature or taxability of payments made in respect to any security. Fitch receives fees from issuers, insurers, guarantors,
other obligors, and underwriters for rating securities. Such fees generally vary from US$1,000 to US$750,000 (or the applicable currency
equivalent) per issue. In certain cases, Fitch will rate all or a number of issues issued by a particular issuer, or insured or guaranteed by a
particular insurer or guarantor, for a single annual fee. Such fees are expected to vary from US$10,000 to US$1,500,000 (or the applicable
currency equivalent). The assignment, publication, or dissemination of a rating by Fitch shall not constitute a consent by Fitch to use its name
as an expert in connection with any registration statement filed under the United States securities laws, the Financial Services and Markets
Act of 2000 of the United Kingdom, or the securities laws of any particular jurisdiction. Due to the relative efficiency of electronic publishing
and distribution, Fitch research may be available to electronic subscribers up to three days earlier than to print subscribers.
For Australia, New Zealand, Taiwan and South Korea only: Fitch Australia Pty Ltd holds an Australian financial services license (AFS license
no. 337123) which authorizes it to provide credit ratings to wholesale clients only. Credit ratings information published by Fitch is not
intended to be used by persons who are retail clients within the meaning of the Corporations Act 2001.
Tacoma, Washington
Rating Report │ August 21, 2020 fitchratings.com 8You can also read