Degradation Kinetics of Clavulanic Acid in Fermentation Broths at Low Temperatures - MDPI
←
→
Page content transcription
If your browser does not render page correctly, please read the page content below
antibiotics
Article
Degradation Kinetics of Clavulanic Acid in
Fermentation Broths at Low Temperatures
David Gómez-Ríos 1, * , Howard Ramírez-Malule 2, * , Peter Neubauer 3 , Stefan Junne 3 and
Rigoberto Ríos-Estepa 1
 1    Grupo de Bioprocesos, Departamento de Ingeniería Química, Universidad de Antioquia UdeA, Calle 70
      No. 52-21, Medellín 050010, Colombia; rigoberto.rios@udea.edu.co
 2    Escuela de Ingeniería Química, Universidad del Valle, A.A. 25360, Cali 76001, Colombia
 3    Chair of Bioprocess Engineering, Institute of Biotechnology, Technische Universität Berlin, Ackerstr. 76,
      ACK 24, 13355 Berlin, Germany; peter.neubauer@tu-berlin.de (P.N.); stefan.junne@tu-berlin.de (S.J.)
 *    Correspondence: dandres.gomez@udea.edu.co (D.G.-R.); howard.ramirez@correounivalle.edu.co (H.R.-M.);
      Tel.: +57-2-321-2100 (ext. 7367) (H.R.-M.)

 Received: 6 December 2018; Accepted: 15 January 2019; Published: 17 January 2019

 Abstract: Clavulanic acid (CA) is a β-lactam antibiotic inhibitor of β-lactamase enzymes, which
 confers resistance to bacteria against several antibiotics. CA is produced in submerged cultures by
 the filamentous Gram-positive bacterium Streptomyces clavuligerus; yield and downstream process
 are compromised by a degradation phenomenon, which is not yet completely elucidated. In this
 contribution, a study of degradation kinetics of CA at low temperatures (−80, −20, 4, and 25 ◦ C) and
 pH 6.8 in chemically-defined fermentation broths is presented. Samples of CA in the fermentation
 broths showed a fast decline of concentration during the first 5 h followed by a slower, but stable,
 reaction rate in the subsequent hours. A reversible-irreversible kinetic model was applied to explain
 the degradation rate of CA, its dependence on temperature and concentration. Kinetic parameters
 for the equilibrium and irreversible reactions were calculated and the proposed kinetic model was
 validated with experimental data of CA degradation ranging 16.3 mg/L to 127.0 mg/L. Degradation
 of the chromophore CA-imidazole, which is commonly used for quantifications by High Performance
 Liquid Chromatography, was also studied at 4 ◦ C and 25 ◦ C, showing a rapid rate of degradation
 according to irreversible first-order kinetics. A hydrolysis reaction mechanism is proposed as the
 cause of CA-imidazole loss in aqueous solutions.

 Keywords: clavulanic acid; degradation; kinetics; equilibrium; irreversible; imidazole; reaction
 mechanism; fermentation broth; low temperature

1. Introduction
     Clavulanic acid (CA) is a soft β-lactam antibiotic with a strong inhibitory effect on β-lactamase
enzymes, which confer resistance to bacteria against several known broad-spectrum antibiotics. CA
is produced by the filamentous Gram-positive bacterium Streptomyces clavuligerus (S. clavuligerus)
as secondary metabolite related to the clavams pathway derived from arginine and glycerol
metabolism [1,2]. The Streptomyces genus is a typical source of essential antimicrobial compounds;
their production is commonly carried out in liquid cultures where expression of secondary metabolite
mycelia occurs [3,4]. CA production is usually performed in submerged cultures of S. clavuligerus
under aerobic conditions with glycerol as carbon source, maintaining controlled conditions of pH
and temperature [5–9]. Previous studies have shown that CA stability increases at slightly acidic
pH values [10,11]; several authors found a pH of 6.8 as favorable for obtaining high titers of CA in
submerged cultures [5,7,9,12–16].

Antibiotics 2019, 8, 6; doi:10.3390/antibiotics8010006                        www.mdpi.com/journal/antibiotics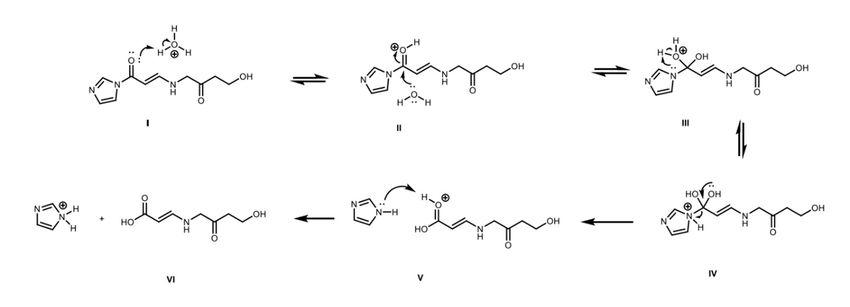
Antibiotics 2019, 8, 6                                                                               2 of 14

      CA chemical instability largely depends on the pH-value owing to the presence of a carbonyl
group linked to the β-lactam ring, which is susceptible to acid or basic catalyzed water attacks [17].
CA is also susceptible to moderate temperature increments, since they accelerate the rate of degradation
regardless of the source [10]. Ishida et al. [18] showed that CA is unstable in production media, which
contains ammonium ions and amine groups due to the presence of ammonium salts and amino acids.
      Bersanetti et al. [10] investigated CA degradation at 10, 20, 25, 30, and 40 ◦ C and pH values of
6.2 and 7.0. The results fitted an irreversible first-order kinetics accounting for the relationship between
the degradation rate constant and the temperature. The highest CA stability was found at slightly acid
conditions (pH 6.2) and low temperatures (10 ◦ C). It was also observed that CA which originated from
fermentation broth, degraded faster than the pure reagent and the commercial medicine [10].
      The decomposition kinetics of CA in concentrations between 2.5 and 20 g/L was investigated by
Brethauer et al [19]. A first-order kinetic model was proposed where the kinetic constant increased
while increasing the initial CA concentration, indicating that CA accelerated its own decomposition [19].
Carvalho et al. [17] explored the CA long-term stability under different conditions of pH (4.0–8.0),
temperature (20–45 ◦ C) and ionic strength. The optimal conditions for achieving a low degradation
rate were pH 6.0–7.2 and 20 ◦ C; in contrast, addition of inorganic salts (NaCl, Na2 SO4 , CaCl2 , and
MgSO4 ) increased instability of CA, possibly due to the higher rate of collisions between molecules
within the solution [17].
      Marques et al. [11] studied the thermal effect on CA production during fermentation in the
temperature range from 24 to 40 ◦ C. The highest rates of CA formation and degradation were observed
at relatively high temperatures (32 and 40 ◦ C). The course of CA concentration fitted irreversible
first-order kinetics and the temperature dependence followed an Arrhenius-type behavior [11].
      Similarly, Costa and Badino [16] investigated the impact of temperature reduction from 30 to 25 ◦ C,
30 to 20 ◦ C, and 25 to 20 ◦ C on CA titers during cultivation. The authors observed that temperature
reduction had a stronger impact on CA production rather than on the reduction of CA degradation [16].
      Different hypotheses regarding CA degradation have been proposed. It has been reported
that amino acids and other metabolites or compounds present in the culture media affect the CA
degradation, their effect is attributed to the polar groups probably attacking the four-ring lactam
carboxyl group of CA to open the β-lactam ring [18,20]. The β-lactam compounds are susceptible to
acid–base catalysis and contain groups such as amino or hydroxyl, which can act as catalysts leading
to a self-catalyzed decomposition [19].
      Due to the wide use of CA in pharmaceutical industry, its production is an intensive field of
research [1]. CA stability in fermentation broths is of interest, especially for downstream processing,
analysis, conservation and storage. Kinetics of CA degradation in fermentation broths at low
temperatures have not been explored so far. This contribution is aimed at modeling and studying the
kinetics of CA degradation at low temperatures (−80, −20, 4, and 25 ◦ C) and pH 6.8 in chemically
defined fermentation broths, as well as during the imidazole–derivatized conditions.

2. Results and Discussion

2.1. Clavulanic Acid Degradation
     Previous studies have shown the susceptibility of CA to be decomposed in solution and
fermentation broths when temperature ranges from 10 ◦ C to 40 ◦ C [10–12]. As far as we know,
kinetics of CA degradation in fermentation broths at low temperatures have not been explored.
The initial CA concentrations (CAo ) in supernatant samples included in the experimental design were
65.48 ± 0.04 mg/L (high level), 25.29 ± 0.03 mg/L (medium level), and 16.33 ± 0.04 mg/L (low level).
An additional sample of higher concentration (CAo =126.67 ± 0.04 mg/L) was included in the study.
The experimental data presented in Figure 1 showed that the degradation proceeded at the highest
rate during the first 5–6 h. Product loss was between 8% and 12% during this time. Interestingly,
the rate of decomposition tended to slow down markedly as CAo decreased, which was also confirmed
Antibiotics 2019, 8                                                                                                      3
Antibiotics 2019, 8, 6                                                                                                   3 of 14

   during the first 5–6 h. Product loss was between 8 and 12% during this time. Interestingly, the rate of
   decomposition
in the               tended toAs
        statistical analysis.  slow   down markedly
                                  expected,            as CAo decreased,
                                               the degradation   of CA was which  was also confirmed
                                                                              considerably             in when
                                                                                             accelerated  the
   statistical  analysis. As  expected,    the  degradation   of CA   was   considerably
                                                                                    ◦      accelerated
temperature increased; thus, at the highest temperature of exposition (25 C), the accumulated loss     when
of temperature
   product reachedincreased;
                        35% thus,
                             at 42 at
                                    h the  highest
                                       at the      temperature
                                               highest initial CAof exposition (25 °C), the accumulated loss
                                                                  o . Comparable results were obtained by
   of product reached 35% at 42 h at the highest initial CAo. Comparable results     were obtained by Ishida
Ishida et al. [18] and Roubos et al. [20] in fermentation broths at 28◦ C with similar composition.
   et al. [18] and Roubos et al. [20] in fermentation broths at 28°C◦with similar composition. In contrast,
In contrast, at the lowest temperature that was evaluated (−80 C), the exhibited degradation rate was
   at the lowest temperature that was evaluated (−80 °C), the exhibited degradation rate was minimum,
minimum, since less than 4% was lost in 42 h. This is a desirable condition for long-term conservation
   since less than 4% was lost in 42 hours. This is a desirable condition for long-term conservation of
of supernatant fermentation samples, assuring a stability of the product of interest.
   supernatant fermentation samples, assuring a stability of the product of interest.

                                (a)                                                          (b)

                                (c)                                                          (d)
         Figure 1. Time courses of relative CA concentration at −80, −20, 4 and 25°C
      Figure 1. Time courses of relative CA concentration at −80, −20, 4 and 25◦ Cand  anddifferent CA initial
                                                                                            different CA initial
         concentrations (CAo). (a) CAo= 126.7 mg/L; (b) CAo= 65.5 mg/L; (c) CAo= 25.3 mg/L; and (d) CAo= 16.3
      concentrations (CAo ). (a) CAo = 126.7 mg/L; (b) CAo = 65.5 mg/L; (c) CAo = 25.3 mg/L; and (d) CAo =
         mg/L.
      16.3 mg/L.

       TheThe   high
             high     degradationrate
                   degradation         rateatat−−20
                                                 20 ◦°C  was not
                                                      C was   not initially
                                                                   initiallyexpected;
                                                                              expected;however,
                                                                                           however,similar
                                                                                                        similarbehavior
                                                                                                                  behaviorwaswas
   observed for other beta lactam antibiotics in aqueous solutions and CA in its pharmaceutical form
observed for other beta lactam antibiotics in aqueous solutions and CA in its pharmaceutical form [21–23].
   [21–23]. This behavior might be caused by the expulsion of the solute to the liquid portion of the
This behavior might be caused by the expulsion of the solute to the liquid portion of the mixture, which
   mixture, which can form a layer on the surface of ice or can be trapped between growing ice grain [24].
can form a layer on the surface of ice or can be trapped between growing ice grain [24]. Thus, CA
   Thus, CA degradation would continue in the liquid portions. Additionally, given the continuous
degradation would continue in the liquid portions. Additionally, given the continuous reduction of
   reduction of the liquid volume, the local concentration of the solute in this limited volume increases
thesignificantly
    liquid volume,       the local concentration of the solute in this limited volume increases significantly
                    also increasing the reaction rate [24]. Nevertheless, this condition must not remain for a
also  increasing
   long             the reaction
           time since    completerate     [24]. Nevertheless,
                                       crystallization    of the this  condition
                                                                  solution    will must    not remain
                                                                                     necessarily    stop for
                                                                                                          the areaction.
                                                                                                                long timeThis
                                                                                                                            since
complete
   condition might also explain the trends of degradation at −80 °C and its stabilization beyond 20 h. also
              crystallization     of the  solution    will necessarily    stop  the   reaction.    This  condition   might
explain Thethe trends   of degradation
                statistical analysis withat95%  −80of◦ C  and its stabilization
                                                       confidence    (r2 = 0.996) beyond
                                                                                   indicates20thath. both, temperature and
   CA  The   statistical
        o, affect         analysis with
                  the degradation       of CA95%in of
                                                   theconfidence
                                                        time range(rexplored
                                                                       2 = 0.996)(0 indicates
                                                                                     to 42.1 h.).that
                                                                                                   Theboth,  temperature
                                                                                                        Pareto  standardized and
CAchart
    o , affect  the degradation
           (Figure                    of CA in thethe
                     2) represents graphically         time  rangeofexplored
                                                          analysis     variance,(0    to 42.1 the
                                                                                  showing     h.). significant
                                                                                                    The Paretoeffects
                                                                                                                  standardized
                                                                                                                        on the
chart   (Figurevariable,
   response       2) represents      graphically
                            i.e., final             the analysis
                                        CA concentration.      Theofresults
                                                                       variance,
                                                                             of theshowing
                                                                                       analysisthe   significant
                                                                                                 of variance      effects
                                                                                                               show   thaton
                                                                                                                           thethe
response variable, i.e., final CA concentration. The results of the analysis of variance show that the
temperature effect is much more significant than CAo and the combined interaction effect, influencing
the final CA concentration negatively in the period between 0 and 42 h.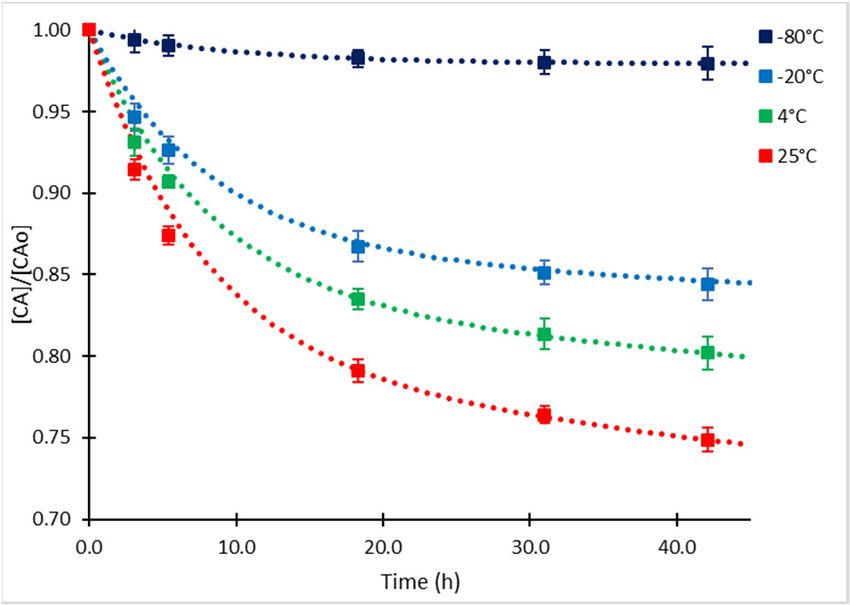
The statistical analysis with 95% of confidence (r2 = 0.996) indicates that both, temperature and
CAo, affect the degradation of CA in the time range explored (0 to 42.1 h.). The Pareto standardized
chart (Figure 2) represents graphically the analysis of variance, showing the significant effects on the
response variable, i.e., final CA concentration. The results of the analysis of variance show that the
temperature       effect
     Antibiotics 2019, 8, 6is much more significant than CAo and the combined interaction effect, influencing
                                                                                                    4 of 14
the final CA concentration negatively in the period between 0 and 42 h.

                                                                                               +
                                                                                               -
                         Temperature

                     CA Concentration

                           Interaction

                                         0      10        20        30       40        50
                                                       Standardized effect

                     Figure 2. Temperature
                        Figure 2. Temperatureand
                                              andconcentration   effectsononCA
                                                  concentration effects      CA   final
                                                                               final    concentration
                                                                                     concentration.

      The The     trends
             trends    of of
                          CA CA  decomposition in
                               decomposition       infermentation
                                                      fermentation  broth  seem
                                                                       broth      to deviate
                                                                               seem           from first
                                                                                       to deviate    fromand  pseudo-first-
                                                                                                           first and pseudo-
      order    kinetics previously    reported  for CA   solutions  prepared   with   standard
first-order kinetics previously reported for CA solutions prepared with standard reactant or      reactant or commercial
      formulations [10,19,23,25–27]. Similar behaviors to those observed in this work can be observed in the
commercial formulations [10,19,23,25–27]. Similar behaviors to those observed in this◦ work can be
      data presented by other authors for CA from fermentation broths in the range of 10 to 40 C [10,17].
observed in the data presented by other authors for CA from fermentation broths in the range of 10
      The rate of CA degradation is susceptible to medium composition, exhibiting higher degradation
to 40rates
       °C [10,17].     The rate of
             in supplemented      andCAcomplex
                                         degradation
                                                  media is  susceptible
                                                          [10,11,16].      topresent
                                                                      In the  medium       composition,
                                                                                        study,             exhibiting
                                                                                                the degradation          higher
                                                                                                                  rate was
degradation        rates   in  supplemented        and    complex     media     [10,11,16].    In   the
      expected to be low since the substances present in the supernatants would be considerably less.    present    study,   the
degradation  Due rate   was expected
                   to experimental       to be low
                                     limitations       since the
                                                  regarding   theanalysis
                                                                   substances
                                                                           of thepresent
                                                                                   productsinofthe
                                                                                                 CAsupernatants
                                                                                                      decomposition,would
                                                                                                                       only be
considerably       less. of CA concentration could be properly followed. Initial CA concentration of 65.5 mg/L
      the time course
      Due to experimental
      was   chosen    as the baselimitations
                                   case for theregarding
                                                 estimationthe   analysis
                                                              of the kineticofparameters
                                                                               the products      of CA decomposition,
                                                                                            of degradation    for being in only
      the middle
the time    courseofoftheCArange   of concentrations
                              concentration    could be under  study. followed.
                                                           properly   In Figure 3,Initial
                                                                                     a semi-log   representation of
                                                                                            CA concentration      of 65.5
                                                                                                                     CA atmg/L
      different   temperatures    is presented.   A  more  pronounced     slope  of the  line is
was chosen as the base case for the estimation of the kinetic parameters of degradation for beingattained during   the first in
      5–6 h ofof
theAntibiotics
     middle      exposition,  the slope decreased substantially thereafter. Thus, two kinetic constants (kobs,1 and
               2019,the
                     8 range of concentrations under study. In Figure 3, a semi-log representation                        of CA
                                                                                                                             5
      kobs,2 ) were determined by means of a linear regression from data plotted in Figure 3. The results of
at different temperatures is presented. A more pronounced slope of the line is attained during the
      the observed rate constants kobs,1 for t < 5.5 h and kobs,2 for t > 5.5 h are presented in Table 1.
first 5–6 h of exposition, the slope decreased substantially thereafter. Thus, two kinetic constants (kobs,1
and kobs,2) were determined by means of a linear regression from data plotted in Figure 3. The results
of the observed rate constants kobs,1 for t < 5.5 h and kobs,2 for t > 5.5 h are presented in Table 1.

                               (a)                                                            (b)

           Figure 3. Semi-log plots of CA concentration (CAo = 65.5 mg/L) at −80, −20, 4 and 25 ◦ C. (a) t ≤ 6 h;
           and (b) t > 6 h.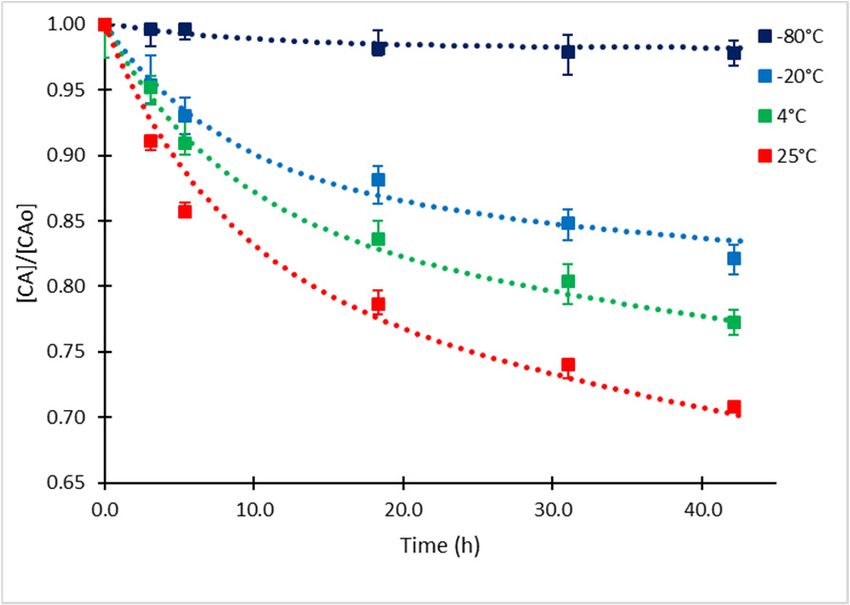
Antibiotics 2019, 8, 6 5 of 14
Table 1. Observed reaction rate constants for t < 5.5 h (kobs,1 ) and t > 5.5 h (kobs,2 ) at −80, −20, 4 and
25 ◦ C.
t < 5.5 h t > 5.5 h
Temperature
kobs,1 (h−1 ) r2 kobs,2 (h−1 ) r2
−80 ◦ C 0.0009 0.969 0.0005 0.924
−20 ◦ C 0.0135 0.991 0.0034 0.992
4 ◦C 0.0241 0.996 0.0035 0.998
25 ◦ C 0.0320 0.998 0.0047 0.997
2.2. Kinetic Approach of CA Degradation
The increase of the reaction rate with temperature rise is typical of Arrhenius type kinetics
and the significant effect of CAo can be attributed to self-catalysis [19] or degradation reaction with
stoichiometric coefficient higher than one. In this case, the dynamics of CA concentration at different
temperatures do not fit with irreversible first-order or pseudo-first-order models; rather they are
similar to those observed in two consecutive equilibrium-irreversible first-order reactions (Equations
(1) and (3)). A similar approach was also proposed by Carvalho et al. [17] for degradation of CA
solutions prepared with standard reactant, at temperatures ranging from 20 to 40 ◦ C. The observed time
courses of CA degradation are typical of consecutive equilibrium-irreversible reactions in which the
reaction rate of the irreversible reaction is considerably low in comparison to the equilibrium reaction
(i.e., k2 < k1 < k−1 ) [17]. Under these conditions, irreversible reaction would be the rate-limiting step,
hence the reactant and the intermediate would be in equilibrium condition. Based on this analysis,
the following kinetic mechanism of CA degradation was considered: a first step occurs in equilibrium,
in which CA produces an active intermediate (I*), hereinafter this intermediate reacts irreversibly with
an additional CA molecule to form the degradation product (D).
CA
I ∗ r1 = k1 [CA] − k−1 [I∗ ] (1)
k1
Keq = (2)
k−1
I∗ + CA → D r2 = k2 [CA] (3)
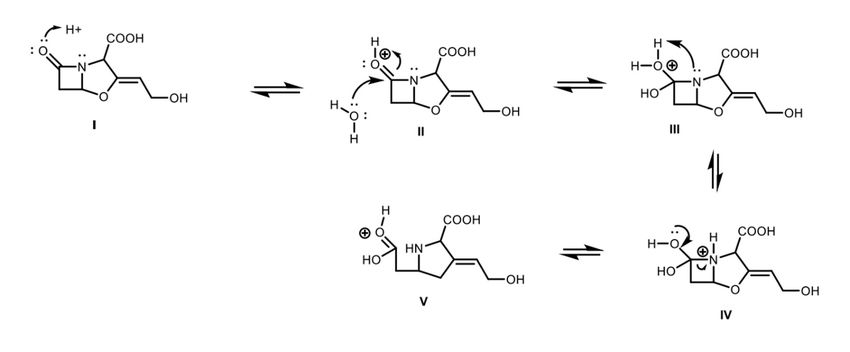
This kinetic approach is consequent with a feasible chemical mechanism of reaction for CA in
aqueous solutions, characterized by several equilibrium steps (Figure 4) [28,29]. Additionally, this
molecule has different potential candidate nodes (C atoms bonded to N and/or O) for suffering
nucleophilic attacks from the substances present in the medium, e.g., CA itself, amino acids, and other
metabolites with electronegative groups. In this regard, Zhong et al. [30] proposed a mechanism of
formation of the degradation product known as substance E; this mechanism involves several steps,
including the irreversible reaction of an active intermediate with an additional molecule of CA leading
to the reported decomposition product.
In the general case, the early steps of CA degradation must involve the equilibrium reaction of
opening of the β-lactam ring, via protonation of oxygen and nucleophilic attack of a water molecule to
the carbonyl group (Figure 4). Once the open intermediate is formed, several irreversible possibilities
can occur like nucleophilic attacks by nitrogen on other CA molecules or amino acids, imine formation
via decarboxylation or attack of other substances present in the medium [31].
Under this kinetic approach, two kinetic rate constants were determined from experimental
data: the equilibrium constant (Keq ) and the irreversible rate constant (k2 ). During the first 5–6 h
of exposition, and according to Equation (1), the equilibrium reaction is favoring the formation
of intermediate I*, which is converted irreversibly into product D at lower reaction rate, thus the
irreversible reaction (Equation (2)) is the rate-limiting step. This condition, allowed to determine
the rate constant (k2 ) for the irreversible reaction from semi-log plot of CA concentration at each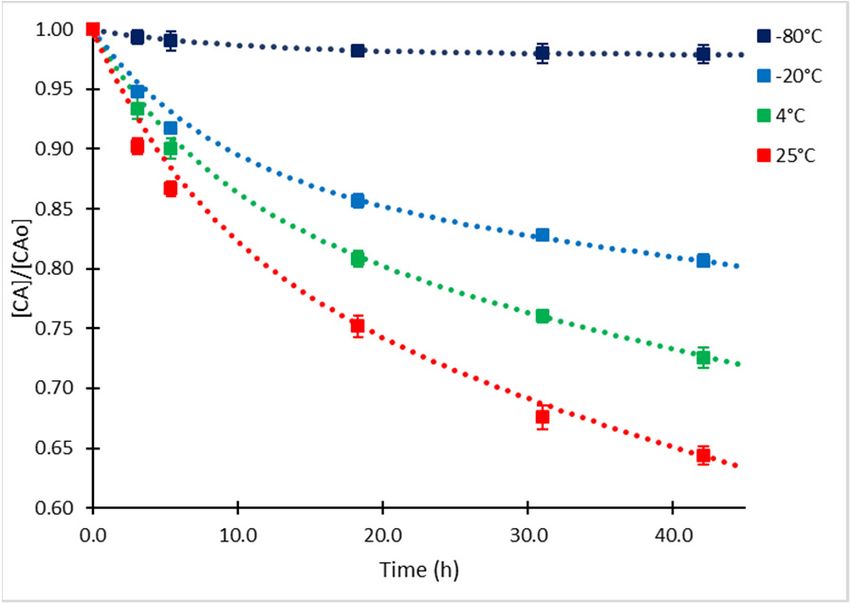
aqueous solutions, characterized by several equilibrium steps (Figure 4) [28,29]. Additionally, this
molecule has different potential candidate nodes (C atoms bonded to N and/or O) for suffering
nucleophilic attacks from the substances present in the medium, e.g., CA itself, amino acids, and
other metabolites with electronegative groups. In this regard, Zhong et al. [30] proposed a mechanism
ofAntibiotics
   formation  2019, 8, 6
                   of the degradation product known as substance E; this mechanism involves 6several       of 14

steps, including the irreversible reaction of an active intermediate with an additional molecule of CA
leading    to the (Figure
  temperature       reported
                           3a)decomposition    product.
                               [17]. Values of the irreversible rate constant (k2 ) were previously determined
  as kobs,1 .

        Figure 4. Early steps of CA degradation: (I). Protonation of carbonyl group in the β-lactam ring.
      Figure   4. Early steps
        (II). Nucleophilic    of CA
                           attack    degradation:
                                  of water         (I). Protonation
                                           to carbonyl                of carbonyl group
                                                        group. (III). Deprotonation     in the β-lactam ring.
                                                                                    of water–protonation of the(II).
      Nucleophilic    attack
        nitrogen. (IV–V).     of water
                           Breaking     to carbonyl
                                     of C–N           group.
                                            bond in the       (III).ring.
                                                         β-lactam    Deprotonation of water–protonation of the
      nitrogen. (IV–V). Breaking of C–N bond in the β-lactam ring.
       The significant concentration of intermediate I* after 6 shifts the equilibrium towards CA and
     In the
  hence, thegeneral
              equilibriumcase,reaction
                                the early  steps of
                                       (Equation     CA
                                                  (1))     degradation
                                                       is the            must
                                                              rate-limiting stepinvolve   thecase
                                                                                 [17]. In the  equilibrium  reaction of
                                                                                                  of the equilibrium
opening
  constantof (K
              the  β-lactam
                eq ),           ring, via
                      values were         protonation
                                      determined    fromofexperimental
                                                             oxygen and nucleophilic
                                                                           time courses attack
                                                                                           of CA of  a water molecule
                                                                                                   concentration   by
  applying   parameter     estimation   using the Levenberg-Marquadt       method   for  least
to the carbonyl group (Figure 4). Once the open intermediate is formed, several irreversible   squares minimization.
  The summary
possibilities  canof    kinetic
                      occur  likeparameters   for attacks
                                   nucleophilic   the two-reaction    model
                                                            by nitrogen   on for  CACA
                                                                               other   degradation
                                                                                           moleculesisorpresented  in
                                                                                                          amino acids,
  Table 2.
imine formation via decarboxylation or attack of other substances present in the medium [31].
      Under this kinetic approach, two kinetic rate constants were determined from experimental
            Table 2. Kinetic constants for the Equilibrium-Irreversible reaction model of CA degradation.
data: the equilibrium constant (Keq) and the irreversible rate constant (k2). During the first 5–6 h of
exposition, and according                 Equilibrium
                                    to Equation     (1), Constant      Irreversible
                                                          the equilibrium            Rateis
                                                                              reaction     Constant k2 the formation of
                                                                                             favoring
                      Temperature
                                                     Keq                            (h−1 )
intermediate I*, which is converted irreversibly into product D at lower reaction rate, thus the irreversible
                        −80    ◦C
reaction (Equation (2))    is the   rate-limiting 0.018
                                                    step. This condition, allowed  0.0009to determine the rate constant
                        −20 ◦ C                     0.162                          0.0135
(k2) for the irreversible4 reaction
                            ◦C          from semi-log
                                                    0.210
                                                          plot of CA concentration      at each temperature (Figure 3a)
                                                                                   0.0241
[17]. Values of the irreversible
                         25 C◦         rate constant0.280(k2) were previously determined
                                                                                   0.0320        as kobs,1.
      The significant concentration of intermediate I* after 6 shifts the equilibrium towards CA and
hence, The
         the estimated
              equilibriumvalues reaction   (Equation
                                   of equilibrium         (1)) isconfirmed
                                                      constant     the rate-limiting
                                                                             the initial step  [17]. Inof the
                                                                                         assumption         k2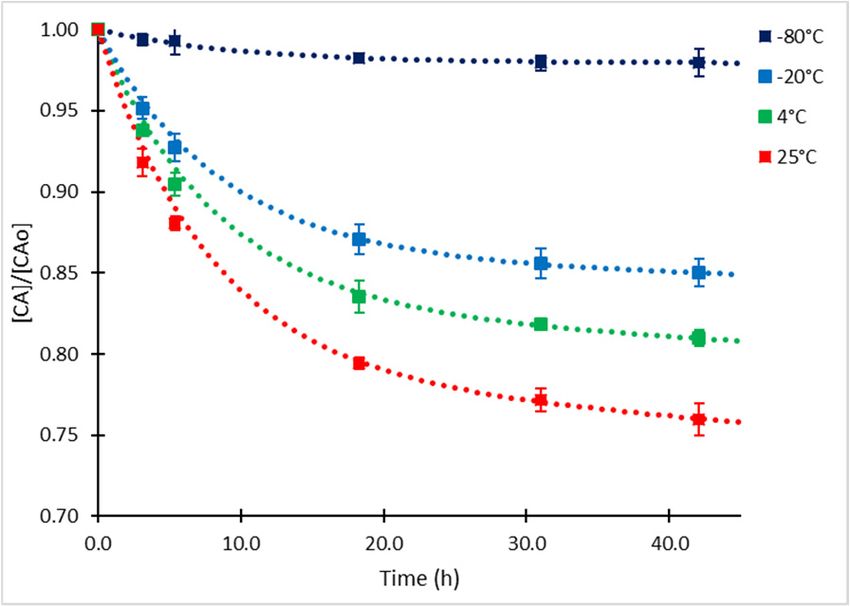
of 3.155 kJ/mol. This shows that decomposition via a transition state is thermally activated. Marques
et al. [11] pointed out that ΔG° values for CA formation are slightly higher than those for CA
degradation and at moderate temperatures the degradation of CA would be practically unavoidable.
This fact explains the accumulation of CA in the fermentation broth while the microorganism is active
despite   the continuous
     Antibiotics 2019, 8, 6 degradation. Yet, when the production rate decreases, CA would eventually
                                                                                             7 of 14
disappear from the broth due to decomposition.

     Figure  5. Arrhenius
         Figure  5. Arrheniusplot  fordetermination
                              plot for determination    of kinetic
                                                    of kinetic      parameters
                                                               parameters (Ea and (E   and
                                                                                  A)a for theA)  for the reaction
                                                                                             irreversible irreversible
         of CA
     reaction ofdegradation.
                 CA degradation.
     2.3. Kinetic Model Validation
2.3. Kinetic Model Validation
         The proposed kinetic approach was validated with all the experimental data of CA degradation
     The proposed
    obtained           kineticNumerical
               in this study.  approachsimulations
                                          was validated
                                                    of thewith   all model
                                                           kinetic   the experimental    dataand
                                                                           were performed,     of CA
                                                                                                   theirdegradation
                                                                                                         results
obtained  in this  study.   Numerical   simulations of the kinetic    model   were   performed,   and
    were compared with the experimental results of CA degradation at all temperatures and CAo values.   their results
wereThe
      compared
        CA relativewith   the experimental
                       concentration        results
                                     time courses   ofthe
                                                  and  CAcorresponding
                                                           degradation experimental
                                                                            at all temperatures   and
                                                                                          points are     CAo values.
                                                                                                     presented
    in Figure   6.  The  normalized-root-mean-square    error  (NRMSE)     calculated  between   the
The CA relative concentration time courses and the corresponding experimental points are presented   complete
    experimental
in Figure  6. Thedataset    and model predictions was used
                      normalized-root-mean-square       errorfor(NRMSE)
                                                                  assessing the  accuracy between
                                                                             calculated   of the kinetic
                                                                                                     themodel
                                                                                                           complete
    (Table 3).
experimental dataset and model predictions was used for assessing the accuracy of the kinetic model
(Table 3). Table 3. Normalized-root-mean-square error (NRMSE) for the kinetic model of CA degradation.

                    Concentration (mg/L)        Temperature (◦ C)     NRMSE (%)        Shelf Life (t90 )
                            126.7                      −80                 1.87          5.1 months
                            126.7                      −20                 3.22              9.0 h
                            126.7                       4                  2.18              6.5 h
                            126.7                      25                  3.78              4.5 h
                             65.5                      −80                 1.95          9.8 months
                             65.5                      −20                 4.98              9.7 h
                             65.5                       4                  4.93              6.6 h
                             65.5                      25                  4.45              4.6 h
                             25.3                      −80                 1.92           2.1 years
                             25.3                      −20                 3.36              9.9 h
                             25.3                       4                  3.27              6.7 h
                             25.3                      25                  3.40              4.7 h
                             16.3                      −80                 3.89           3.1 years
                             16.3                      −20                 1.98              10 h
                             16.3                       4                  2.53              6.8 h
                             16.3                      25                  2.42              4.8 h

          As observed in Figure 6, the simulated time course of CA concentration shows a good
     approximation to the experimental values, notwithstanding the assumptions made for the
     determination of kinetic parameters. The proposed model of degradation simplified the decomposition
     of CA to only one intermediate product and one decomposition product following equilibrium and
     irreversible first-order kinetics; hence, deviations were expected between experimental and simulated
     data. Nevertheless, in the range of the concentrations and temperatures evaluated, the model showed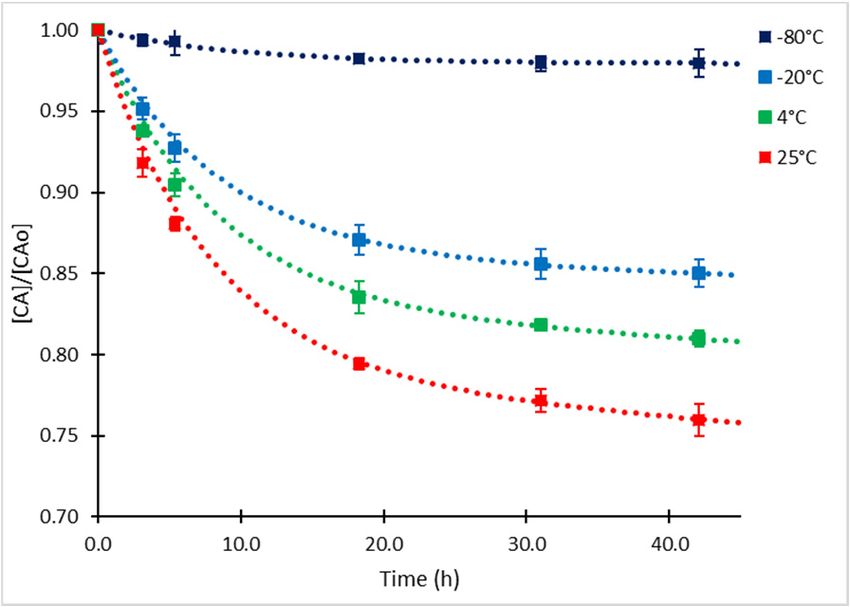
Antibiotics 2019, 8, 6                                                                                          8 of 14

a good fit, since the deviation of the predicted and measured concentrations was less than 5% in all
cases. As it can be observed in Table 3, under this kinetic mechanism, the shelf-life of the product
is highly dependent on temperature and initial CA concentration and not only on the rate constant
as the case of the irreversible first-order reactions. The results obtained for the shelf-lives of CA in
fermentation broth are comparable to the data obtained by Jerzsele and Nagy [26] for aqueous solutions
of standard clavulanate, Bersanetti et al. [10], Ishida et al. [18] and Roubos et al. [20] for CA degradation
in fermentation broths at room temperature. The shelf lives obtained at −20 ◦ C confirm the significant
degradation rate at this temperature, similar observations were reported in the temperature range
from −7 to −25 ◦ C for CA solutions of pharmaceutical CA [23] and other β-lactam compounds [21,22].
InAntibiotics
   all cases,2019,
               the8shelf lives of the CA in supernatants are considerably lower than those reported for9CA
aqueous solutions prepared with pharmaceutical formulations [24,25,32], possibly due to the addition
of some stabilizing components to assure a long life in the commercial product.

                             (a)                                                     (b)

                             (c)                                                     (d)

      Figure 6. Experimental points (squares) and model prediction (dashed line) of CA degradation at −80,
        Figure 6. Experimental points (squares) and model prediction (dashed line) of CA degradation at −80,
      −20,  4 and 25 ◦ C. (a) CA = 126.7 mg/L; (b) CA = 65.5 mg/L; (c) CAo = 25.3
        −20, 4 and 25 °C. (a) CAo=o126.7 mg/L; (b) CAo= 65.5o mg/L; (c) CAo= 25.3 mg/L;
                                                                                            mg/L; and (d) CA =
                                                                                        and (d) CAo= 16.3 mg/L. o
      16.3 mg/L.
        The proposed kinetic approach for CA degradation explains the observed effect of increase in
      The proposed kinetic approach for CA degradation explains the observed effect of increase
   the reaction rate with increasing CAo. The equilibrium-irreversible reaction model fits not only the
in hypothetical
    the reaction chemical
                  rate withreaction
                            increasing     CAo . The involving
                                       mechanisms     equilibrium-irreversible
                                                                 equilibrium steps,reaction  model
                                                                                       but also  the fits  not only
                                                                                                       potential
theenzymatic
     hypothetical   chemicalofreaction
               degradation       CA in mechanisms
                                           fermentation involving
                                                         broths at equilibrium
                                                                     temperaturessteps,   butthan
                                                                                     higher    also4the
                                                                                                      °C,potential
                                                                                                            since
enzymatic                                                                                                ◦
   Michaelis-Menten kinetics represents a special case of this kind of reactions. However, 4the C,
              degradation   of   CA   in  fermentation   broths   at  temperatures     higher  than            since
                                                                                                            most
Michaelis-Menten      kinetics
   significant effect on        represents seems
                         CA degradation       a special case
                                                    to be theofchemical
                                                                 this kind  of reactions.
                                                                         mechanism,         However,
                                                                                        considering   thethe   most
                                                                                                           rapid
significant  effect
   degradation   alsoon CA degradation
                      observed  in standardseems    to be
                                              solutions   the
                                                        and    chemical
                                                            (aqueous)     mechanism, considering
                                                                        pharmaceutical    products, wherethe the
                                                                                                              rapid
degradation
   presence ofalso   observed
                 enzymes       in standard
                          or proteins         solutionsMoreover,
                                         is discarded.  and (aqueous)
                                                                   Ishidapharmaceutical
                                                                           et al. [18] foundproducts,   whereofthe
                                                                                               no influence
   exocellular proteins (in the culture broth) on the degradation of CA; hence, the enzymatic effect
   would not be considered as a degradation factor. Presence of free amino acids and decomposition
   products in CA solutions increase the degradation rate [18,19]; this might be an indicator of
   susceptibility of CA molecules to nucleophilic attacks added to the variable catalytic effect of pH
   [10,17,23,25].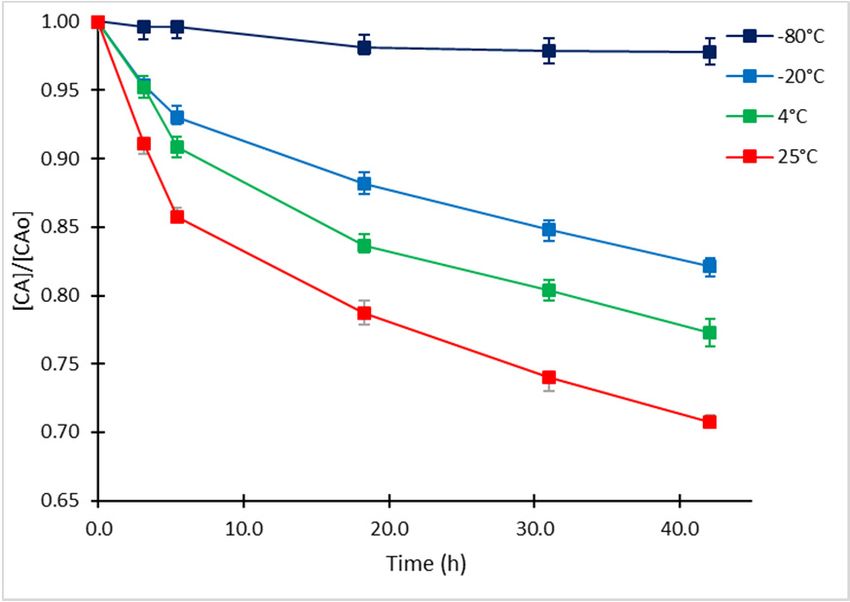
the reaction rate with increasing CAo. The equilibrium-irreversible reaction model fits not only the
hypothetical chemical reaction mechanisms involving equilibrium steps, but also the potential
enzymatic degradation of CA in fermentation broths at temperatures higher than 4 °C, since
Michaelis-Menten kinetics represents a special case of this kind of reactions. However, the most
significant effect on CA degradation seems to be the chemical mechanism, considering the rapid
Antibiotics 2019, 8, 6 9 of 14
degradation also observed in standard solutions and (aqueous) pharmaceutical products, where the
presence of enzymes or proteins is discarded. Moreover, Ishida et al. [18] found no influence of
presence of enzymes
exocellular or (in
proteins proteins is discarded.
the culture broth) onMoreover, Ishida etofal.
the degradation [18]hence,
CA; foundthenoenzymatic
influence of effect
exocellular
would not proteins (in the culture
be considered as a broth) on the degradation
degradation of CA;
factor. Presence of hence, the enzymatic
free amino acids andeffect would
decomposition
not products
be considered in CAas asolutions
degradation factor. the
increase Presence of free amino
degradation rate acids andthis
[18,19]; decomposition
might be an products
indicatorin of
CA susceptibility
solutions increase of CAthemolecules
degradation rate [18,19]; this
to nucleophilic might
attacks be antoindicator
added of susceptibility
the variable of CA
catalytic effect of pH
molecules to nucleophilic attacks added to the variable catalytic effect of pH [10,17,23,25].
[10,17,23,25].
2.4. 2.4.
Derivatized Clavulanate-Imidazole
Derivatized Degradation
Clavulanate-Imidazole Kinetics
Degradation Kinetics
CA CAis poorly
is poorlyretained in C-18
retained in C-18 reverse-phase
reverse-phase columns for for
columns High Performance
High PerformanceLiquid
Liquid
Chromatography
Chromatography(HPLC) and and
(HPLC) it does not produce
it does distinctive
not produce peaks.peaks.
distinctive Therefore, derivatization
Therefore, of CAof
derivatization is CA
required to generate the chromophore clavulanate-imidazole (CAI), which is detectable at
is required to generate the chromophore clavulanate-imidazole (CAI), which is detectable at a a wavelength
of 311 nm. During
wavelength of derivatization
311 nm. During the β-lactam ring of CA
derivatization the isβ-lactam
opened, ring
yielding decarboxylation
of CA and
is opened, yielding
formation of an amido
decarboxylation andgroup as shown
formation in Figure
of an amido 7. as shown in Figure 7.
group
Figure 7. Derivatization
Figure of CA
7. Derivatization of with imidazole:
CA with Alkylation
imidazole: of secondary
Alkylation nitrogen
of secondary in the
nitrogen in imidazole.
the imidazole.
Considering
Considering the the
structural difference
structural between
difference between the the
CAICAIandand CA,CA,it was observed
it was thatthat
observed the the
chromophore
chromophore
Antibiotics 2019, 8 is also unstable over time, following a different kinetic mechanism to the
is also unstable over time, following a different kinetic mechanism to the untreated10CA.untreated
CA.Statistical
Statisticalanalysis
analysis with
with 95%
95% ofof confidence 2
confidence (r (r2 == 0.998)
0.998) indicated
indicated thatthatsolely
solelytemperature
temperaturehadhad a
asignificant
significanteffect
effectononthe
thefinal
finalconcentration
concentrationof ofthe
the analyzed
analyzed CAI,
CAI, showing a typical Arrhenius-type
Arrhenius-type
behavior.
behavior. Time Timecourses
coursesforforCAI
CAIwith
with initial
initial concentrations
concentrations (CAI
(CAI o )0.636
o) of of 0.636
mM mM and 0.310
and 0.310 mM atmM at
4 and
425and
°C 25 ◦ C exhibited
exhibited higherhigher degradation
degradation ratesrates
thanthan
thosethose
forfor
CA.CA.InIn
thisthiscase,
case,the
theCAI
CAI showed
showed linear
dependency
dependency on concentration as it can be observed in the semi-log plot of relative concentrations for
CAI analyzed
the CAI analyzed at different times times (Figure
(Figure 8), therefore,
therefore, thethe degradation
degradation rate of the the derivatized
derivatized CA
exhibited aa first-order
exhibited first-order kinetics.
kinetics.
Figure
Figure 8.
8. Semi-log
Semi-log plot
plot of
of relative
relative concentrations ◦ C (blue)
concentrations of derivatized CA at 4 °C (blue) and ◦ C (green).
and 25 °C (green).
The calculated kinetic rate
rate constants
constants were 0.020hh−1−(r
were 0.020 1 2(r2 = 0.989) and 0.039−1 h−21 (r2 = 0.994) at
= 0.989) and 0.039 h (r = 0.994) at 4 °C
◦C
4and 25
and°C. ◦
25 Both
C. Both values
values are are closer
closer to to those
those calculated
calculated forforthe
theirreversible
irreversiblestep
stepofof reaction
reaction in CA
degradation at the same temperatures (Table 2). Regarding the Arrhenius parameters (r22== 0.997), the
degradation at the same temperatures (Table 2). Regarding the Arrhenius parameters (r
calculated Eaa was
was21.85
21.85kJ/mol,
kJ/mol, which
which is is also
also close
close to the
to the calculated
calculated value
value for for
the the irreversible
irreversible stepstep for
for CA,
the corresponding frequency factor (A) was 262.43 h . The trend of the time course of degradation
−1
for the CAI does not suggest an equilibrium process as for the case of CA, possibly due to the
structural chemical modification; other degradation products are formed following a different
mechanism. The results indicate a loss of 56% of CAI complex during the first 24 h, reaching a
maximum of 82% at 45h and 25 °C. Usually, HPLC autosamplers provide samples cooling at 4 °C.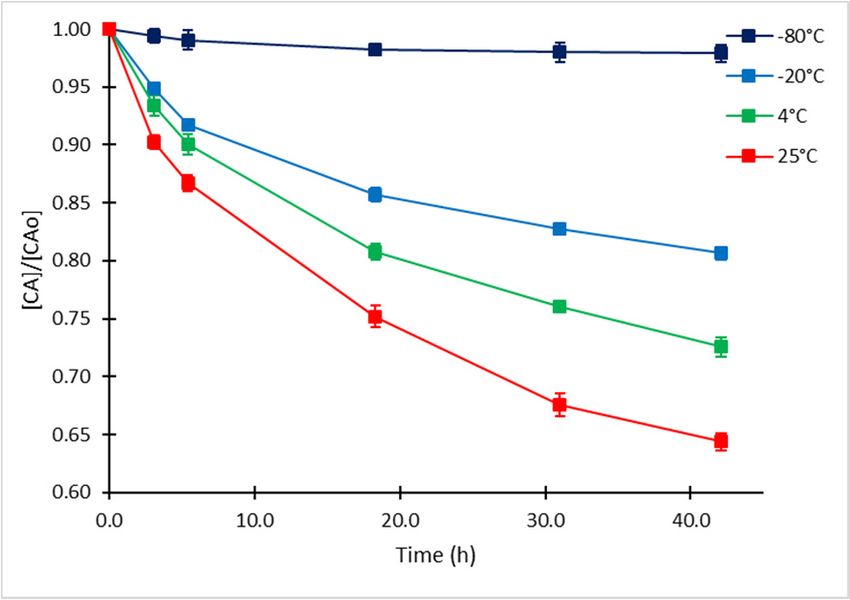
Antibiotics 2019, 8, 6                                                                                               10 of 14

CA, the corresponding frequency factor (A) was 262.43 h−1 . The trend of the time course of degradation
for the CAI does not suggest an equilibrium process as for the case of CA, possibly due to the structural
chemical modification; other degradation products are formed following a different mechanism.
The results indicate a loss of 56% of CAI complex during the first 24 h, reaching a maximum of 82%
at 45h and 25 ◦ C. Usually, HPLC autosamplers provide samples cooling at 4 ◦ C. However, at this
temperature, the rate of degradation is also significant showing a 40% decay in 24 h and a maximum of
60% in 46 h. As expected, the degradation rate constant and hence, the half-life of the chromophore are
independent from the initial CA concentration. The half-lives of the complex were 34.5 h and 17.8 h at
4 ◦ C and 25 ◦ C, respectively. Nevertheless, the degradation process is slowed down by cooling down
the solution at 4◦ C; 10% of the CAI formed is lost in 5 h. These results suggest that it is convenient to
spend a short time between sample derivatization and its injection in the HPLC column for assuring
accurate quantification of CA, even if the sampler is cooled to 4 ◦ C.
      Since the chemical structure of the CA molecule is modified in the derivatization procedure,
a different mechanism of reaction might be operating in the degradation of the chromophore.
N-alkyl-imidazoles are hydrolytically unstable and they react under water-catalyzed, base-catalyzed
(Figure 9), or acid-catalyzed (Figure 10) reaction mechanisms [33,34]. Therefore, it is probable that
the degradation of the chromophore CAI occurs under one of those mechanisms depending on pH
condition. CA is commonly produced and analyzed at slightly acidic conditions, hence, the degradation
of the chromophore CAI would follow the mechanism presented in Figure 10. The irreversible
hydrolysis of the complex might lead to underestimations of CA concentration of samples and/or
Antibiotics 2019, 8 of CA degradation rates due to the waiting time of the derivatized samples until the
overestimation                                                                                           11
Antibiotics 2019, 8                                                                                      11
analyses are performed.

      Figure 9. Base catalyzed hydrolysis of CAI: (I) Nucleophilic attack of hydroxyl to carbonyl group of CAI;
      Figure
      Figure   9. Basedeprotonation
               9. Base
      (II) hydroxyl     catalyzedhydrolysis
                       catalyzed   hydrolysis
                                            ofofCAI:
                                                  CAI:
                                      and protonation(I)(I) Nucleophilic
                                                         Nucleophilic
                                                           of               attack
                                                                         attack
                                                              tertiary nitrogen;    of hydroxyl
                                                                                of hydroxyl
                                                                                   (III–IV)       to carbonyl
                                                                                              to carbonyl
                                                                                             configuration  of group
                                                                                                          group      of
                                                                                                                 of CAI;
                                                                                                               carboxyl
      CAI;
      (II)
      group (II) hydroxyl
           hydroxyl        deprotonation
                       deprotonation
               and elimination           and   protonation
                                      and protonation
                                of imidazole                  of tertiary
                                                           of tertiary
                                               ring; and (V)              nitrogen;
                                                                        nitrogen;
                                                               protonation           (III–IV) configuration of carboxyl
                                                                                   (III–IV) configuration of carboxyl
                                                                              of imidazole.
      group   and  elimination  of imidazole  ring; and   (V) protonation    of
      group and elimination of imidazole ring; and (V) protonation of imidazole.imidazole.

      Figure 10. Acid catalyzed hydrolysis of CAI: (I) Protonation of carbonyl group of CAI; (II) Nucleophilic
      Figureof10.
      attack       Acid
               water      catalyzed
                     to carbonyl      hydrolysis
                                  group           of water
                                         of CAI; (III) CAI: deprotonation;
                                                            (I) Protonation(IV)
                                                                              of protonation
                                                                                  carbonyl group     of CAI;
                                                                                             of tertiary       (II)
                                                                                                         nitrogen
      Figure   10.
      Nucleophilic Acid
                    attackcatalyzed
                            of water  hydrolysis
                                     to carbonyl  of
                                                  groupCAI:
                                                         of (I)
                                                            CAI;Protonation
                                                                 (III) water  of  carbonyl
                                                                             deprotonation; group
                                                                                             (IV)    of  CAI;
                                                                                                  protonation
      and configuration or carboxyl group; (V) elimination of imidazole ring; and (VI) deprotonation of the    (II)
                                                                                                                of
      Nucleophilic  attack
      tertiary nitrogen
      carbonyl  group    and
                       and  of configuration
                               water to carbonyl
                            protonation           group ofgroup;
                                              or carboxyl
                                         of imidazole.      CAI; (III)
                                                                   (V) water deprotonation;
                                                                       elimination           (IV) protonation
                                                                                    of imidazole  ring; and (VI)of
      tertiary nitrogen
      deprotonation      andcarbonyl
                      of the   configuration
                                       grouporandcarboxyl  group;
                                                   protonation     (V) elimination of imidazole ring; and (VI)
                                                                of imidazole.
      deprotonation of the carbonyl group and protonation of imidazole.
3. Materials and Methods
3. Materials and Methods
    S. clavuligerus DSM 41826 cryo-preserved at −80 °C in glycerol solution (16.7% v/v) was
    S. clavuligerus
inoculated           DSMin41826
           for activation       cryo-preserved
                          seed medium           at −80
                                       as described     °C in glycerol
                                                    by Roubos et al. [20].solution  (16.7% v/v) were
                                                                           Batch fermentations   was
Antibiotics 2019, 8, 6 11 of 14
3. Materials and Methods
S. clavuligerus DSM 41826 cryo-preserved at −80 ◦ C in glycerol solution (16.7% v/v) was inoculated
for activation in seed medium as described by Roubos et al. [20]. Batch fermentations were carried
out in a 15 L stirred tank bioreactor (Techfors S, Infors AG, Bottmingen, Switzerland) operated at 5 L
filling volume. Chemically defined media, composed as follows, were used [35]: glycerol (9.3 g/L),
K2 HPO4 (0.8 g/L), (NH4 )2 SO4 (1.26 g/L), monosodium glutamate (9.8 g/L), FeSO4 ·7H2 O (0.18 g/L),
MgSO4 ·7H2 O (0.72 g/L) and trace element solution (1.44 mL). Trace elements solution contained:
H2 SO4 (20.4 g/L), monosodium citrate·1H2 O (50 g/L), ZnSO4 ·7H2 O (16.75 g/L), CuSO4 ·5H2 O
(2.5 g/L), MnCl2 ·4H2 O (1.5 g/L), H3 BO3 (2 g/L), and Na2 MoO4 ·2H2 O (2 g/L). Antifoam 204 was used
at a concentration of 1:1000 v/v, pH was controlled at 6.8 by using NaOH 4M and HCl 4M. Aeration
was provided at 0.6 VVM and temperature was controlled in 28 ◦ C.
Two samples (50 mL) of fermentation broth were withdrawn at 36 h of cultivation coinciding with
phosphate limitation and exponential phase of growth, both conditions leading to the highest specific
CA production and metabolic activity of the strain. Biomass and particulate material were separated
by centrifugation at 12000 rpm and filtration using 0.2 µm pore size filters. Supernatants containing
CA were adjusted to pH 6.8 and then vortexed and divided in 2 mL aliquots in Eppendorf tubes,
according to the experimental design. Dilutions (1:2 and 1:5) were also prepared; finally, samples were
divided into four groups and stored at the corresponding exposition temperatures.
A factorial experimental design was proposed; concentration and temperature were defined as
factors varying at three and four levels, respectively. The concentration of the supernatant was set as
the highest level; dilutions 1:2 and 1:5 were set as the medium and low levels, respectively. Twelve
experimental runs were performed by duplicate. Supernatant samples were stored at −80 ◦ C, −20 ◦ C,
4 ◦ C, and 25 ◦ C, respectively, for 43 h. Supernatant samples were withdrawn at 3.1 h, 5.4 h, 18.3 h, 31.0 h,
and 42.1 h of storage, derivatized with imidazole solution 20% during 30 min at 30 ◦ C and 800 rpm
in a mixing block and immediately analyzed by HPLC. To test the degradation profile at a higher
CA concentration than that of the experimental design, an additional duplicate run of supernatant
samples with higher CA content (127 mg/L) from a different batch produced with identical medium
and conditions was also exposed to the referred temperatures and treated as previously indicated.
For the study of CAI stability, a 2-squared factorial design with duplicates was used. CA samples
from fermentation broth with initial concentration of 127.0 mg/L (0.636 mM) and 61.7 mg/L (0.310 mM)
were treated as previously described and derivatized. The derivatized samples were stored at 4 ◦ C and
25 ◦ C, aliquots were withdrawn at five different times in a time span of 46 h and analyzed by HPLC.
All the analyses of samples were carried out in an HPLC equipped with a DAD detector (1200
Series, Agilent Technologies, Waldbronn, Germany), using a Zorbax Eclipse XDB-C-18 chromatographic
column (Agilent Technologies, Waldbronn, Germany) and a C-18 guard column (Phenomenex®,
Aschaffenburg, Germany). The quantification of samples was carried out according to the gradient
method described by Ramirez-Malule et al. [36].
The statistical analysis of the data for 95% of confidence was performed in Statgraphics Centurion
XVII (Statgraphics Technologies, Inc. The Plains, VA, USA). Kinetic parameters were calculated by
linear regression of experimental data with the least squares method; consistency was checked by
determination of correlation coefficient (r2 ) and residual analysis.
4. Conclusions
The kinetics of degradation of CA produced by S. clavuligerus DSM 41826 in a chemical
defined medium was satisfactorily represented by two reaction models: one equilibrium reaction for
intermediate formation and one irreversible first-order reaction for the degradation product formation.
The equilibrium and irreversible reaction constants increased in parallel with temperature following
the Arrhenius behavior. The proposed model showed a better fit with the experimental points than
the traditional irreversible first-order model. Calculated NRMSE values at different temperatures and
concentrations were less than 5% in all cases.Antibiotics 2019, 8, 6 12 of 14
The samples of CA in fermentation broth exhibited a fast decline of concentration during the
first 5 h followed by a slower but stable reaction rate in the subsequent hours, which had been also
observed in previous works. The reaction rate of degradation is dependent on several factors like pH,
medium composition and temperature, which explains the high variability in the values of constant
rates available in literature. The degradation rate at −80 ◦ C is almost null, thus, this condition is
appropriate for long-term storage of supernatants and stock solutions. At −20 ◦ C the degradation rate
in the time range explored is rather significant, but this condition is not expected to remain during
a long time, since crystallization of the solution will avoid the progress of the reaction.
Although the proposed model simplified the decomposition of CA to only one intermediate
product and one decomposition product, it allowed to predict the CA concentration pattern in a rather
reliable manner. The model is also able to account for the change in the reaction rate depending on the
initial CA concentrations and supports the hypothesis of degradation as consequence of a susceptibility
to nucleophilic attacks at specific points of the molecule, which also might coincide with hypothetical
enzyme catalyzed reactions at specific conditions.
Finally, the CAI chromophore, commonly used for spectrophotometric and HPLC analysis of
CA samples, exhibited lower stability in time than the CA itself, possibly due to the susceptibility
of N-alkyl-imidazoles to hydrolysis in aqueous solutions. Thus, a short time span is recommended
between the derivatization of CA and the chromatographic analysis. For more reliable analysis of
CA samples, after derivatization, the substance shall be conserved at 4 ◦ C until the quantification
is performed. Additionally, a temperature of −80 ◦ C is recommended for long time storage of CA
samples in order to avoid a significant loss of the product.
Author Contributions: Conceptualization, D.G.-R. and R.R.-E.; Data curation, D.G.-R.; Formal analysis, D.G.-R.,
H.R.-M., P.N. and R.R.-E.; Funding acquisition, P.N., S.J. D.G.-R. and R.R.-E.; Investigation, D.G.-R., H.R.-M.,
and S.J.; Methodology, D.G.-R., H.R.-M., S.J. and R.R.-E.; Supervision, H.R.-M., P.N., S.J. and R.R.-E.; Validation,
D.G.-R.; Writing—original draft, D.G.-R.; Writing—review & editing, H.R.-M., P.N., S.J. and R.R.-E.
Funding: The authors kindly acknowledge the support of Departamento Administrativo de Ciencias, Tecnología
e Innovación–COLCENCIAS grant number 111577657246 CT 432-2017.
Acknowledgments: The authors kindly acknowledge Silvia Ochoa of Simulación, Diseño, Control y Optimización
de Procesos-SIDCOP research group in Universidad de Antioquia for her support during this research.
Conflicts of Interest: The authors declare no conflict of interest. The funders had no role in the design of the
study; in the collection, analyses, or interpretation of data; in the writing of the manuscript; or in the decision to
publish the results.
References
1. Ramirez-Malule, H. Bibliometric analysis of global research on clavulanic acid. Antibiotics 2018, 7, 102.
[CrossRef] [PubMed]
2. De Araujo Viana Marques, D.; Feitosa Machado, S.E.; Santos Ebinuma, V.C.; De Albuquerque Lima Duarte, C.;
Converti, A.; Porto, A.L.F. Production of β-lactamase inhibitors by Streptomyces species. Antibiotics
2018, 7, 61.
3. Takahashi, Y.; Nakashima, T. Actinomycetes, an inexhaustible source of naturally occurring antibiotics.
Antibiotics 2018, 7, 45. [CrossRef] [PubMed]
4. Manteca, Á.; Yagüe, P. Streptomyces differentiation in liquid cultures as a trigger of Secondary metabolism.
Antibiotics 2018, 7, 41. [CrossRef] [PubMed]
5. Ser, H.-L.; Law, J.W.-F.; Chaiyakunapruk, N.; Jacob, S.A.; Palanisamy, U.D.; Chan, K.-G.; Goh, B.-H.; Lee, L.-H.
Fermentation conditions that affect clavulanic acid production in Streptomyces clavuligerus: A systematic
review. Front. Microbiol. 2016, 7, 522. [CrossRef] [PubMed]
6. Saudagar, P.S.; Singhal, R.S. Optimization of nutritional requirements and feeding strategies for clavulanic
acid production by Streptomyces clavuligerus. Bioresour. Technol. 2007, 98, 2010–2017. [CrossRef]
7. Bellão, C.; Antonio, T.; Araujo, M.L.G.C.; Badino, A.C. Production of clavulanic acid and cephamycin c
by Streptomyces clavuligerus under different fed-batch conditions. Braz. J. Chem. Eng. 2013, 30, 257–266.
[CrossRef]Antibiotics 2019, 8, 6 13 of 14
8. Teodoro, J.C.; Baptista-Neto, A.; Araujo, M.L.G.C.; Hokka, C.O.; Badino, A.C. Influence of glycerol and
ornithine feeding on clavulanic acid production by Streptomyces clavuligerus. Braz. J. Chem. Eng. 2010, 27,
499–506. [CrossRef]
9. Neto, A.B.; Hirata, D.B.; Cassiano Filho, L.C.M.; Bellão, C.; Badino, A.C.; Hokka, C.O. A study on clavulanic
acid production by Streptomyces clavuligerus in batch, FED-batch and continuous processes. Braz. J.
Chem. Eng. 2005, 22, 557–563. [CrossRef]
10. Bersanetti, P.A.; Almeida, R.M.R.G.; Barboza, M.; Araújo, M.L.G.C.; Hokka, C.O. Kinetic studies on clavulanic
acid degradation. Biochem. Eng. J. 2005, 23, 31–36. [CrossRef]
11. Marques, D.A.V.; Oliveira, R.P.S.; Perego, P.; Porto, A.L.F.; Pessoa, A.; Converti, A. Kinetic and
thermodynamic investigation on clavulanic acid formation and degradation during glycerol fermentation by
Streptomyces DAUFPE 3060. Enzyme Microb. Technol. 2009, 45, 169–173. [CrossRef]
12. Rosa, J.C.; Baptista Neto, A.; Hokka, C.O.; Badino, A.C. Influence of dissolved oxygen and shear conditions
on clavulanic acid production by Streptomyces clavuligerus. Bioprocess Biosyst. Eng. 2005, 27, 99–104.
[CrossRef] [PubMed]
13. Teodoro, J.C.; Baptista-Neto, A.; Cruz-Hernández, I.L.; Hokka, C.O.; Badino, A.C. Influence of feeding
conditions on clavulanic acid production in fed-batch cultivation with medium containing glycerol.
Appl. Microbiol. Biotechnol. 2006, 72, 450–455. [CrossRef] [PubMed]
14. Bushell, M.E.; Kirk, S.; Zhao, H.; Avignone-rossa, C.A. Manipulation of the physiology of clavulanic acid
biosynthesis with the aid of metabolic flux analysis. Enzyme Microb. Technol. 2006, 39, 149–157. [CrossRef]
15. Cerri, M.O.; Badino, A.C. Shear conditions in clavulanic acid production by Streptomyces clavuligerus in
stirred tank and airlift bioreactors. Bioprocess Biosyst. Eng. 2012, 35, 977–984. [CrossRef] [PubMed]
16. Costa, C.L.L.; Badino, A.C. Production of clavulanic acid by Streptomyces clavuligerus in batch cultures
without and with glycerol pulses under different temperature conditions. Biochem. Eng. J. 2012, 69, 1–7.
[CrossRef]
17. Carvalho, V.; Brandão, J.F.; Brandão, R.; Rangel-yagui, C.O.; Couto, J.A.; Converti, A.; Pessoa, A. Stability
of clavulanic acid under variable pH, ionic strength and temperature conditions. A new kinetic approach.
Biochem. Eng. J. 2009, 45, 89–93.
18. Ishida, K.; Hung, T.V.; Lee, H.C.; Liou, K.K.; Shin, C.H.; Yoon, Y.J.; Sohng, J.K. Degradation of clavulanic
Acid During the cultivation of Streptomyces clavuligerus; Instability of clavulanic Acid by Metabolites and
Proteins from the Strain. J. Microbiol. Biotechnol. 2006, 16, 590–596.
19. Brethauer, S.; Held, M.; Panke, S. Clavulanic acid decomposition is catalyzed by the compound itself and by
its decomposition products. J. Pharm. Sci. 2008, 97, 3451–3455. [CrossRef]
20. Roubos, J.A.; Krabben, P.; De Laat, W.; Heijnen, J.J. Clavulanic acid degradation in Streptomyces clavuligerus
fed-batch cultivations. Biotechnol. Prog. 2002, 18, 451–457. [CrossRef]
21. Nickolai, D.J.; Lammel, C.J.; Byford, B.A.; Morris, J.H.; Kaplan, E.B.; Hadley, W.K.; Brooks, G.F. Effects of
storage temperature and pH on the stability of eleven b-lactam antibiotics in MIC trays. J. Clin. Microbiol.
1985, 21, 366–370. [PubMed]
22. Okerman, L.; Van Hende, J.; De Zutter, L. Stability of frozen stock solutions of beta-lactam antibiotics,
cephalosporins, tetracyclines and quinolones used in antibiotic residue screening and antibiotic susceptibility
testing. Anal. Chim. Acta 2007, 586, 284–288. [CrossRef] [PubMed]
23. Vahdat, L.; Sunderland, V.B. Kinetics of amoxicillin and clavulanate degradation alone and in combination
in aqueous solution under frozen conditions. Int. J. Pharm. 2007, 342, 95–104. [CrossRef] [PubMed]
24. Vetráková, L. Study of Processes Associated with Freezing of Aqueous Solutions. Ph.D. Thesis, Masaryk
University, Brno, Czech Republic, 2017.
25. Vahdat, L.; Sunderland, B. The influence of potassium clavulanate on the rate of amoxicillin sodium
degradation in phosphate and acetate buffers in the liquid state. Drug Dev. Ind. Pharm. 2009, 35, 471–479.
[CrossRef] [PubMed]
26. Jerzsele, Á.; Nagy, G. The stability of amoxicillin trihydrate and potassium clavulanate combination in
aqueous solutions. Acta Vet. Hung. 2009, 57, 485–493. [CrossRef]
27. Nur, A.O.; Hassan, A.A.; Gadkariem, E.A.; Osman, Z. Stability of co-amoxiclav reconstituted injectable
solution. Eur. J. Pharm. Med. Res. 2015, 2, 109–123.Antibiotics 2019, 8, 6 14 of 14
28. Haginaka, J.; Yasuda, H.; Uno, T.; Nakagawa, T. Degradation of clavulanic acid in aqueous alkaline solution:
isolation and structural investigation of degradation products. Chem. Pharm. Bull. 1985, 33, 218–224.
[CrossRef]
29. Finn, M.J.; Harris, M.A.; Hunt, E. Studies on the hydrolysis of clavulanic. J. Chem. Soc. Perkin Trans. 1984, 10,
1345–1349. [CrossRef]
30. Zhong, C.; Cao, G.; Jin, X.; Wang, F. Studies on the formation and forming mechanism of the related substance
E in potassium clavulanate production by HPLC-MS/MS. Braz. J. Pharm. Sci. 2014, 50, 391–399. [CrossRef]
31. Soroka, D.; De La Sierra-Gallay, I.L.; Dubée, V.; Triboulet, S.; Van Tilbeurgh, H.; Compain, F.; Ballell, L.;
Barros, D.; Mainardi, J.L.; Hugonnet, J.E.; et al. Hydrolysis of clavulanate by Mycobacterium tuberculosis
β-lactamase BlaC harboring a canonical SDN motif. Antimicrob. Agents Chemother. 2015, 59, AAC-00598.
[CrossRef] [PubMed]
32. Peace, N.; Olubukola, O.; Moshood, A. Stability of reconstituted amoxicillin clavulanate potassium under
simulated in-home storage conditions. J. Appl. Pharm. Sci. 2012, 2, 28–31.
33. Gour-Salin, B.J. Hydrolysis rates of some acetylimidazole derivatives. Can. J. Chem. 1983, 61, 2059–2061.
[CrossRef]
34. Joule, J.A.; Mills, K. 1,3-Azoles: Imidazoles, thiazoles and oxazoles: Reactions and synthesis. In Heterocyclic
Chemistry; John Wiley & Sons, Inc.: Hoboken, NJ, USA, 2010; pp. 461–467. ISBN 978-1-4051-3300-5.
35. Ramirez-malule, H.; Junne, S.; Cruz-bournazou, M.N.; Neubauer, P. Streptomyces clavuligerus shows
a strong association between TCA cycle intermediate accumulation and clavulanic acid biosynthesis.
Appl. Microbiol. Biotechnol. 2018, 102, 4009–4023. [CrossRef] [PubMed]
36. Ramirez-Malule, H.; Junne, S.; López, C.; Zapata, J.; Sáez, A.; Neubauer, P.; Rios-Estepa, R. An improved
HPLC-DAD method for clavulanic acid quantification in fermentation broths of Streptomyces clavuligerus.
J. Pharm. Biomed. Anal. 2016, 120, 241–247. [CrossRef] [PubMed]
© 2019 by the authors. Licensee MDPI, Basel, Switzerland. This article is an open access
article distributed under the terms and conditions of the Creative Commons Attribution
(CC BY) license (http://creativecommons.org/licenses/by/4.0/).You can also read