Geochemical Characterization of Geothermal Spring Waters Occurring in South Part of Gujarat and West Coast Geothermal Province of Maharashtra, India
←
→
Page content transcription
If your browser does not render page correctly, please read the page content below
Geochemical Characterization of Geothermal Spring Waters Occurring in
South Part of Gujarat and West Coast Geothermal Province of Maharashtra,
India
Anirbid Sircar ( anirbid.sircar@spt.pdpu.ac.in )
Pandit Deendayal Petroleum University School of Petroleum Technology
Kriti Yadav
Pandit Deendayal Petroleum University
Namrata Bist
Pandit Deendayal Petroleum University
Hemangi Gaurangbhai Oza
Pandit Deendayal Petroleum University
Research Article
Keywords: Geothermal water, Physiochemical characterization, Tural-Rajwadi hot springs, Saputara geothermal spring, Unai, West Coast Geothermal
Province.
DOI: https://doi.org/10.21203/rs.3.rs-542459/v1
License: This work is licensed under a Creative Commons Attribution 4.0 International License. Read Full License
Page 1/18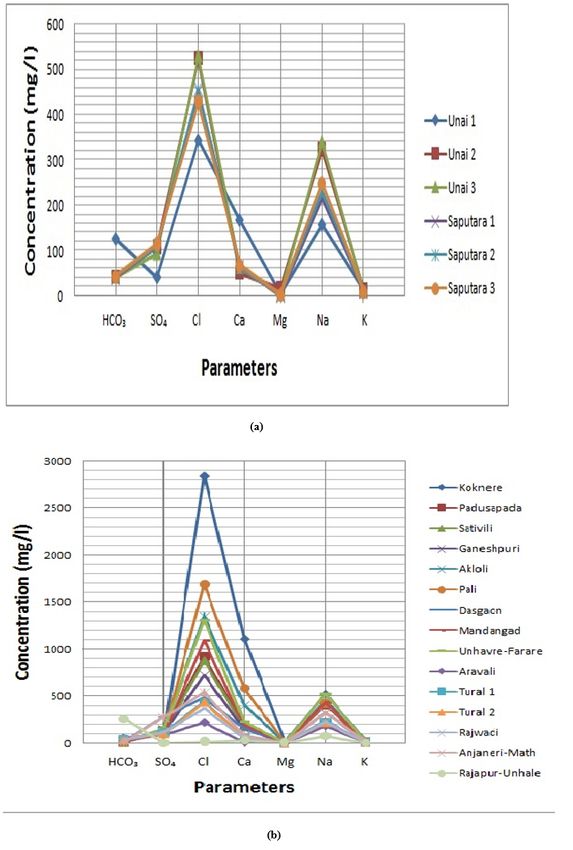
Abstract
Geothermal waters are extensively useful for various purposes such as in industrial plants, societal benefits, irrigation, and domestic consumptions.
However, its physiochemical characterization is very important before using it for any rationale. The main objective of this paper is to identify the hydro-
chemistry of geothermal water which is placed in southern part of Gujarat such as Unai hot springs and Saputara geothermal springs, and west coast
geothermal province (WCGP) like Tural-Rajwadi group of hot springs. The standard methods were used to carry out the analysis of geothermal water. Piper,
Stiff, Gibbs, Extended Durov, and Wilcox diagrams have been plotted to categorize water samples in facies. Spatial distribution curves have also been
plotted for geothermal regions of Gujarat and Maharashtra. The geochemistry of groundwater is influenced by the presence of most important ions like
Na+, Ca2+, Mg2+, K+, Cl-, HCO3-, and SO42-. Geothermal spring of Unai contains high TDS concentration around 1000 mg/l thus it cannot be used for
drinking purposes but it can be utilized for domestic, balneology, and industrial purposes. However, after desalination this water can be utilized for drinking
purposes. In Tural-Rajwadi hot springs TDS concentration was > 900 mg/l and pH range was between7-8 hence it can be used for domestic and industrial
purposes. The temperature range of Tural-Rajwadi geothermal hot spring is 55-65°C which is very useful for milk pasteurization, industrial operations,
space heating, balneology facilities like greenhouses and aquaculture ponds, and domestic purposes.

1. Introduction
As geothermal energy is very clean and having a low maintenance cost it is being utilized as another energy source across the world. The earth’s interior
contained geothermal energy and it apparent in several forms, varied from a higher geothermal gradient to hot springs, fumaroles and volcanoes (Monterio
et al. 2019). Geothermal water is very essential natural resource which can be used for various purposes such as domestic consumptions, industrial
operations, irrigation, and therapeutic facilities (Yadav et al. 2021). In India many geothermal fields have been recognized, among them few are having a
high potential and some are having a medium to low potential. Around 300 hot springs have been observed across India, which occurred due to the
presence of diverse tectonic elements like shear zones and fault planes. In 1991 many geothermal Regions identified by GSI they are Himalayan
Geothermal Region, Andaman-Nicobar Island Region, West Coast Region, Cambay Graben Region, Son-Narmada-Tapi Region, Aravalli Region, Godavari
and Mahanadi Region, and South Indian Cratonic Region (Monterio et al. 2019). Geothermal provinces of India are as shown in Fig. 1.

Among all these geothermal regions, Cambay Graben Region (latitudes 21° 00’ and 25° 00’ N and longitudes 71° 30’ and 73° 30’ E) in Southern part of
Gujarat and West Coast Geothermal Province (WCGP) (19° 42’ 43’’N-72° 50’ 55’’E to 16° 38’ 44’’N-73° 31’ 52’’E) of Maharashtra are the most potential
geothermal fields (Low et al. 2020). The hot springs at Unai is located in southern part of Gujarat. In the southern part of Gujarat, the geological
developments vary from Cretaceous to Holocene (Shah et al. 2019b). The pH values of 7.5–8.5 were detected in water samples from the hot springs of
Unai that reveals the alkaline nature of water. Amusingly, these hot springs were having temperature values between 51 to 56°C hence it can be used for
industrial operations, societal benefits, and domestic consumptions. The TDS concentration of 900–1000 mg/l was observed in hot springs of Unai
(Yadav et al. 2021). Saputara (20⁰34’47’’ N-73⁰44’48’’ E) is placed in Western Ghats and it is a part of Dang district in Gujarat. Detailed geochemical
analysis of thermal springs of Saputara has been carried out in this study. Physico-chemical parameters of thermal spring water of Saputara region is
similar to thermal spring water of Unai.

In West Coast Geothermal Province (WCGP) above sixty thermal springs are available at eighteen locations, containing temperatures between 40 to 72° C.
These thermal springs are passing through the Palghar, Raigad, and Ratnagiri district of Maharashtra and they are covering up the linear distance of
around 350 km. Even though these thermal springs are issuing through the 65 Ma Deccan Volcanic Province (DVP), the major ion chemistry point out the
impact of underlying formations that superimpose the Precambrian granite-gneiss (Chandrasekhar et al. 2018). These thermal waters are having lower
concentration of Mg+, K+, and HCO3− and having enhanced concentration of Ca2+, Na+, and Cl−. In this region Tural-Rajwadi cluster of hot springs has
gained more attention due to high temperature potential (50-61.5°C) and medium TDS concentration (> 900 mg/l).The discharge rate of Tural-Rajwadi
group of hot springs was observed around 5 lps and it was dispersed over an area of ~ 1.5 km2 (Low et al. 2020).This group of hot springs is regulated by
dykes, shear zones, fractures, and the NNW-SSE trending lineaments. Tural-Rajwadi hot spring water can be utilized for societal benefits, industrial
applications, and domestic consumptions.

In developing areas of Maharashtra and south Gujarat very few facilities of electricity, irrigation water, and domestic water are accessible to the people due
to lack of physicochemical analysis of the thermal spring waters located in this regions. In order to overcome this problem the main objective of this study
is to perform the hydro-geochemical analysis of these thermal spring waters as highlighted by circle in Fig. 1 After performing this study use of this
thermal spring water can be enhanced. Various plots such as Gibbs, Pipper, Stiff, and Durov have been plotted in this study. During the hydro-geochemical
analyses of water, the physicochemical and geological assessments were of enormous importance because they disclosed the relationship between
chemical factors, water type, and geology of the area (Jahangiry Fard et al. 2019). The geochemical studies reveal the origin of geothermal water. The
chemistry of the geothermal fluids is largely dependent on the reservoir temperature, type of reservoir rock, mixing processes, multiple fluid origin, altitude
of the infiltration basin, and underground travel time (Shah et al. 2021). A range of impurities dissolve in it while water is transport. Many fine particles flow
with water through many procedures such as weathering, microbe decay, soil leaching etc. (Rahimi et al. 2019).

2 Geological Setting
2.1 Southern Part of Gujarat

                                                                          Page 2/18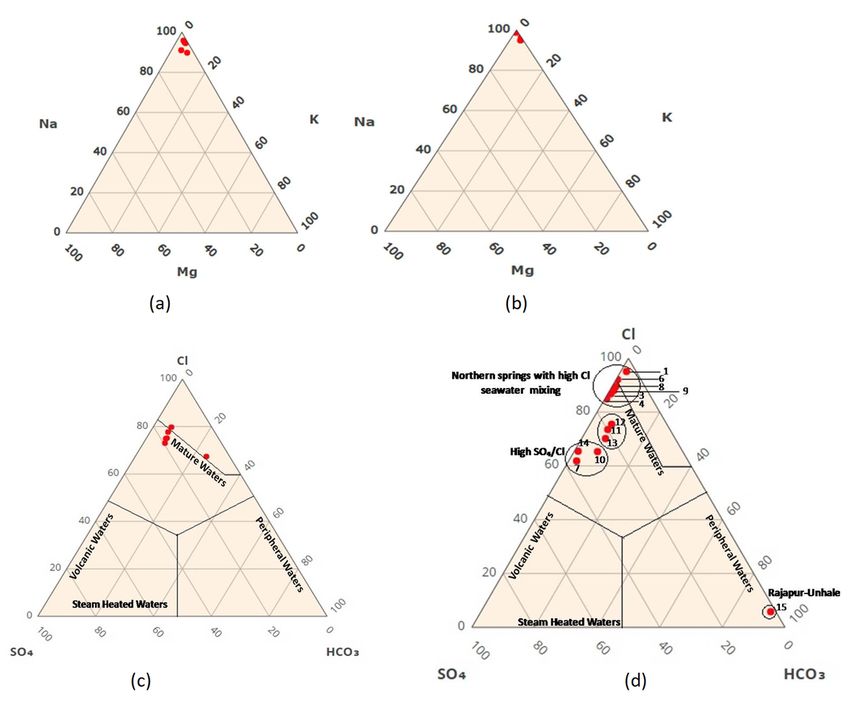
In Gujarat, 22 thermal regions are present containing 17 thermal springs that extend from Archean to Quaternary in attribution within the Cambay Basin as
its main tectonic structure. Unai is the most important geothermal field that is placed in southern part of Gujarat (Sircar et al. 2015). It is 100 km away from
the Cambay Basin. The surrounding areas are having the elevation of 10 to 55 m. This area is mostly covered by dense forest and small hillocks. This
region is largely shielded by the thick Deccan trap of Late Cretaceous to Early Eocene age (Biswas 1987). The whole area of Saputara is also a part of
Deccan Trap. This region shows rugged and terraced topography with plane peaked conical hills, small plateau and steep side narrow valleys. Basaltic
lava flows are surrounded by black clayey to loamy soil. Its width is around a meter (Gupta, 2014).

South Gujarat has developed with the fragment of the Gondwanaland. Throughout early Cretaceous sedimentation and volcanism have initiated with the
marine transgression beside that the Narmada geofracture offered grow to the equivalents of Bagh beds (Yadav and Sircar 2019). Succeeding procedures
contained Deccan volcanism and evolution of the cambay basin. Quaternary deposits contained alluvial accumulations and coastal marine deposits
(Sircar 2017). The Narmada-Son Lineament comprised of Unai hot spring and it separates the Indian shield into two parts (Shah et al. 2019c). The Deccan
lava flows is one part that is prevailed in the western part of Narmada-Son Lineament. These basaltic lava flows of the Deccan Trap compose the main
rock formation of the southern part of Gujarat (Sircar et al. 2015). These trappous rocks contain horizontal lava flows. This trap appears flat-topped hills
because of deviation in the hardness of the dissimilar flows. These traps achieve their highest altitude close to the border of Gujarat and Maharashtra, i.e.
Dang area (Rao et al. 2012).Various dark grey basalts are available in Lava-flows, quite frequently amygdaloidal and porphyritic. In the subsurface there is
also a possibility of presence of hard rock. In Saputara (Dang district Gujarat) different elements of basaltic lava flows form the main aquifer system. In
pheratic condition ground water occurs. In this terrain weathered and fractured volcanic rocks are present in unconfined aquifer. There is a high variation in
the areal extent and thickness of weathered mantle. The southern part of the region is criss-crossed by dykes that regulate the transfer of groundwater in
the development.

2.2 West Coast Geothermal Province (WCGP)
The Deccan Volcanic Province (DVP) of West Central India is pointed by three main tectonic zones they are Narmada-Son rift, the West Coast zone, and the
Cambay rift. These regions are tectonically disordered spots of fracture zones, dyke swarms, and hot springs. The DVP comprising of lava flows of various
thickness (~ 40–100 m) and it imbricate the pre-Cambrian basement of the Indian subcontinent (Shah et al. 2019b). Inception of DVP is ascribed varyingly
to the magma eruption structured by the melting of a mantle plume, lithospheric plate tectonic processes, and effect of huge extraterrestrial bodies. The
hot springs located in West Coast Geothermal Province of Maharashtra, India visible in hard rock of Deccan basalt land with meager alluvial shield. It is
considered that the real hot waters are released from the margins of dykes, intense fractures, and shears (Rao et al. 2015).

In the Tural-Rajwadi group of hot springs region there are five lava flows on the surface and six lava flows in a bore well at Rajwadi (Monterio et al. 2019).
These six lava flows have been recognized based on their internal structure, textural variations, vesiculation and presence of glassy rinds. Vesicle and joint
fillings within the lava flows expose peculiar assemblage of calcite, nontronite, clinopitolite, stilbite, apophylite, cristobalite, etc. it indic this signifying
mineralization correlated to flowing hot geothermal fluids (Pujari, 2014). A main portion of the Tural-Rajwadi region is engrossed by valleys with hilly
region and a wide plateau in the north-east, eastern, and south-eastern parts. There are two major streams drain the area. In a north-south direction, the
Turalnala flows and Rajwadi stream transfer from east to west. The Rajwadi stream is described by short rectilinear stream fragments. Bedrock contains
the basaltic lava flows and most of the steams cut through this bedrock.

3 Sampling And Analytical Techniques
3.1 Sampling Method
Thermal spring water and ground water samples were collected from various locations in Southern Part of Gujarat and West Coast Geothermal Province
(WCGP) for lab analysis. Giggenbach and Goguel, 1989 had mentioned sampling method which was adopted for the sampling during this study. After
pumping of 20 min samples were collected from the wells in order to avoid non representative sample and polluted water. Two bottles of 1-l samples were
collected from each sampling site. Out of two bottles in one bottle filtered sample (with acetate cellulose filter paper having pore size of 0.45 µm) was
filled. The sample bottle was rinsed three times with filtered water before the filtered sample was collected. After that this filtered water samples were
acidified with HNO3 (Merck 65% purity). The second bottle which is filled with the unfiltered water sample was initially acidified and then filtered in lab.
These bottles were then sealed with parafilm and transferred to our lab for further analysis. In order to determine anion concentrations (HCO3−, Cl−, SO42−,
F−) unfiltered and unacidified samples were also collected in 1-l of HDPE bottles.

3.2 Analytical Techniques
Physical parameters like electrical conductivity (EC), temperature, and pH were determined in the site immediately after sampling by using Orion 4-Star
meter. The major ion concentrations like Chloride, Calcium, Magnesium, Sulphate, Fluorides, Bicarbonates, and Carbonates were determined by standard
APHA methods (Rhodes 1980). Sodium and potassium were analyzed by means of Flame photometric and EDTA methods (Armijo 2012). Total Dissolved
Solids (TDS) was determined by gravimetric method. The sources of dissolved components in water can be understood by piper graphic method. The
fundamental principal of this method is that in water cations and anions are usually in chemical equilibrium. The sodium percentage (%Na) and electrical
conductivity (EC) of the water were identified by Wilcox and Wilcox Log method. Percentage of sodium has been calculated by the Eq. 1 as given below in
meq/L,

                                                                           Page 3/18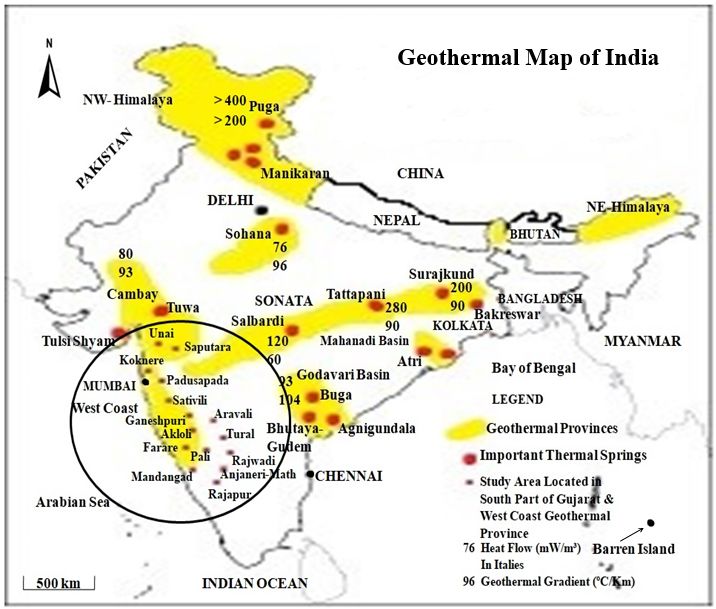
Following Eq. 2 was used to determine the Sodium Adsorption Ratio (SAR) in meq/L,

Cation and anion concentrations in geothermal water from different locations of South Part of Gujarat and West Coast Geothermal Province (WCGP) are
as shown in Table 1 and Table 2, respectively.

                                                                      Table 1
 Physico-chemical parameters and major ion concentration in geothermal spring water from different sites in West Coast Geothermal Province (WCGP) of
                                                  Maharashtra, India (Chandrasekhar et al. 2018)
 Sr.No.    Location      Temp   pH      TDS     Cl−    SO42−    F−     Conductivity   Na+     K+      Ca2+     Mg2+     CO32−        HCO3−    Salinity
                         (⁰C)
                                                                       (µS/cm)
                                                                                                                        Hardness

 1         Unai 1        51.3   8.38    998     345    41.17    2.3    1475           158     13      168.34   5        260          126      623

 2         Unai 2        55     7.86    1190    525    108.8    8      1840           324     15      52       17       84           42       948

 3         Unai 3        56     8.12    1114    530    92.65    8.4    1662           340     10      64       4.86     96           42       957

 4         Saputara      57     7.5     950     450    110      2.5    1500           215     9.8     65       1.2      98           41       950
           1

 5         Saputara      59     8.1     958     456    108      4.2    1490           230     10.5    60       2.8      90           43       960
           2

 6         Saputara      61     8.3     940     430    115      6.6    1530           250     9.6     67       3.5      94           44       955
           3

 All values in mg/l except specified

Table 2: Physico-chemical parameters and major ion concentration in geothermal spring water from different sites in West Coast Geothermal Province
(WCGP) of Maharashtra, India (Chandrasekhar et al. 2018)

                Sr.No     Location       Temp pH Conductivity(μS/cm) TDS               Na+ K+        Ca2+    Mg2+ Cl-     HCO3- SO42-
                                         (°C)
                     1    Koknere        44   7.80   7340            4698              520    22.6   1106    6.1  2842       55    92
                     2    Padusapada     43   8.69   2872            1838              409    17.8   193     0.1  925        5     136
                     3    Sativili       57   8.73   2881            1844              421    18.3   175     0.04 875        10    123
                     4    Ganeshpuri     60   8.60   2332            1492              322    14.0   155     0.1  725        5     124
                     5    Akloli         50   8.56   3910            2502              448    19.5   402     0.1  1345       15    148
                     6    Pali           48   6.54   4730            3027              427    18.6   582     0.5  1690       10    136
                     7    Dasgaon        45   6.93   1858            1189              231    10.1   152     0.1  486        20    280
                     8    Mandangad      55    7.98  2979            1907              430    18.7   185     0.3  1090       15    111
                     9    Unhavre-Farare 72    7.68  3560            2278              521    22.7   223     0.3  1305       20    157
                    10    Aravali         44   8.76  863             552               182    6.60   12.7    <    218        25    90.9
                    11    Tural 1         65   7.67  1527            977               227    9.86   63.1    1.0  441        40    119
                    12    Tural 2         53    7.8  1466            938               220    9.57   62.5    0.3  437        40    102
                    13    Rajwadi         55    8.2  1494            956               224    9.74   58.3    0.5  369        40    117
                    14    Anjaneri-Math 40      8.64 2037            1304              324    14.1   84.2    0.1 540         10    275
                    15    Rajapur-Unhale 43     7.54 524             335               72.4   3.2    26.6    7.0 16.3        260   4.72

All values in mg/l except specified
< : Not detected.

4 Results And Discussion
4.1 Water Quality Specification
4.1.1 Hydrogeochemistry
The geothermal water from Unai and Saputara is slightly alkaline in nature as its pH ranges between 7.5–8.38 (Table 1). The pH value range of geothermal
water from various locations of West Coast Geothermal Province (WCGP) is 6.5–8.7 which is also moderately alkaline in nature (Table 2). Temperature
range of geothermal water from Unai and Saputara is 51–61°C. It does not show any major deviation, temperature varies within a range of 1–10°C for all

                                                                      Page 4/18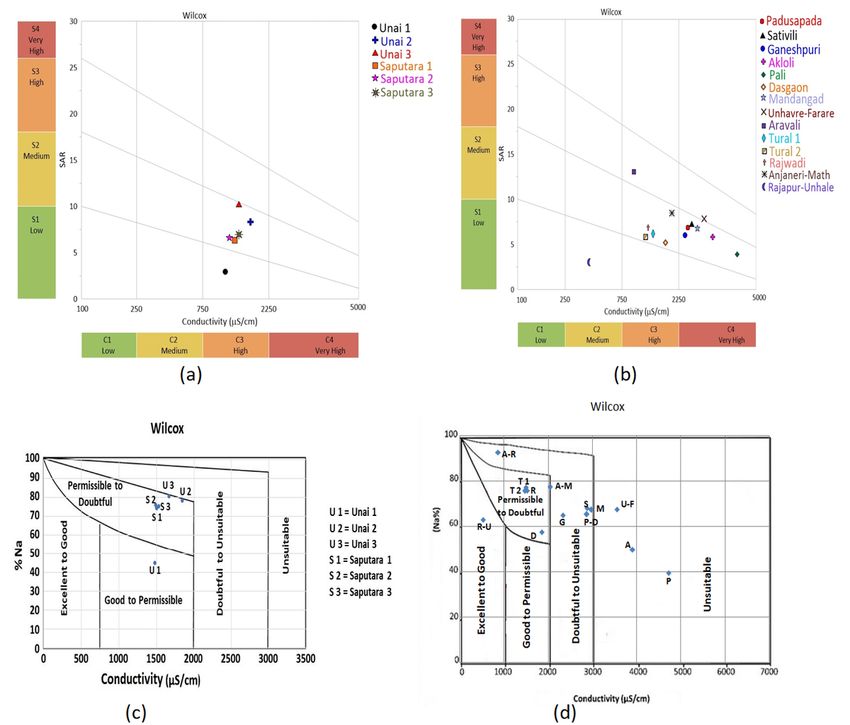
six thermal springs. However, temperature of geothermal water from various locations of WCGP varies from 40–72°C which indicates a significant
variation. A total Dissolved Solids (TDS) concentration of geothermal water from Unai and Saputara ranges from 940 to 1190 mg/l. In geothermal water of
WCGP, Total Dissolved Solids (TDS) concentrations varied from 335–4698 mg/l which is very high. Permissible limit for TDS in absence of any alternate
source is 2000 mg/l (BIS 2012). But water having TDS concentration higher than 900 mg/l is less acceptable for drinking. Therefore, after desalination this
water will be drinkable and it will also be useful for other societal and industrial purposes. In Unai and Saputara geothermal spring water chloride
concentrations varies from 345 to 530 mg/l which is due to the dilutions of deep thermal water. The chloride concentration in geothermal water of WCGP is
varied from 16.3 to 2842 mg/l as shown in Table 2. This is because of interaction of water with saline constituents. The sulfur content of spring water of
Unai and Saputara is ranged from moderate to high 41–115 mg/l which indicates combination of volcanic gases with the thermal waters (Zimik et al.
2017). In thermal water of WCGP the sulfur concentration is 4.72 to 280 mg/l which shows dissolution of sulfur-containing minerals. High chloride
concentration is damaging for metallic pipes, structure, and growing plants as well. It is observed that high sulfur content can cause plant aberration and
can have injurious effects on plant nutrition. High sulfur concentration can cause corrosion of pipes. Sodium concentration in spring water of Unai and
Saputara is ranging from 158 to 340 mg/l and in thermal water of WCGP is varies from 72.4 to 521 mg/l. It shows that water is passing in deep and it
might be a high enthalpy geothermal reservoir (Shah et al. 2019a). In Unai and Saputara geothermal water, sodium and chloride concentrations are quite
high in compare to calcium, magnesium, and potassium. Bicarbonate concentration varies between 41 to 126 mg/l. Geothermal water in Unai and
Saputara indicates salinity between 623 to 960 mg/l which is low to moderate saline. In case of WCGP, sodium and chloride concentrations are high as
well and calcium, magnesium, potassium concentrations are less. This is due to contact of basalt with sea water at high temperatures (Chandrasekhar et
al. 2018). In koknere, the Na/Cl ratio is 0.1829697 which is < 1 and it shows that these dissolve salts might be of marine origin like fossil seawater,
dissolution of marine evaporites, and deep motion of modern seawater. Low concentration of carbonate and bicarbonate in thermal water of Unai and
Saputara indicate that from deeper levels water has upsurged. It is affected by the development water chemistry from the deeper grainy layer below the
trappean flows (Sharma 2013). For drinking water, the permissible limit of fluoride is 1.5 mg/l and in Unai and Saputara spring water high concentration of
fluoride has been observed i.e., 2.3 to 8.4 mg/l. It makes water unfit for drinking purposes because high fluoride concentration can cause diseases like
fluorosis. Fluoride concentration beyond 4 mg/l could be hazardous (BIS 2012). This high concentration is due to the contact of water with subsurface
mica and apatite bearing rocks (WHO 2004). It can be considered that higher flow gradients which heat the water is being created by tectonic movement
and mantle upliftment this water is upsurge back to the surface as it reaches its boiling temperature (Sircar et al. 2015).

4.2 Hydrochemical facies
Areal distribution and Hydrochemical evolution can be understood by plotting graphs of groundwater main dissolved components.

4.2.1 Piper plot
Piper 1944 had proposed one tri-linear plotting method which is the most widely utilized method for studying geochemical facies of groundwater. This plot
allows clustering of data points to show samples which have same constitutions (Sankaran et al. 2015). The diamond plot is at the center and it is merged
by two tri-linear plots that are on the two sides of the diamond. On the basis of supremacy in ion concentration dissimilar quadrants of diamond show the
dissimilar kind of water as shown in Fig. 2a. Figure 2a shows the depiction of the results obtained from Unai and Saputara on the piper diagram. From
figure it can be seen that U2, U3, and S 2 fall in Sodium Chloride water region while U1, S 1, and S 3 come under Calcium Sulphate supremacy water region.
Figure 2b represents the piper diagram of WCGP Maharashtra, India. In WCGP, Koknere, Unhavre-Farare, Akloli, Mandangad, Pali, Sativili, and Padusapada
fall in Sodium Chloride water region while Tural 1, Tural 2, Rajwadi, Anjaneri-Math, Dasgaon, and Ganeshpuri fall in Calcium Sulphate water region.

4.2.2Extended Durov plot
The geochemical process which alters the groundwater quality can be disclosed by Durov (1948) plot (Lloyd and Heathcoat, 1985). In extended Durov plot,
pH and TDS plots are included to the downside and right side of the diagram. In Durov diagram there are two tri-linear plots of cations and anions. The
Hydrochemical process such as dissolution or precipitation and type of water like NaCl or CaCO3 will be identify by point of intersection of lines from tri-
linear plots of the similar water sample in the binary plot. In Unai and Saputara, Higher concentration of Ca and HCO3− + CO32− and lower concentration of
NaCl was observed in U1, S 1, and S 3 in comparison of U2, U3, and S 2as shown in Fig. 3a. Higher concentration of Ca and HCO3− was observed in Koknere
and Rajpur-Unhale compare to other regions in WCGP. In Unhavre-Farare NaCl concentration is quite high which is represented in Fig. 3b. Piper and
Extended Durov plots are showing similar conditions of cations and anions in both regions but there are many other features which can affect the
geochemistry of groundwater hence several other plots and graphs should be combined to find the conclusion.
4.2.3 Schoeller plot
The semi-logarithmic illustration of the concentrations of major ionic constituents present in the water is known as a Schoeller diagram (Schoeller, 1961).
The anions and cations present in the water samples have taken on the X-axis and their concentrations have been plotted on Y-axis for all the samples.
Different ions present in various samples can be compared with the help of this plot. From Fig. 4a it can be seen that U2 and U3 are having great similarity
and U1 is different from other two. S 1, S 2, and S 3 are having almost similar pattern. In all the samples supremacy of Na + K cations and Cl anions is there.
Figure 4b represents the major ion concentration present in the water sample from WCGP. In Koknere, dominance of Na + Ca cation and Cl anion were
observed.

4.2.4 Stiff Diagram

                                                                          Page 5/18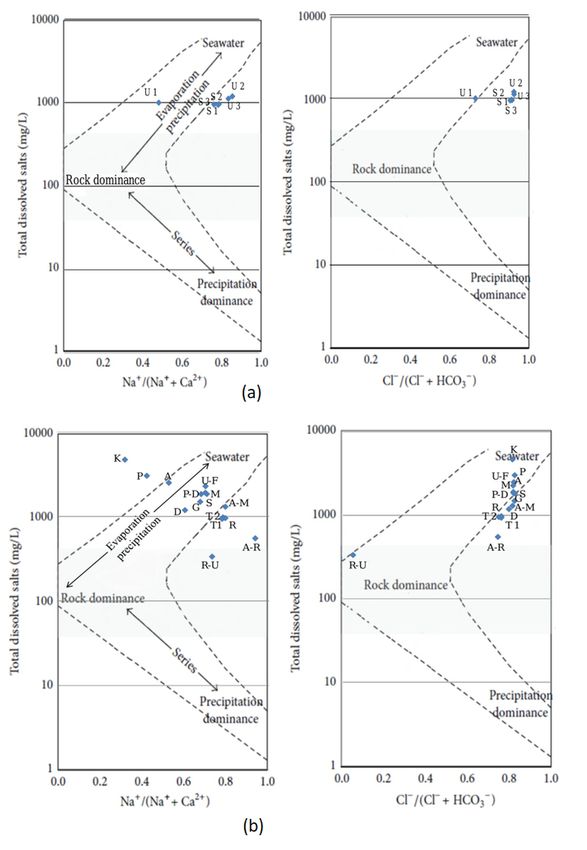
The chemical analyses of geothermal water can be done by graphical representation which is defined as a stiff diagram. Hydrogeologists and
geochemists are widely use stiff diagram to depict the main ion composition of a water sample. In this diagram one vertical zero axis and four similar
horizontal axis are plotted. These four horizontal axis expanding on either side of a vertical axis which generates a polygonal shape (Stiff 1951). The ion
concentrations have taken in meq/l. In the stiff diagram, left side of the zero axis cations have plotted and right side of the zero axis anions have plotted.
Comparison of ion concentrations present in water samples from the different regions can be done by plotting stiff diagram. Stiff diagram for South Part
of Gujarat and West Coast Geothermal Province is as shown ion Fig. 5.

4.2.5 Gibbs plot
With the help of Gibbs diagram water chemistry and its chemical formation from the consequent aquifers such as evaporation rate, precipitated chemistry,
and rock form chemistry can be understood (Ronald J 1970). In order to understand nature of geothermal water chemistry from different regions of Gujarat
and Maharashtra, Gibbs difference Cl−/(Cl− + HCO3−) i.e. anions and Gibbs variance Na+/(Na+ + Ca2+) i.e. cations of water samples have been plotted
discretely against respective values of TDS in mg/l. From TDS Vs Na+/(Na+ + Ca2+) (Fig. 6a) it can be observed that U2 and U3 have shown evaporation
dominance and U1, S 1, S 2, and S 3 have shown rock dominance in geothermal water composition. TDS Vs Cl−/(Cl− + HCO3−) is similar to the TDS Vs
Na+/(Na+ + Ca2+). In the case of WCGP, TDS Vs Na+/(Na+ + Ca2+) (Fig. 6b) has indicated that Koknere, Pali, Akloli, Padusapada, Unhavre-Farare,
Mandangad, Dasgaon, Ganeshpuri, Sativili, and Anjaneri-Math have shown evaporation dominance and Tural 1, Tural 2, Rajwadi, Aravali, and Rajpur-
Unhale have shown rock dominance in geothermal water composition. TDS Vs Cl−/(Cl− + HCO3−) is almost similar to the TDS Vs Na+/(Na+ + Ca2+) except
Dasgaon. In this plot Dasgaon has shown rock dominance. In the case of alluvial plains, the groundwater chemistry is majorly dominated by rock-water
interference occurrence (Alam 2014). From Fig. 6a and Fig. 6 bit can be observed that none of the water samples have precipitation dominance.
Precipitation dominance indicates that samples have taken during monsoon. Geothermal water of Unai and Saputara is having TDS concentration near
1000 mg/l thus it can be use for societal purposes while water from WCGP is having high concentration of TDS > 1000 mg/l which is not suitable for any
purposes. After desalination of this water it can be used for various purposes like drinking, irrigation, domestic, and industrial.
4.2.6 Ternary plot
The proportion of major ions presented in geothermal spring water is represented by Ternary diagram (Giggenbach, 1991). Two different Ternary diagrams
of cations and anions have plotted with a view to differentiate fluids from various sources. Ternary diagram for cation is combining Na-K with K-Mg. In
Unai and Saputara, all locations are having water with lower concentration of Mg. All the points fall on the Na-K line since there is very less concentration
of Mg is present as shown in Fig. 7a. Similarly, in WCGP concentration of Mg is very less and Na and K concentrations are comparatively very high as
depicted in Fig. 7b. Therefore, all the points are fall on the Na-K line. Figure 7c represents the major anion concentration present in the water sample from
Unai and Saputara. This type of ternary plot is used to categorize the forms of geothermal water of a field under study. There are four types of geothermal
water: Mature water, volcanic water, steam heated water, and peripheral water which can be discriminated from the ternary diagram.U1, U2, U3, S1, S 2, and
S 3come under Cl rich domain of geothermal water and which shows that it is mature water. All the points are fall on the Cl-SO4 line because HCO3
concentration is comparatively low. In geothermal water of U2 andU3 supremacy of SO4 over HCO3 as compared to U1 indicates that geothermal water
may have been blended with marginal steam heated water or it may be due to interaction of water with sulfur bearing environment during water-rock
interaction. High chloride content of water is suggesting influence of seawater intermixing with thermal fluids. Distribution of anion concentration in
geothermal water of WCGP is as shown in Fig. 7d.Due to the high Cl concentration, most of the thermal spring waters plot near the chloride apex. Spring
waters of Dasgaon, Anjneri-Math, and Aravali are having high SO4/Cl ratios and hence it is somewhat shifted towards the SO4 field indicates dissolution of
sulfur bearing minerals. Thermal springs (1, 6, 8,9,3,and 4 from Table 2) on the northern part of the study area drop on the Cl-SO4 line which has shown
high concentration of Cl due to seawater mixing. Thermal springs (10, 14, 13, and 11 from Table 2) pointing towards two different saline sources. In WCGP,
all locations come under Cl rich domain of geothermal water and which shows that it is mature water except Rajpur-Unhale (15 from Table 2). It falls on
the Cl-HCO3 line and it is peripheral water as shown in the Fig. 7d.

4.2.7 Wilcox diagram
Groundwater suitability for irrigation purposes can be analyzed very effectively with the help of Wilcox diagram (Wilcox, 1955). Percentage of sodium
(%Na) Vs. Conductivity graph has been plotted for geothermal water samples from Unai and Saputara as shown in Fig. 8c. Geothermal water from Unai 1
has fallen under the range of good to permissible and Saputara 1, 2, & 3 have fallen under the range of permissible to doubtful. Unai 2 and Unai 3 have
fallen on the border of permissible to doubtful and doubtful to unsuitable as shown in Fig. 8c.Therefore, geothermal water of Unai 1 is suitable for drinking
and irrigation purposes. Water from Saputara 1, 2, & 3 and Unai 2 & 3 are not suitable for drinking but it can be used for irrigation, domestic, and industrial
purposes. No samples from South part of Gujarat have fallen under unsuitable that means geothermal water of this region is suitable for various purposes.
As shown in Fig. 8d Rajapur-Unhale has fallen within the range of excellent to good means it can be directly used for drinking and irrigation purposes. Tural
1, Tural 2, Rajwadi, and Dasgaon have fallen under the range of permissible to doubtful and Aravali, Anjaneri-Math, Ganeshpuri, Sativili, Padusapada, and
Mandangad have come under the range of Doubtful to unsuitable which indicates that it is not suitable for drinking purposes but it can be used for
irrigation. Unhavre-Farare, Akloli, and Pali have fallen within the range of unsuitable (Fig. 8d) and thus water from these regions require pre-treatment
before using it for drinking and irrigation.

In the Wilcox log plot, Sodium Adsorption Ratio (SAR) has plotted on the Y-axis and Conductivity has plotted on the X-axis. The Conductivity has
represented in a log scale. This plot is also helpful in testing suitability of water for irrigation. From Fig. 8ait can be seen that S1, S2, S3, and S4 are sodium
hazard classes and C1, C2, C3, and C4 are salinity hazard classes. Unai 1 has fallen within the range of S1-C3 (Fig. 8a); it shows that it can be used for
drinking and irrigation purposes. All other locations i.e. Unai 2 & 3 and Saputara 1, 2, & 3 have fallen within the range of S2-C3 and it indicates that it is

                                                                           Page 6/18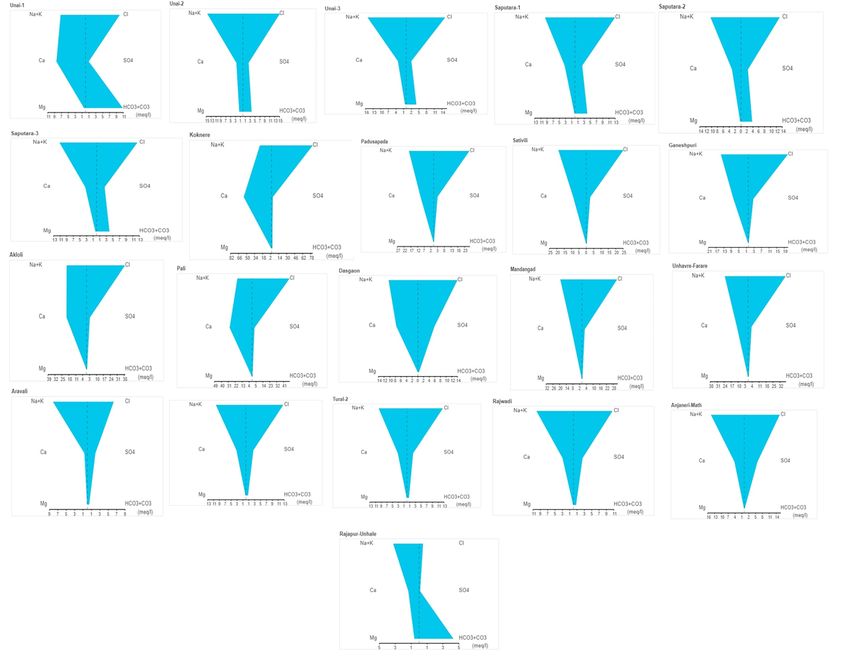
suitable for irrigation, domestic, and industrial purposes but not suitable for drinking purposes. In the case of WCGP, geothermal water of Rajapur-Unhale
has fallen within the range of S1-C2 and which shows that it is suitable for drinking and for agricultural purposes as shown in Fig. 8b. Anjaneri-Math,
Dasgaon, Rajwadi, Tural 1, and Tural 2 have fallen under the range of S2-C3 means it can be used for all other purposes except drinking. Aravali has come
under the range of S3-C3 which is showing that it cannot be used for drinking purposes. Ganeshpuri, Padusapada, Sativili, Akloli, and Pali have fallen
under the range of S2-C4 (Fig. 8b), which indicates that geothermal water of these regions require pre-treatment before using it for various purposes.
Unhavre-Farare has come within the range of S3-C4 (Fig. 8b) which is also very high hence it requires pre-treatment before its use for drinking and
irrigation.
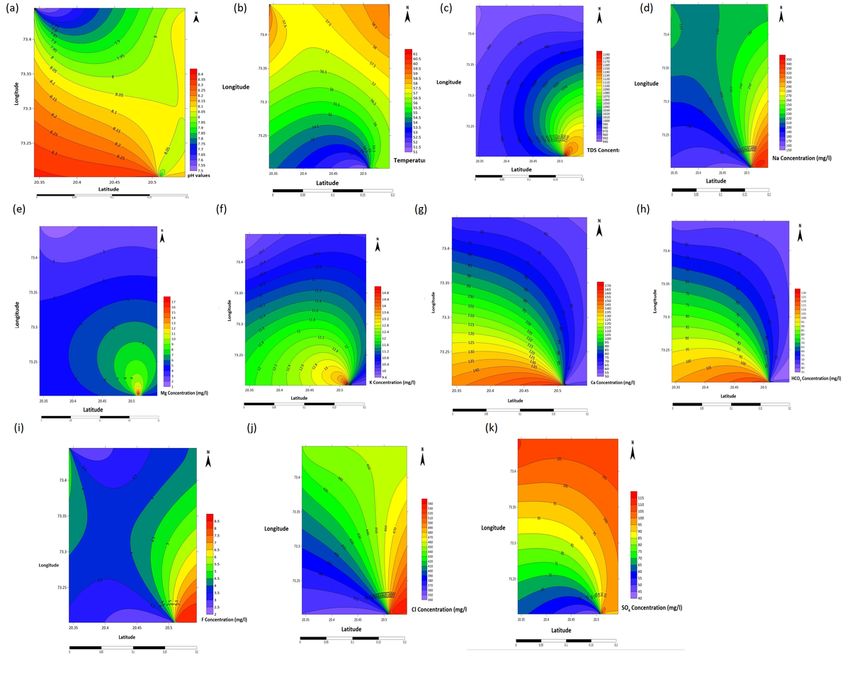
4.2.8 Spatial distribution plot
Spatial distribution curves for various locations in South part of Gujarat and West Coast Geothermal Province are as shown in Figs. 9 and 10, respectively.
5 Conclusion
This study shows that geothermal spring water of both South part of Gujarat and West Coast Geothermal Province is enriched with ions like Sodium,
Potassium, Calcium, Chloride, and Sulphate. The study of geothermal water of Unai and Saputara shows low to moderate Na-Cl content. Geothermal
spring water of Unai 2 and Unai 3 are having high concentration of TDS concentration and it needs to be reducing for utilize these spring waters for
drinking and irrigation. Water from Unai 1 is the most suitable for drinking and irrigation purposes. Water from these regions may be passed through
different dissolution-precipitation processes or contamination from other sources that resulted into an improper evaluation of its chemistry. For WCGP
region it can be said that almost every geothermal spring waters are Na (Ca)-Cl or Ca (Na)-Cl type only few spring waters are Na-Cl (SO4) type. Thermal
spring water of Rajapur-Unhale is only Na-HCO3 type. Spring waters having high salinity are confined to the northern part of the study area. Water from the
northern part is more saline which indicates a deep movement of seawater with the thermal water. Less concentration of magnesium, potassium, and
bicarbonate and high concentration of calcium, sodium, and chloride is a sign of basalt seawater contact at high temperature. Among all the locations in
WCGP, Koknere is having the highest value of TDS concentration which indicates that it requires desalination treatment before using it for drinking,
irrigation and all other purposes. Na/Cl ratio in Koknere is 0.1829697 which is < 1 which indicates that source of these dissolve salts may be from marine
like seawater and deep motion of modern seawater. All the different plots for both of the regions are showing same indication of high ion concentrations
specially Na-Cl. Geothermal water of Unai and Saputara can be utilized directly for various purposes without any treatment but spring water of WCGP
require some pre-treatment before its use for different purposes.
6. Declarations
Funding
Not Applicable
Conflicts of interest
Authors have no conflict of interest
Authors' contributions
AS and KY have prepared the manuscript. NB and HO have worked on the data processing. AS and KY have worked on the interpretation of data.
7. References
1. Alam F (2014) Evaluation of hydrogeochemical parameters of groundwater for suitability of domestic and irrigational purposes: a case study from
central Ganga Plain, India. Arab J Geosci 7:4121–4131. https://doi.org/10.1007/s12517-013-1055-6
2. Armijo CF (2012) Water journeys II. Granada's spas and springs through travellers' and hydrologists' eyes. Solprint, Madrid.
3. BIS ISDWS (2012) Bureau of Indian Standards. New Delhi.
4. Biswas SK (1987) Regional tectonic framework, structure and evolution of the western marginal basins of India. Tectonophysics 135:307–327.
https://doi.org/10.1016/0040-1951(87)90115-6
5. Chandrasekhar T, Minissale A, Vaselli O, et al (2018) Understanding the evolution of thermal fluids along the western continental margin of India using
geochemical and boron isotope signatures. Geothermics 74:197–209. https://doi.org/10.1016/j.geothermics.2018.03.007
6. Giggenbach WF, Goguel RL (1989) Collection and the analysis of the geothermal and volcanic waters and gas discharges. Pentone.
7. Giggenbach WF (1991) Chemical techniques in geothermal exploration. Application of geochemistry in geothermal reservoir development.
8. Gupta BK (2014) Central Ground Water Board, Ministry of Water Resources, Government of India. Centre for Environment Education. Gujarat
Groundwater Brochure.
9. Jahangiry Fard M, Amanipoor H, Battaleb-Looie S, Ghanemi K (2019) Evaluation of effect factors on water quality of Karun River in downstream and
lake of the Gotvand-e-Olya Dam (SW Iran). Appl Water Sci 9:1–14. https://doi.org/10.1007/s13201-019-1040-7
10. Lloyd JW, Heathcote JAA (1985) Natural inorganic hydrochemistry in relation to ground water.
Page 7/18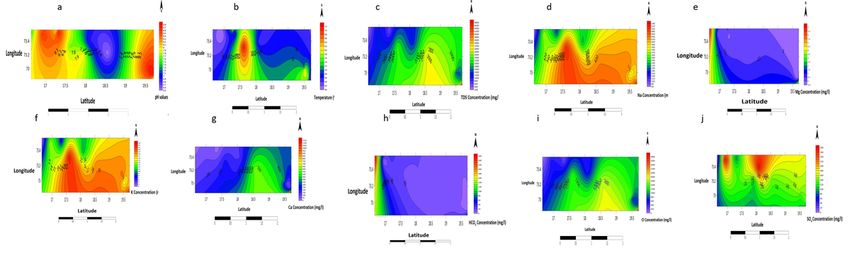
11. Low U, Absar A, Duraiswami R, Singh A (2020) Geophysical exploration of Tural-Rajwadi group of hot springs, West Coast Geothermal Province,
   Maharashtra, India and its implications. Geothermics 88:101874. https://doi.org/10.1016/j.geothermics.2020.101874
12. Monterio AJ, Duraiswami RA, Pujari SJ, et al (2019) Petrophysical variations within the basaltic lava flows from Tural-Rajawadi hot springs, Western
   India and their bearing on the viability of low-enthalpy geothermal systems. IOP Conf Ser Earth Environ Sci 249:. https://doi.org/10.1088/1755-
   1315/249/1/012004
13. Organization mondiale de la santé, WHO—Work programme, Światowa Organizacja            Zdrowia, World Health Organization, WHO, & World Health
   Organisation Staff (2004) Guidelines for drinking-water quality. 3rd edn. Geneva, 1:1-515
14. Piper AM (1944) file:///C:/Users/gaurang bhai/Desktop/GC/stiff1951.pdf. Am Geophys union 914–928
15. Pujari SJ (2014) Subsurface geology, textural variations, and hydrothermal alteration in the basalt from Tural-Rajwadi borehole, West Coast
   geothermal field, India. Doctoral Dissertation, Department of Geology, University of Pune.
16. Rahimi L, Amanipoor H, Battaleb-Looie S (2019) Effect of salinity of irrigation water on soil properties (abadan plain, SW Iran). Geocarto Int 0:1–20.
   https://doi.org/10.1080/10106049.2019.1678678
17. Rao KM, Kumar MR, Rastogi BK (2015) Crust beneath the northwestern Deccan Volcanic Province, India: Evidence for uplift and magmatic
   underplating. J Geophys Res Solid Earth 120:3385–3405. https://doi.org/10.1002/2014JB011819
18. Rao PS, Singh AK, Rao CK (2012) Regional conductance map of Saurashtra and surrounding regions. Current Science 187-193
19. Rhodes DE (1980) APHA, AWWA, WEF. Standard Methods for exa- mination of water and wastewater. 22nd ed. Wa- shington: American Public Health
   Association; 2012, 1360 pp. ISBN 978-087553-013-0 http://www.standardmethods.org/. Library (Lond) s6-II:335
20. Ronald J G (1970) Mechanisms Controlling World Water Chemistry. Science (80- ) 170:1088–1090
21. Sankaran S, Sundararajan N, Khadija S (2015) Geochemical analysis of groundwater samples in the vicinity of lakes and drainage network. J Geol
   Soc India 86:459–467. https://doi.org/10.1007/s12594-015-0333-1
22. Schoeller H (1967) Hydrodynamiquedans le karst. Chroniqued'hydrogeologie 10:7-21
23. Shah B, Kansara B, Shankar J, et al (2019a) Reckoning of water quality for irrigation and drinking purposes in the konkan geothermal provinces,
   Maharashtra, India. Groundw Sustain Dev 9:100247. https://doi.org/10.1016/j.gsd.2019.100247
24. Shah M, Pawar Y, Patel M, et al (2021) Comprehensive hydro-chemistry and geothermal water quality of Konkan, Maharashtra, India for sustainable
   industrial development. Groundw Sustain Dev 12:100518. https://doi.org/10.1016/j.gsd.2020.100518
25. Shah M, Sircar A, Shaikh N, et al (2019b) Comprehensive geochemical/hydrochemical and geo-thermometry analysis of Unai geothermal field, Gujarat,
   India. Acta Geochim 38:145–158. https://doi.org/10.1007/s11631-018-0291-6
26. Shah M, Sircar A, Varsada R, et al (2019c) Assessment of geothermal water quality for industrial and irrigation purposes in the Unai geothermal field,
   Gujarat, India. Groundw Sustain Dev 8:59–68. https://doi.org/10.1016/j.gsd.2018.08.006
27. Sharma N (2013) Physico-chemical characterization of the thermal spring waters occurring in Gujarat, India. CEGE report.
28. Singh HK, Chandrasekharam D, Trupti G, et al (2016) Potential Geothermal Energy Resources of India: A Review. Curr Sustain Energy Reports 3:80–91.
    https://doi.org/10.1007/s40518-016-0054-0
29. Sircar A (2017) Geothermal : Updates OVERVIEW OF GEOTHERMAL SURFACE
30. Sircar A, Shah M, Sahajpal S, et al (2015) Geothermal exploration in Gujarat: case study from Dholera. Geotherm Energy 3:1–25.
    https://doi.org/10.1186/s40517-015-0041-5
31. Stiff HA (1951) The Interpretation of Chemical Water Analysis by Means of Patterns. J Pet Technol 3:15–3. https://doi.org/10.2118/951376-g
32. Wilcox L (1955) Classification and use of irrigation waters. Departmetnt of Agriculture, US.
33. Yadav K, Sircar A (2019) Integrated 2D joint inversion models of gravity, magnetic, and MT for geothermal potentials: a case study from Gujarat, India.
   Model Earth Syst Environ 5:963–983. https://doi.org/10.1007/s40808-019-00582-2
34. Yadav K, Sircar A, Jani D, Bist N, Nirantare A, Mali N, Singh S (2021) Geochemical characterization of geothermal spring waters occuring in Gujarat,
   India. International Journal of Energy and Water Resources 0:1-14
35. Zimik H V., Farooq SH, Prusty P (2017) Geochemical evaluation of thermal springs in Odisha, India. Environ Earth Sci 76:1–12.
   https://doi.org/10.1007/s12665-017-6925-x

Figures

                                                                        Page 8/18
Figure 1
Geothermal provinces of India, showing South part of Gujarat and West Coast province by circle; Geothermal Spring sampling locations; Cross section of
the Deccan flows indicating various configurations and locations of essential thermal springs (Singh et al. 2016) Note: The designations employed and the
presentation of the material on this map do not imply the expression of any opinion whatsoever on the part of Research Square concerning the legal status
of any country, territory, city or area or of its authorities, or concerning the delimitation of its frontiers or boundaries. This map has been provided by the
authors.
Page 9/18Figure 2
(a) Piper Diagram representing concentration of cations and anions in geothermal water of south part of Gujarat, India (Shah et al. 2019b) (b) Piper
Diagram representing concentration of cations and anions in geothermal water of West Coast Geothermal Province, Maharashtra, India (Chandrasekhar et
al. 2018)
Page 10/18Figure 3
(a) Extended Durov Diagram representing concentration of cations, anions, and TDS in geothermal water of south part of Gujarat, India (Shah et al. 2019b)
(b) Extended Durov Diagram representing concentration of cations, anions, and TDS in geothermal water of West Coast Geothermal Province,
Maharashtra, India
Page 11/18Figure 4
(a) Schoeller Diagram representing concentration of ions in geothermal water of south part of Gujarat, India (Shah et al. 2019b) (b) Schoeller Diagram
representing concentration of ions in geothermal water of West Coast Geothermal Province, Maharashtra, India
Page 12/18Figure 5
Representative Stiff Diagram of geothermal spring water of south part of Gujarat (Unai 1) Representative Stiff Diagram of geothermal spring water of
south part of Gujarat (Unai 2) Representative Stiff Diagram of geothermal spring water of south part of Gujarat (Unai 3) Representative Stiff Diagram of
geothermal spring water of south part of Gujarat (Saputara 1) Representative Stiff Diagram of geothermal spring water of south part of Gujarat (Saputara
2) Representative Stiff Diagram of geothermal spring water of south part of Gujarat (Saputara 3) Representative Stiff Diagram of geothermal spring water
of West Coast Geothermal Province, Maharashtra (Koknere) Representative Stiff Diagram of geothermal spring water of West Coast Geothermal Province,
Maharashtra (Padusapada) Representative Stiff Diagram of geothermal spring water of West Coast Geothermal Province, Maharashtra (Sativili)
Representative Stiff Diagram of geothermal spring water of West Coast Geothermal Province, Maharashtra (Ganeshpuri) Representative Stiff Diagram of
geothermal spring water of West Coast Geothermal Province, Maharashtra (Akloli) Representative Stiff Diagram of geothermal spring water of West Coast
Geothermal Province, Maharashtra (Pali) Representative Stiff Diagram of geothermal spring water of West Coast Geothermal Province, Maharashtra
(Dasgaon) Representative Stiff Diagram of geothermal spring water of West Coast Geothermal Province, Maharashtra (Mandangad) Representative Stiff
Diagram of geothermal spring water of West Coast Geothermal Province, Maharashtra (Unhavre-Farare) Representative Stiff Diagram of geothermal spring
water of West Coast Geothermal Province, Maharashtra (Aravali) Representative Stiff Diagram of geothermal spring water of West Coast Geothermal
Province, Maharashtra (Tural-1) Representative Stiff Diagram of geothermal spring water of West Coast Geothermal Province, Maharashtra (Tural-2)
Representative Stiff Diagram of geothermal spring water of West Coast Geothermal Province, Maharashtra (Rajwadi) Representative Stiff Diagram of
geothermal spring water of West Coast Geothermal Province, Maharashtra (Anjaneri-Math) Representative Stiff Diagram of geothermal spring water of
West Coast Geothermal Province, Maharashtra (Rajapur-Unhale)
Page 13/18Figure 6
(a) Gibbs plot TDS vs. Na⁺/(Na⁺ + Ca²⁺) and TDS vs. Clˉ/(Clˉ + HCO₃ˉ) for geothermal water of south part of Gujarat, India (b) Gibbs plot TDS vs. Na⁺/(Na⁺
+ Ca²⁺) and TDS vs. Clˉ/(Clˉ + HCO₃ˉ) for geothermal water of West Coast Geothermal Province, Maharashtra, India
Page 14/18Figure 7
(a) Ternary Diagram representing concentration of cations (Na-Mg-K) in geothermal water of south part of Gujarat, India (Yadav et al. 2021) (b) Ternary
Diagram representing concentrations of cations (Na-Mg-K) in geothermal water of West Coast Geothermal Province, Maharashtra, India (c) Ternary
Diagram representing the concentration of anions (Cl-SO4-HCO3) in geothermal water of south part of Gujarat, India (Yadav et al. 2021) (d) Ternary
Diagram representing concentration of anions (Cl-SO4-HCO3) in geothermal water of West Coast Geothermal Province, Maharashtra, India (Chandrasekhar
et al. 2018)
Page 15/18Figure 8
(a) Wilcox log plot for Southern part of Gujarat (b) Wilcox log plot for West Coast Geothermal Province (c) Wilcox Diagram for South part of Gujarat (d)
Wilcox Diagram for West Coast Geothermal Province
Page 16/18Figure 9
(a) Spatial distribution plot for geothermal spring water parameters Locations as per Table 1 (pH) (b) Spatial distribution plot for geothermal spring water
parameters Locations as per Table 1 (Temperature) (c) Spatial distribution plot for geothermal spring water parameters Locations as per Table 1 (TDS) (d)
Spatial distribution plot for geothermal spring water parameters Locations as per Table 1 (Sodium (Na+) (e) Spatial distribution plot for geothermal spring
water parameters Locations as per Table 1 (Magnesium (Mg2+) ion) (f) Spatial distribution plot for geothermal spring water parameters Locations as per
Table 1 (Potassium (K+) ion) (g) Spatial distribution plot for geothermal spring water parameters Locations as per Table 1 (Calcium (Ca2+) ion) (h) Spatial
distribution plot for geothermal spring water parameters Locations as per Table 1 (Bicarbonate (HCO3⁻) ion) (i) Spatial distribution plot for geothermal
spring water parameters Locations as per Table 1 (Fluoride (F-) ion) (j) Spatial distribution plot for geothermal spring water parameters Locations as per
Table 1 (Chloride (Cl-) ion) (k) Spatial distribution plot for geothermal spring water parameters Locations as per Table 1 (Sulphate (SO42-) ion)
Figure 10
Page 17/18(a) Spatial distribution plot for geothermal spring water parameters Locations as per Table 2 (pH) (b) Spatial distribution plot for geothermal spring water
parameters Locations as per Table 2 (Temperature) (c) Spatial distribution plot for geothermal spring water parameters Locations as per Table 2 (TDS) (d)
Spatial distribution plot for geothermal spring water parameters Locations as per Table 2 (Sodium (Na+) ion) (e) Spatial distribution plot for geothermal
spring water parameters Locations as per Table 2 (Magnesium (Mg2+) ion) (f) Spatial distribution plot for geothermal spring water parameters Locations
as per Table 2 (Potassium (K+) ion) (g) Spatial distribution plot for geothermal spring water parameters Locations as per Table 2 (Calcium (Ca2+) ion) (h)
Spatial distribution plot for geothermal spring water parameters Locations as per Table 2 (Bicarbonate (HCO3⁻) ion) (i) Spatial distribution plot for
geothermal spring water parameters Locations as per Table 2 (Chloride (Cl-) ion) (j) Spatial distribution plot for geothermal spring water parameters
Locations as per Table 2 (Sulphate (SO42-) ion)
Page 18/18You can also read