Total Contributions Approach Consultation 2018 - May to September 2018 - CIPD Ireland
←
→
Page content transcription
If your browser does not render page correctly, please read the page content below
Total Contributions
Approach
Consultation 2018
May to September 2018
1
Contents

    Contents
    Contents
    Introduction										3
    Overview of State Income Supports for Older People				 4
    Current State Pension (Contributory) System					       6
    Pension Rates										9
    Poverty Rates										11
    Gender Gaps										15
    Expansion of the PRSI system								20
    Demographic Change									22
    Alternatives to TCA Considered							24
    Models of TCA										28
    Consultation questions									31
    Question 1 - General Approach							33
    Question 2- Priorities in the TCA formula						        34
    Question 3 – Ensuring Sustainability							35
    Question 4 – Special Arrangements							36
    Appendix 1 – Pen Pictures								38

2
Introduction
Introduction
This paper sets out the background to the forthcoming Total Contributions Approach (TCA)
reform to the State pension system. It sets out-
• the system as it exists now,
• social and gender outcomes under the current system,
• the background to the proposed change to TCA,
• alternatives that were considered by the Government,
• the choices that must be considered in designing the final model applying to people
post 2020, and
• examples of how different people would fare under two TCA options, compared to
the current Yearly Average system.
At the end of this form, stakeholders are asked to reply to a set of questions, indicating
what they consider the key priorities in this reform.
You are asked to return this by Monday, 3rd September 2018 at the latest. This
survey is available online at www.welfare.ie/consultations. Hard copies may be
posted to;
TCA Consultation
Department of Employment Affairs and Social Protection
Pensions Policy Unit
Áras Mhic Dhiarmada
Store Street
Dublin 1
3Reform of the State Pension
Overview of State
Income Supports for
Older People
4Under the State Pension system, a person who has reached state pension age (currently
66) may get a payment under the following categories;
1. State Pension (Contributory) (SPC)
2. State Pension (Non-contributory) (SPNC)
3. Increase for a Qualified Adult (IQA), where a spouse has a State pension*
4. Widow’s, Widower’s or Surviving Civil Partner’s Contributory Pension (WCP)*
*Also available to under 66s, but at a lower rate.
The SPC is not means tested, and is paid from the Social Insurance Fund, which in turn is
financed by current PRSI contributions, on a ‘pay-as-you-go’ basis. Entitlement levels are
largely based on such contributions, although an Invalidity pensioner will qualify at the
full rate upon reaching State pension age, regardless of their PRSI record.
The SPNC is means tested, based on the pensioner’s share of their household means, and
is currently set at just over 95% of the SPC. It ensures that pensioners with the greatest
need have a safety net, and is funded by the taxation system.
An IQA is paid to the adult dependent of a SPC pensioner, and is based on the means of
the Qualified Adult. It is payable at up to 90% of a maximum pension rate.
A Widows Contributory Pension (and equivalent payments for Widowers and surviving
Civil Partners) is based on either the PRSI of the recipient or of their late partner. It is not
means-tested.
The pensioner is paid whichever payment they qualify for, that is most beneficial to them.
In addition to these main pension payments, there are other payments (and increases in
the rate) which are payable to all pensioners including the Household Benefits Package
Electricity/Gas payment of €35 a month. Fuel Allowance is also available, based on a
means-test, and is at a weekly rate of €22.50 for 27 weeks per annum. Those living alone
also receive €9 per week (€11.50 if they satisfy the Fuel Allowance means-test), and there
is a further weekly increase of €10 for pensioners aged 80 or older. Some also qualify for
an Islands Allowance at a rate of €12.70 weekly.
When including means-tested payments, a pensioner living alone effectively receives
annual income of at least €13,940 or just over €267 per week, plus any assistance with
housing costs that may apply. For a pensioner couple the income is €25,633 annually or
€491.25 weekly. In addition to these cash benefits, pensioners receive free travel and
free TV licences. In certain circumstances (related to age, etc) the income will be up to
€22.70 higher per person. Given the current tax exemptions, this income is generally
untaxed.
5Reform of the State Pension
Current State Pension
(Contributory) System
6Entitlement levels under the State Pension (Contributory), or SPC, are calculated by
means of a ‘yearly average’. This approach to State pension entitlement dates from
the introduction of the ‘Old Age Contributory Pension’ in 1961, which followed the
introduction of a comprehensive social insurance system in 1953. Up to then, the means-
tested Old Age pension provided income support in retirement to those who qualified
for it.
At the time the SPC was introduced, no-one had more than 8 years contributions paid,
and so an averaging rather than a total contributions approach was considered more
appropriate. In the ‘yearly average’ approach, the total number of contributions paid/
credited at pension age is divided by the number of years between entering insurable
employment and the last full year before pension age is reached. Entitlement is
then banded with a yearly average of 48 required for a full rate pension (separate
arrangements apply for those who reach pension age while on a Widows or Invalidity
pension). Reduced rates are payable for those with lower averages, however these are
not pro-rata and they moderate the reduction substantially. For example, someone with
a yearly average of 20 contributions (38% of the maximum) receives a personal rate of
€207.10 (85% of the maximum). These percentages have been varied significantly over
the years1 .
In January 2018, the Government announced that those whose entitlements were
assessed under the current rates (i.e. since September 2012) will have the option to be
re-assessed under a TCA option (TCA2012), and be paid whichever is the more beneficial
amount. Generous homecaring provisions mean that this will be more advantageous to
women, and also to those with 40 years of PRSI contributions.
While the yearly average approach allowed people in the 1960s qualify easily for
a contributory pension if they had worked most of their adult life, it does result in
anomalies, notably where someone could qualify for a full pension based on a small
number of years payments (currently 10 but this used to be less), provided they had
no gaps in their record. In contrast, someone who had paid 40 years into the Social
Insurance Fund (SIF), but had a significant gap in their record, would be paid a reduced
rate
As with contributory pensions internationally, current male pensioners generally have
more sustained PRSI records than females, and consequently a greater contributory
pension entitlement. While a Homemakers scheme introduced in 1994 provides
some relief, and has relatively generous provisions regarding duration compared to
other countries (up to 20 years), for most current pensioners their gaps pre-date the
introduction of the scheme and so the scheme is of limited benefit.
1
Originally, a person with a yearly average of less than 24 had no entitlement. The rates were changed significantly in
2000, in a move that reduced the contributory element of the State pension (contributory).
7The National Pensions Framework (2010) announced that the Government would
introduce a new method for calculating State pension contributory (SPC) entitlements,
from 2020. It proposed that the current ‘yearly average’ system, be replaced with a ‘Total
Contributions’ approach (TCA), which would make the level of pension paid “directly
proportionate to the number of social insurance contributions made by a person over his
or her working life”.
The introduction date of 2020 was chosen to allow future pensioners – particularly those
in self-employment before the extension of Class S contributions in 1988 - sufficient time
to build up the required entitlements.
The Framework envisaged the introduction of Homemakers Credits from 2012, and
further proposed these be introduced in advance of TCA, from 2012. However the
impact of such credits would have been very limited in the context of the Yearly Average
system, as it would replace the existing Homemaker disregard scheme, the proposal
being “people reaching pension age after the credits are introduced will have credits
rather than disregards applied to their records to cover periods of care since 1994 (up to
a maximum of 20 years).”
In practice, this alternative approach of credits from 1994, as opposed to a disregard
would benefit very few existing women pensioners, as most of their homemaking
periods pre-date 1994. Even among those with significant post-1994 periods, there
would be very many who would not have had an increase in their rate of payment. For
these reasons the change did not proceed.
8Pension Rates
9The rate of the pension was very substantially increased during the Celtic Tiger era. In
early 1999 it was IR£83, which adjusted for inflation is €152.27 today, compared to the
current rate of €243.30; these increases would have presented significant sustainability
challenges, even if there was no financial crash.
The economic crisis that followed the boom resulted in Ireland having to make significant
cuts across the board in many areas, including some where the payment rates are still
substantially below 2007 levels. The following table demonstrates that the rates of
pension payments today are largely higher now, in real terms, than they were at the
start of 2007, with the exception of those with a Yearly Average of between 10-14,
which means that there were very few paid or credited contributions over the course of
their working life (generally 10-13 years). Most people in that category will qualify for a
higher rate payment under SPNC or IQA, unless they have very substantial means over
and above the state pension, which would make them significantly better off than most
pensioners.
As can be seen from the table, the State pension held up well compared to wages and,
for example, the rate of Invalidity Pension. This table does not include the 2018 increases
in welfare rates, as the most recent Average Earnings available are from the end of 2017.
Rate 1 Jan 2007rate adj for Rate Dec % change
2007 CP1 2007-2017 2017
Average Earnings €675.80 €717.70 €714.41 -0.46%
Average Earnings €675.80 €717.70 694.19 -3.28%
less USC
SPC 48+, WCP €193.30 €205.28 €238.30 16.08%
SPC 40-47 €189.50 €201.25 €233.60 16.08%
SPC 30-39 €189.50 €201.25 €214.20 6.44%
SPC 20-29 €189.50 €201.25 €202.80 0.77%
SPC 15-19 €145.00 €153.99 €155.20 0.79%
SPC 10-14 €96.70 €102.70 €95.20 -7.30%
SPNC €182.00 €193.28 €227.00 17.44%
Invalidity pension (u66) €171.30 €181.92 €198.50 9.11%
10Poverty Rates
11The Irish pension system is one of the more successful in the EU in helping pensioners
avoid poverty, and older people are less at risk of poverty than working age people by a
very significant margin.
Domestically, the CSO measures the proportion of people ‘at risk of poverty’ as the
percentage whose equivilised disposable income is less than 60% of median equivalised
income2.
Consistent poverty is where a person is at risk of poverty, and they are also experiencing
“enforced deprivation3” as measured under the SILC survey.
The latest data for the CSO SILC dataset indicating comparative poverty rates is shown
below.
2016 CSO All Persons Aged 66yrs + Men aged Women aged
SILC 66yrs + 66yrs +
Rate % % % %
At Risk of 16.5 8.77 9.69 7.98
Poverty
Consistant 8.3 1.56 1.79 1.36
Poverty
These figures demonstrate that pensioners are considerably less likely to experience
poverty then people of working age, and that poverty rates at these thresholds are lower
among female pensioners than male ones. As pensioners dependent upon the State
pension (non-contributory) and allowances would be above the threshold for being at
risk of poverty, it is likely then over-66s who are found below the threshold live with
others who are younger, and who reduce the equivalised household income below the
60% threshold.
At an EU level, for over 65s in Ireland, the ‘At Risk of Poverty and Social Exclusion
(AROPE)’ indicator is 0.3% above the EU average for men, and 3.3% below the average
for women. The gender gap is 2.0% in Ireland compared to 5.6% in EU28, and is the 4th
lowest in EU28. The three countries with a lower ‘Gender Poverty Gap’ all have a bigger
‘Gender Pension Gap’ than Ireland.
2
Equivalised disposable income is the total household income, divided by a number related to the amount of people living in the
household (the ‘household composition’). This divisor is 1.0 for the 1st adult, plus 0.66 for all others aged 14+, and plus 0.33 for those
aged under 14. For example an adult couple with combined household disposable income of €20,000 would both have equivalised
disposable income of €12,048 (€20,000 divided by 1.66). In practice, the thresholds for this measure and the rates of State pension
payments mean that the only pensioners over 66 who are at risk of poverty are ones who share a household with people below pen-
sion age, e.g. their adult children, as this reduces the ‘equivalised’ household income.
3
Enforced deprivation means they report having gone without two or more deprivation indicators which would be considered 'basics'.
An example of such indicators are; "going without heating in the past year", "not having two pairs of strong shoes" and "not having a
meal with meat/chicken/fish every second day." There are 11 national deprivation indicators we use to capture enforced deprivation.
12At-risk-of-poverty or social exclusion rate by gender (65s+, 2015)
Member State Male (%) Female (%) Gender
Poverty
Gap (%)
Netherlands 9.7 10.2 0.5
Belgium 16 16.8 0.8
Spain 13.8 14.9 1.1
Ireland 15.4 17.4 2.0
Denmark 8.1 10.2 2.1
Malta 24.6 27.5 2.9
France 8.2 11.4 3.2
Slovakia 10.3 13.5 3.2
Luxembourg 6.9 11 4.1
Portugal 18.9 24 5.1
Germany 15.6 20.8 5.2
Hungary 11.8 17 5.2
UK 15.1 20.4 5.3
Greece 19 24.4 5.4
EU 28 15.1 20.7 5.6
Italy 20.6 26.4 5.8
Austria 10.2 16.4 6.2
Cyprus 19.5 25.8 6.3
Croatia 28 35 7
Poland 11.7 19 7.3
Finland 9 17.3 8.3
Czech Republic 5.1 13.7 8.6
Sweden 11.3 21.9 10.6
Romania 27 38.7 11.7
Slovenia 12.9 25 12.1
Latvia 33.5 47.8 14.3
Bulgaria 36.5 52.3 15.8
Lithuania 26.2 43.1 16.9
Estonia 27.4 48.6 21.2
Source: Eurostat. EU-SILCThree factors contribute to the positive outcomes in Ireland, compared to other EU
countries.
Firstly, most EU countries have state pensions related to lifetime earnings, unlike
Ireland, where the relatively negligible weekly PRSI contributions paid by a minimum
wage part-time worker accrue the same state pension benefits as the far more
substantial deductions from the salary of a highly paid CEO.
Secondly, there is a strong non-contributory pension in Ireland, with a maximum rate set
at over 95% that of the contributory pension’s maximum rate. While this is subject to a
household means test, there are very significant exemptions from the income calculated,
including wages, capital and family home, which mean that over 70% of such pensions
are paid at the maximum rate. In fact, the average rate of a non-contributory pension
paid is higher than the average contributory pension rate. This means, in practice that
those on SPC below 95% of the maximum rate have significant other means of income.
Thirdly, Widows and Widowers have access to a pension, generally at the full rate, based
on either their PRSI record or that of their spouses. Other countries often pay this at a
reduced rate, relative to the old age pension, whereas in Ireland the average Widows
pension for those over 66 is higher than the average SPC.
14Gender Gaps
15Overall, when one looks at the pension personal rate paid to people (i.e. before increases
and secondary benefits), payments to men and women are close to parity, although there
is significant variance between schemes. SPC payments to women are 7-8% lower on
average than those to men, whereas women receive higher payments (approximately
2.4%) than men across the other 3 payments (SPNC, IQAs and Widows-related payments
for over 66s), where they also constitute a majority of payees.
The net result of this is that the average rate of a state pension payment paid to a
man over 66 is approximately 1% higher than the average payment made to a woman.
Additional allowances which increase the rate (such as Living Alone and Over-80s) benefit
women more than men, as they live longer, making the payments close to parity overall.
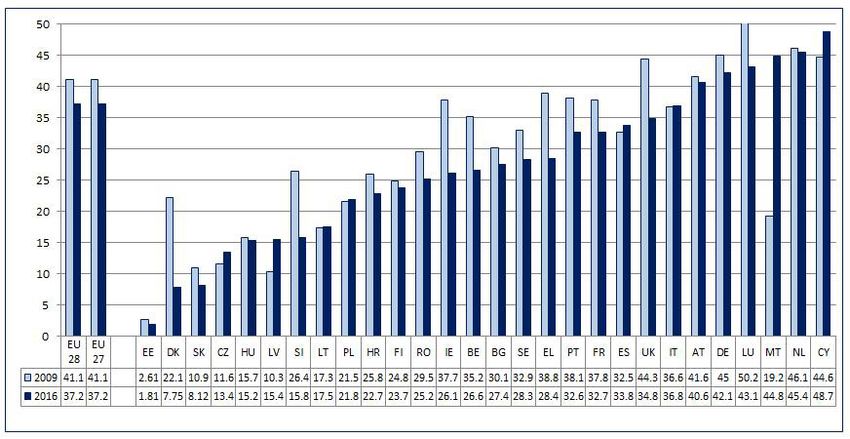
EUROSTAT compiles a Gender Pension Gap for the EU Pensions Adequacy Report,
which includes all three pension pillars ( State Pensions, Private Pensions, Occupational
Pensions). While state pension levels are effectively at parity for men and women in
Ireland, this indicator demonstrates that, among those pensioners with additional
pension income, we have a gender pension gap of approximately 26%5, compared to
37% in EU28. Between 2009-2016, this fell by 10.6% in Ireland, compared to 3.9% in
EU28. The fact that the Gender Poverty Gap for over 65s is higher in every country
with a lower Gender Pension Gap than Ireland indicates that the gap in the latter is
largely among the higher income pensioners, and results from the existing approach
to occupational and private pension outcomes in Ireland, rather than the State pension
system.
Figure 1: Gender gap in pensions (%), pensioners aged 65-79, 2009 and 2016
Source: Eurostat. EU-SILC.
5
EU Pensions Adequacy Report refers to the Gender Pension Gap as that which applied to those
aged 65-79, to remove the longevity effect. The Gender pension Gap in Ireland for those aged 65+ is
27%.
16While the overall gender pension gap in Ireland is significantly lower than the EU average
(and lower than countries such as Sweden, the Netherlands, France and the UK), and
is falling relatively rapidly compared to EU28, it still is far higher than the gap in state
pension payments, and is likely to be for decades to come, until current work patterns
are more widely reflected in the histories of future pensioners. This would be expected
to be significantly different when the pensioner cohort is comprised of today’s workers,
as one in five current workers are public servants, and an estimated 69% of current public
sector employees are women (a figure that rises to 72% among those who entered the
service post-2004).
Changes in female participation in the labour force
A broad range of legal, industrial and social changes have profoundly changed the
relationship between gender and labour force participation. As the figures below show,
labour market participation rates for women aged 35-44 rose from 18.8% in 1971, to
35.4% in 1991, and to 83.1% in 2016. In that time, men’s participation at those ages fell
slightly, from 96.3% in 1971 to 91.8% in 2016, possibly reflecting a small number of men
taking up homemaking, as the number with a higher earning spouse or partner would
have increased in that time. These changes did not happen in a short space of time,
rather they were a progression in the make-up of the workplace, and the relationship
between work and parenting.
The reasons for this include;
• Removal of the marriage bar, and EU equality legislation
• Evolving social attitudes regarding motherhood and work
• Evolving attitudes towards family planning
• Free secondary education, introduced in 1967
• Increased female participation in higher education, particularly from the 1980s
• Decline in many employments involving heavy manual labour, and rising
importance of service industries
• Increase in the median age of brides - from 24 in the mid 1970s to 34 in 2017
• Increased availability of childcare, particularly from the mid-1990s.
The following table outlines what the outcomes were for different age cohorts of men
and women between 1971 and 2016.
17Labour market participation rates (%)
State Female Male
1971 1991 2016 1971 1991 2016
All ages 27.9 32.9 53.6 80.7 70.9 67.8
15 - 19years 47.3 21.1 19.5 54.1 29.3 19.1
20 - 24 years 65.1 73.3 63.3 88.7 81.1 69.6
25 - 34 years 28.3 57.4 82.5 96.1 96.2 87.5
35 - 44 years 18.8 35.4 83.1 96.3 95.9 91.8
45 - 54 years 20.4 28.8 78 86.9 91.6 87.7
55 - 59 years 21.5 22.1 70.7 92.1 78.8 80.7
60 - 64 years 20.5 14.0 50.2 86.9 59.4 61.2
65 years and over 11.3 3.0 11.0 43.9 15.8 16.9
Source: CSO
The impact of these changes is cumulative over time, as the following examples illustrate.
A woman born in 1948 would not have had free secondary education and in most cases
would have been in work at a relatively young age in the early 1960s. Had she married
by 25 (the median age for brides at that time) she may have been impacted upon by the
Marriage Bar depending upon her employment, and during her 40s and perhaps her 50s
there may have been little or no childcare provision in her community. Even if available
for work when her children started secondary school, she may not have had significant
qualifications and might have struggled to find employment. Her ability to have a full
PRSI record when she reached state pension age in 2013 could have been significantly
impacted by having a family.
By contrast, a woman born in 1954, who was an 18 year old secondary student when the
Marriage bar was ending at the end of 1972, may have married in 1980, and, following a
10 year career gap raising children, may have returned to work around age 40, or earlier
if there was childcare available locally. She will reach pension age in 2020 (aged 66) and
while she may have a significant gap, it would be easier for her to have a maximum rate
contributory pension than someone only 6 years older than her.
A woman born in 1962 was in primary school when the marriage bar was abolished,
and may have gone to college in the early 1980s, and married in the mid 1990s. Had she
children, she would have had much greater access to childcare, with a significant increase
of childcare facilities in the 1990s and 2000s, financed in part through the EU co-funded
childcare programmes, and/or home-based childminders. Even among those who didn’t
avail of pre-school childcare, a great many would have had shorter career gaps, perhaps
totalling up to about 5 years, and would have availed of school-age childcare afterwards.
Very many of these would qualify for a maximum rate SPC.
18A woman born in 1980 generally has spent most of her homemaking years, if any, in the
period that childcare was very much more widely available. Assistance with costs (such
as the Early Childcare Supplement, and the ECCE free pre-school year programme which
succeeded it) would have assisted many such women in returning to work at an earlier
stage that their earlier counterparts were in a position to achieve.
Clearly, the older pensioner, born in 1948, would find it much harder to qualify for a full
contributory pension than one born decades later, and it is also the case that this change
has occurred gradually over time. Even when legislative changes or new schemes were
introduced, the social changes that followed were largely a result of evolution rather
than revolution, and choices regarding working and raising families did not change for
everyone overnight. It is also the case that they progressed at different rates in different
communities within the State, for example rural versus urban settings. One factor also
could influence another, for example, the increasing numbers of women looking for work
would have increased demand for childcare places, stimulating supply. To meet that
supply, many women were employed or self-employed in the childcare sector.
This gradual change, and the cohort effect, was a factor in the balance of the TCA
model proposed for 2012-2019 pensioners, and should be reflected in transitional
arrangements regarding TCA for post-2020 pensioners.
19Improving Governance and Regulation
Expansion of the PRSI
system
20Over the decades of the latter half of the 20th century, coverage under the Social
Insurance system was expanded substantially. While a single, co-ordinated social
insurance scheme was introduced in 1953 (replacing separate schemes for certain
benefits), it was not until further reforms that coverage was expanded to nearly
everyone who was economically active in the private sector.
Until a reform in 1974, people in non-manual employment above a certain income level
were outside the system, and that reform alone increased PRSI coverage by some 28%.
In 1988, a new Class S contribution was created, which provided insurance for self-
employed people (e.g. those involved in professions, trade, or farmers), and people with
investment income, rents and certain other non-wage incomes.
While most people who retire in 2028 will have had time to build up 40 years of
contributions, there will be some who would find this challenging, if it were to be a
criterion in 2020. While such pensioners may qualify for a full pension under the Yearly
Average system (depending upon their circumstances), some may not under the 2012
TCA proposals, and the 2020 proposal will have to consider this group carefully in the
final design of the scheme. Again, transitional measures may be considered in the final
scheme.
21Demographic Change 22
The cost of pensions has increased very substantially over recent decades. In 1997,
expenditure on state pensions was IR£1.35 billion, or the equivalent of €1.72 billion.
Adjusted for inflation, this amounts to €2.58 billion today.  However, by 2017 the cost of
state pensions had increased to €7.27 billion.  The cost had nearly trebled in real terms
over a period of just 20 years. In 1997, pensions accounted for 24% of the Social Welfare
budget, but by 2017 that had increased to 37%.

The latest Actuarial Review of the Social Insurance Fund (2015) confirms that this upward
trend will continue.  Despite increases in the qualifying age threshold legislated for in
2021 and 2028, the proportion of the population over State Pension age is projected
to increase from 12% in 2015 to 17% in 2035, and to 23% in 2055.  Simultaneously, the
pensioner support ratio is projected to decline from 4.9 in 2015, to 2.9 in 2035 and to 2.0
by 2055.

                                                                                              23
Alternatives to TCA
Considered
24While it has been Government policy since 2010 to introduce TCA from 2020, the
Government has listened to calls for alternative approaches and considered the costs
of benefits of other approaches. However, following analysis, these have been found
to be less effective options for reform, and pose significant risk to the adequacy or
sustainability of the pension system. This section sets out two of these, and explains why
it has been decided not to proceed with them.
Universal Pension It has been proposed that the current system could be replaced by a
Universal Pension, based on residence, where everyone received a maximum rate State
pension, regardless of their contributions or their additional income.
This option has been examined by the Department of Employment Affairs and Social
Protection which has found that in practice it would be significantly more expensive
than the current system, if set at the rate of the current pension. The precise cost
would depend upon a number of factors. However it would, at the very least, be
expected to cost an additional €1.3 billion per annum, and it could be substantially more.
Alternatively, it would require substantial cuts on the rate of payment if based on the
same level of funding.
An OECD paper on Irish Pensions (published in 2014) examined a number of reform
possibilities, including a universal pension, and noted it would be feasible if the maximum
rate of the state pension was reduced to “a modest amount”, and if these lower rate
pensions were supplemented either by a means tested increase (in the case of those
with little or no additional means) and/or a universal supplementary pension covering all
workers.
A similar system exists in the Netherlands where 50 years of residence-based
contributions can be awarded towards first pillar pensions (supplemented by a strong
second pillar of occupational pensions). However, this system produces the second
highest gender pension gap in the EU. The Dutch SPC equivalent pays a couple living
together approximately €370 per week, in contrast to the Irish system which pays them
up to €486.60 for SPC, or up to €464 for SPNC (plus additional increases and allowances).
While the remaining pension payments in the Netherlands may bring most pensioners to
a significantly higher level, their pillar two pension are based on lifetime earnings, which
significantly impacts upon women – the Gender Pension Gap in the Netherlands is 45.4%,
compared to 26.1% in Ireland.
25While a reduction in the Irish state pension rate of that order could finance a move to
a Universal Pension, most of the poorest pensioners (i.e. who depend solely on the
State pension) would be worse off under such a system, regardess of whether it was
introduced over-night or on a gradual basis.
It would also, in the context of the Irish system, be expected to result in significant
income reductions among the elderly, even among people who were middle income
earners during working life, as it would take several decades for such a mandatory or
pseudo mandatory secondary pension to be significant for most pensioners, making most
of them rely on a significantly reduced pillar one state pension.
Such an approach is contrary to Government policy of targeting available resources
appropriately, to ensure a state pension system that is both adequate and sustainable,
and so it will not be proposed to the Oireachtas by the current Government.
Continuing with the current Yearly Average system
Continuing with the current Yearly Average system would continue to see some people
with very few contributions receive a higher rate pension than some who contributed
more into the system. Aside from the unfairness inherent in that approach, this expends
finite resources that could be more effectively targeted, based on need and/or equity. It
would also mean that periods of home-caring prior to 1994 would not be recognised.
Here are two examples: One is a man who has built up significant UK state and
occupational pension entitlements of €400 per week, arrived here age 55 and worked
to pension age. The other is a woman who worked 18 years and who home-cared for
a further 18 years prior to 1994. Her share of household means is too high for her to
qualify for SPNC.
Under the Yearly Average system, the man in the example receives a further 100% Irish
pension on top of his entitlements, whereas the woman, who has made 8 years more
contributions would expect a 65% pension.
Under a TCA model similar to TCA2012, the man in the example would receive a 25% Irish
pension, (while this is a very significant reduction, it still makes his total weekly income
around €460), whereas she would receive a 90% pension of €219, an increase of just over
€60 per week. This is a more equitable outcome than under Yearly Averaging, where
the person with far fewer contributions paid and no HomeCaring is paid a substantially
higher level of SPC.
26While there are ways to moderate the effect of the anomalies of the Yearly Average
system, ultimately, such anomalies are inherent in it, and no model of the system can be
devised which is as effective as TCA in delivering equity.
Extending the choice of Yearly Average and TCA2012 beyond the 2012-2019 cohort
This choice will become available for post-2012 pensioners later this year. While it will
be relatively expensive, it is ring-fenced to a 7 year cohort of pensioners who have a
less generous Yearly Average option than those who retired before September 2012.
Obviously, some will do better under the current system, and some better under TCA.
Allowing any group to choose the most beneficial approach to them has significant
overall costs which reduce availible funds for other pensioners.
Extending this choice to post-2020 pensioners would result in very significant open-
ended costs, without removing anomalies created by the former system, and greatly
increase the long term costs facing the Social Insurance Fund, undermining the
sustainability of the pension. The Social Insurance Fund will no longer be in surplus
by 2020. There are no obvious ways of funding such an approach without impacting
on the existing rate of pension payments, future increases in pension payments, or
other current expenditure demands. Such an approach also runs the risk of the Social
Insurance Fund being unable to sustain payments to current workers when they become
pensioners. This is not, therefore, an option that the Government wishes to consider.
27Measures to Support the Operation of Defined Benefit Schemes
Models of TCA
28In addressing the pension anomaly for people who reached state pension age since
September 2012 the Government directed the implementation of an interim model
based on four elements.
1. Pensions paid to any individual are to be based on their total contributions. A
full pension will be paid to those with forty years contributions with proportionate
reductions in payment rates for those with fewer contributions.
2. People who leave the workforce to take up caring duties will receive “credited”
contributions which will count towards their pension entitlement subject to a maximum
of 20 years credited contributions.
3. Upto ten years of “ordinary credits” (e.g paid during periods of unemployment) will be
reckonable for pension purposes.
4. A minimum of ten years contributions will be required to qualify for a State pension.
Prior to finalising the shape of a general TCA system, the Government still has a
number of decisions to make regarding its design and balance, and the purpose of this
consultation is to inform those decisions.
There are a number of different policy levers within a TCA framework, which affect
different groups to varying extents, and these were approached differently in the 2010
National Pensions Framework (NPF) proposal, and in the TCA2012 proposal which will
apply to those affected by the 2012 rateband changes. Primary among these are;
• The number of contributions required for a full pension (e.g. 30 years as proposed
in the NPF, or 40 in the TCA2012 proposal)
• The amount of ordinary credited contributions that could be used (10 years in NPF
and TCA2012)
• The provisions for those who were home-carers, notably;
effective date (e.g. 1994 as in NPF, or backdated indefinitely as in TCA2012
proposal),
number of years (e.g. 10 as in NPF, or 20 as in TCA2012 proposal),
age of children (e.g. up to age 12 in NPF & TCA2012 proposal)
• The number of paid contributions required to qualify for a payment (10 years
under NPF and TCA2012)
• Transitional measures, to take account of greater difficulty in working up a 40 year
record in the 1970s/1980s than in the 1990s and later.
Costings
The recent Actuarial Review of the Social Insurance Fund examined a number of options
regarding the TCA reform. A link to the report is available at https://m.welfare.ie/en/
downloads/actrev311215.pdf
29The main variables considered were;
• The number of contributions required to qualify for a full pension, e.g. 30 or 35
years PRSI contribution
• A limit (or cap) on the number of credited contributions that may be counted as
part of this calculation
• The Homemaking provisions allowed for under the new programme (take-up was
estimated)
• Potential guarantees of a certain percentage of the rate which applied under the
Yearly Average scheme
• Phasing in/out of various options
None of these models are being proposed at this time, however they provide a basis for
understanding the policy levers available to the Government.
Appendix 1 gives examples of different pensioners and what their SPC entitlement
would be (a) under the current Yearly Average bands , (b) under the TCA proposal in the
2010 National Pensions Framework, and (c) under the TCA2012 which is being made
available for existing post-2012 pensioners. This table illustrates clearly the cases which
do better under the different systems.
30Consultation
questions
31As part of the decision making process, the Government has decided to seek the views
of stakeholders on what they see as the priorities in the Total Contributions Approach
reform. Please complete the following questionnaire, and have your say in this reform.
Three concepts are important in the design of any pension system.
The first is Adequacy, or more simply, that the rate of the payment be maintained at a
level that is considered enough for pensioners to live on, with a reasonable standard of
living. This adequacy should not be dependent upon someone being male or female.
The second is Equity, or more simply, that those who pay contributions into the system
receive an appropriate reward for that contribution.
The third is Sustainability, or more simply, the principle that the demographic changes
will not push up costs to a level where they will not be sustained in the longer term.
People who currently fund existing pensions have a right to know they will have similar
supports when they reach pension age.
32Question 1 - General Approach
Please outline, in order of preference, how you (or your organisation, if this submission
represents is made on behalf of an organisation) rank the priorities set out below
(number 1 for the most important, number 2 for the second most important, etc). Please
give a number to every issue you believe is important. If you believe something is not a
priority, you do not have to give it a ranking.
Remove all anomalies - people with more PRSI contributions shouldn’t
receive lower pensions.
Continuity – there should be as little change as possible from the Yearly
Average system.
Greater reward for contributions – those who pay more PRSI should be
paid higher pensions
Credited contributions (e.g. when receiving Jobseekers payments)
should be given as much weight as possible, compared to periods
paying PRSI
Greater equality between men and women should be a priority
Periods of low PRSI coverage (e.g. when the self-employed had no PRSI
coverage, or when mothers were expected to leave the workplace)
should be recognised in the design of the system
More people should be paid a contributory pension in their own right
(rather than a non-contributory pension)
The pension system should encourage longer working, to improve both
sustainability and adequacy
Changes from the Yearly Average system to TCA should be
gradual
You may add additional text explaining your choice in the following box.
33Question 2- Priorities in the TCA formula
In guaranteeing Adequacy (i.e. the level of payments being sufficient), the priority should
be… (number 1 for the most important, number 2 for the second most important, etc);
The rate of SPC should be indexed to the cost of
living
The pension payment rate should reflect the total
contributions paid by any person
People who take time out of the work-place to
perform caring duties should receive credited
contributions
The maximum rate of the (means-tested) non-
contributory pension should be increased relative
to the contributory pension (currently the non-
contributory pension is just over 95% of contributory
rate).
You may add additional text explaining your choice in the following box.
34Question 3 – Ensuring Sustainability
Even without improvements, the State pension system increases in cost by approximately
€200 million each year, and, in the coming decades, the number of pensioners
compared to workers is set to double Future increases in the rate of payment, and any
improvements in eligibility criteria, will further endanger the sustainability of the pension
system. To improve sustainability (i.e., the ability of insurance contributors and taxpayers
to keep paying pensions into the future), the best approach is to … (number 1 for the
most important, number 2 for the second most important, etc);
Impose greater control over future increases in
the rate of payment
Increase conditionality for pensions over time
(e.g. increase the required number of paid
contributions, or the number of contributions
required for maximum rate etc)
Reduce the contributory pension rate, relative to
the non-contributory rate
Increase State pension age, in line with increased
life expectancy
Increase the rate of PRSI paid by contributors
35Question 4 – Special Arrangements
Please indicate how closely each of these statements matches your view (Very Much,
Partially, Not Much, Not At All, Don’t Know/No Opinion)?
Very Partially Not Not Don’t
Much Much At All Know
There should be a phase-in period, where
those who qualify in the earlier years (2020-
2027) will need less PRSI for a full pension
than those who retire later (i.e. who have
a greater opportunity to build up entitle-
ments under the PRSI system that applied to
them).
There should be more generous home-car-
ing provisions for those reaching State Pen-
sion age in the 10 years following 2020 than
someone reaching State pension age in later
years, in light of the marriage bar (abolished
in 1973), limited childcare availability until
the 1990s, and other social changes.
A person with limited PRSI contributions will
usually be paid an alternative means-tested
payment at a higher rate. It would be better
for them to be paid a contributory pension,
based on their own PRSI, but with increases
in that rate, based on the same criteria that
attracts them a higher alternative payment
at present.
Pensioners who were self-employed in 1988
when Class S was introduced should have
special arrangements, not available to oth-
ers, in assisting them obtain a full pension.
Arrangements to accommodate those
self-employed before 1988 should also ben-
efit others who had no PRSI coverage before
that date.
36You may add additional text explaining your choice in the following box.
37Appendix 1 – Pen Pictures
This table sets out different people’s entitlements under the current Yearly Average
system, under the TCA model proposed in the 2010 National Pensions Framework, and
under the TCA model being made available to pensioners qualifying between September
2012 and 2019. Precise amounts may depend on a number of factors
Yearly National TCA2012
Average Pensions Rate
Rate Framework
Pen Pictures Rate
Mary started work after college aged 22-26. 85% 67% 95%
She was a homemaker from 1976-1996, then
worked until 2010 (aged 60) when she retired
Peter was employed from leaving school until 98% 100% 100%
retirement aged 65, except for 1980-1985,
when self employed.
Ann started work aged 17-25. She was a 85% 70% 95%
homecarer 1977-1997. She returned to work
for the period 2003-2013 and then retired,
aged 63..
Roisin did some part-time work aged 16, but 98% 100% 100%
had very few cons before graduating from
college. She worked from age 22-65.
100% 100% 100%
James worked from 18-28. He then went on
Invalidity Pension, and remained on that until
reaching State pension age
Mairead married young and had 2 children, a 85% 40% 63%
year apart. Aged 40, she entered the labour
market, and worked until retiring aged 52.
Margaret first worked aged 17-20. She then 85% 83% 100%
married and was a homecarer for 20 years, the
eldest turned 12 before 1994. She returned to
work and paid PRSI for another 22 years until
retirement pension.
100% 100% 90%
Donal was employed for 8 years, and self-em-
ployed from 1975 until state pension age in
2016
Ellie started work after university, aged 22, 90% 87% 100%
until she started homecaring, aged 26-44. She
then worked 18 years over a 20 year period,
with 2 years of JB/IB credits.
38Yearly National TCA2012
Average Pensions Rate
Rate Framework
Pen Pictures Rate
Joanna worked age 17-28, then home- 85% 93% 100%
cared 28-46. She worked 11 of the
following 15 years, and has JB credits
for the other 4 years, before retiring
age 61
George started work after university 98% 83% 88%
aged 22. He worked a total of 15 years,
and has 23 years JB credits (no home-
caring). He retired aged 65 when his
wife turned 66.
Alan started work aged 17, and has 15 100% 83% 88%
years PRSI paid cons and 30 years JB
credits. There are 3 years when he was
self-employed (pre ‘88) .
Susan worked age 17-35, until becom- 85% 87% 90%
ing a fulltime carer for her father, until
his death when she was aged 53. She
then retired.
Julia worked age 17-26. She homecared 90% 100% 100%
age 26-40. She worked 22 years and
signed for jobseekers a total of 2 years
before retirement
Sam worked from 17-54 (about a 100% 100% 100%
year of PRSI gaps related to informal
employment), and received jobseekers
payments for 10 years.
William worked in the UK age 100% 43% 33%
17-52(working up a full UK pension)
before moving to Ireland and working
13 years here before retirement
3940
41
You can also read