NSW TOTAL ALLOWABLE FISHING COMMITTEE - OCEAN TRAWL FISHERY DETERMINATION FOR THE 2021/22 FISHING PERIOD
←
→
Page content transcription
If your browser does not render page correctly, please read the page content below
NSW TOTAL ALLOWABLE FISHING
           COMMITTEE

OCEAN TRAWL FISHERY
  •   EASTERN SCHOOL WHITING
  •   STOUT WHITING
  •   BLUESPOTTED FLATHEAD
  •   SILVER TREVALLY

DETERMINATION FOR THE 2021/22
FISHING PERIOD

9 March 2021

                                 1
Executive Summary
Preamble
The New South Wales (NSW) Total Allowable Fishing Committee (TAFC) has
statutory responsibilities set out in Part 2A of the Fisheries Management Act 1994
(the Act) to determine the Total Allowable Commercial Catch (TACC) or Total
Allowable Commercial Effort (TACE) by NSW fishers holding the relevant
endorsement in some commercial fisheries. Various fishing regulations under the Act
also contain provisions requiring the making of fishery determinations.
The TAFC is an independent statutory body established under Schedule 2 of the Act.
In making a determination on catch or effort in a commercial fishery, the TAFC must
consider the ecological, economic and social issues associated with each fishery
and make determinations that ‘on balance’ pursue the objectives of the Act.
The TAFC is not subject to the control or direction of the Minister as to any
determination made. However, the Minister may direct the TAFC on the procedures
to be followed and the matters to be taken into account in making a fishing
determination.
This determination is for the Ocean Trawl Fishery for the period 1 May 2021 to 30
April 2022.
Management recommendations & supporting actions
The TAFC provides the following recommendations to the Minister, NSW Fisheries
and the fishing industry towards improving the management of the fishery:
1. NSW Fisheries works collaboratively with the fishing industry to introduce a
Vessel Monitoring System (VMS) to the Ocean Trawl Fishery to support
improved fisheries assessments and industry compliance reporting.
2. NSW Fisheries should take immediate action in all its fisheries and fishing
sectors that harvest Silver Trevally to reduce fishing mortality to unavoidable
bycatch levels to support stock recovery. Furthermore, NSW needs to work
closely with other jurisdictions to immediately reduce Silver Trevally catches,
particularly in the Commonwealth fishery.
3. Given the increase in discards and the decrease in the mean size and
proportion of mature fish in Silver Trevally landed catches, options should be
explored to obtain length-frequency composition information for retained and
discarded fish, perhaps by means of a cooperative industry sampling
program, to monitor any stock recovery.
4. Bluespotted Flathead fishing effort reporting requirements need to be clearly
defined and understood, so that fishing effort is correctly and consistently
reported by all fishers in future. NSW Fisheries should work closely with
industry representatives to ensure that this happens.
5. Facilitation of information exchange around the quota market would help with
quota lease and quota transfer and improve the economic potential of the
fishery. Promotion of the FishOnLine noticeboard may help in this regard.
2Determination
The Total Allowable Fishing Committee, pursuant to Part 2A of the Fisheries
Management Act 1994, determines that the commercial catch of Trawl Whiting
(combined Eastern School Whiting & Stout Whiting), Bluespotted Flathead and Silver
Trevally in the NSW Ocean Trawl Fishery should be controlled and allocated through
the following measures:
1. A TACC of 1,066 tonnes for Trawl Whiting (ESW & SW);
2. A TACC of 108.1 tonnes for Bluespotted Flathead; and
3. A TACC of 10.0 tonnes for Silver Trevally.
3Introduction
The NSW Ocean Trawl Fishery (OT Fishery) is a share management, multi-method,
multispecies fishery with a gross value of production of around $26 million for
2019/20 (McKinnon 2021). The OT Fishery is described in Schedule 1 of the
Fisheries Management Act 1994 (the FM Act) as:
a) the use of an otter trawl net (prawns) to take fish from any of the following
waters:
(i) inshore waters (not more than 3 nautical miles from the natural coast line),
(ii) offshore waters (more than 3 nautical miles from natural coast line) and
north of a line drawn due east from Barrenjoey Headland,
(iii) the waters of Coffs Harbour;
b) the use of an otter trawl net (fish) to take fish from ocean waters (east of the
natural coast line) that are north of a line drawn due east from Barrenjoey
Headland and south of a line drawn due east from Smoky Cape (other than any
waters in which use of an otter trawl net (fish) is prohibited under the
regulations); and
c) the use of a danish seine trawl net (fish) to take fish from ocean waters that
are north of a line drawn due east from Barrenjoey Headland.
North of Barrenjoey Headland (Sydney) the OT Fishery extends to the 4,000 metre
depth contour, approximately 60 to 80 nautical miles offshore. South of Barrenjoey
Headland the OT Fishery extends seaward to three nautical miles offshore.
The OT Fishery is subject to many spatial and temporal closures within these waters.
Schedule 2 of the Fisheries Management (Ocean Trawl Share Management Plan)
Regulation 2006 details waters closed to ocean trawling.
The OT Fishery is a share managed fishery. Access to the OT Fishery is limited to
shareholders, or their nominated fishers, who hold sufficient shares to satisfy the
minimum shareholding levels established for each share class in the Plan. Minimum
shareholdings apply to all ‘access’ share classes in the OT Fishery and are used to
determine if a shareholder (or their nominated fisher) is eligible for an endorsement
authorising a particular commercial fishing activity in respect of that share class. A
summary of the ‘access’ share classes and associated minimum shareholding is
provided in Table 1.
Table 1: Minimum shareholdings and numbers of endorsements (Jan 2021)
Access share class Minimum shareholding No. of endorsements
OT – inshore prawn 50 109
OT – offshore prawn 50 99
OT – deepwater prawn 25 15
OT – fish northern zone 50 28
McKinnon, F (2021) Ocean Trawl Fishery Management Report – Total Allowable Catch
Determinations 2021/22.
The total number of fishing businesses in NSW with one or more endorsements in
the OT Fishery is 251.
4The TAFC was directed to make a determination in relation to four of the finfish
species taken in this fishery – Trawl Whiting (Eastern School Whiting and Stout
Whiting), Bluespotted Flathead and Silver Trevally. A meeting was held with industry
shareholders and a representative of the NSW Professional Fishermen’s Association
in Coffs Harbour on 8 February 2021. A number of industry submissions on the
fishery were received prior to the meeting. The TAFC also meet with scientists and
managers from NSW Fisheries to gain additional information on the stock
assessment and management issues.
Biological considerations
Eastern School Whiting
Stock boundaries
Eastern School Whiting (Sillago flindersi) are caught by multiple jurisdictions off
south-eastern Australia, predominantly by New South Wales and the
Commonwealth, with smaller catches by Victoria and Tasmania. There have been
suggestions of possible stock structuring across this range, with stocks separated
somewhere between Barrenjoey Point and the New South Wales / Victoria border.
However, there is currently no clear evidence for a specific stock split and research
to investigate this is underway1. The species is therefore currently assessed as a
single stock across its entire range (see Figure 1, p12).
Catches
Over the years 2014 – 2019, NSW total annual landed catches of Eastern School
Whiting increased from 490 to 1,192 tonnes. The Trawl Whiting TACC only applies
to the fisheries north of Barrenjoey Point and the TAFC has some concerns at the
spatial reliability of Eastern School Whiting catch reporting since implementation of
the TACC, particularly regarding the reliability of the split between the northern and
southern fisheries in 2019.
Excluding 2019, catches of Eastern School Whiting by the northern fisheries
(Northern Fish Trawl NFT and Ocean Prawn Trawl OPT) over 2014 – 2018 averaged
694 tonnes, increasing from 401 tonnes in 2014 to 1,018 tonnes in 2018. Eastern
School Whiting catches in the SFT averaged 140 tonnes over 2014 – 2018. The
Northern Trawl Whiting TACC covers both Eastern School Whiting and Stout Whiting
and the latter catch averaged 217 tonnes over 2014 – 2018. The reported
Commonwealth catch over 2014 – 2018 averaged 713 tonnes, decreasing from 724
tonnes in 2014 to 603 tonnes in 20182. The overall NSW proportion of the total NSW
plus Commonwealth Eastern School Whiting catch over 2014 – 2018 was 53.9%.
Total catches by Victoria and Tasmania were estimated to be 25 tonnes and the
most recent stock assessment estimated the three-year average Eastern School
Whiting discards by all fleets to be 378 tonnes.
1
Hall, K. (in prep) Genetics of school whiting.
2Althaus F, P Burch and R Thomson (2020) Southern and Eastern Scalefish and Shark Fishery catches and discards for TAC
purposes using data until 2019. CSIRO report to AFMA for the SESSFRAG Data Meeting, 25-26 August 2020.
5Stock assessment
The main assessment for Eastern School Whiting is an integrated statistical catch-at-
age assessment conducted by the CSIRO under contract to the Australian Fisheries
Management Authority (AFMA). Stock assessments were conducted for the
Commonwealth component of the fishery in 2004 (with limited data), 2007, 2008,
2009 and 2017, with a partial (catch and CPUE only) update in 2019. State catch
data have been included in most of the recent assessments, with NSW data (catch,
length data, CPUE) included in the 2017 assessment. The latest assessment was
conducted in 20203, substantially updating the 2017 assessment. The 2020
assessment included all available data for the NSW fishery, including discard
information and separate NSW fleets. The 2020 assessment was effectively a joint
Commonwealth / NSW assessment and the integration of all data for NSW resulted
in a more reliable assessment, with lower uncertainty in most of the assessment
results.
Stock status
The 2020 Eastern School Whiting assessment estimated spawning stock biomass to
be 41% (95% confidence interval 35% to 45%) of unexploited spawning stock
biomass (B0), with a 2021 Recommended Biological Catch (RBC) of 2,140 tonnes
and a long-term yield (assuming average recruitment in the future) of 2,448 tonnes.
Assessments for this stock are conducted about every three years, with a multiyear
TACC being set for the Commonwealth fishery between assessments. The average
RBC over the three-year period 2021-2023 was estimated to be 2,237 tonnes.
The Eastern School Whiting stock is assessed to have remained fairly stable over
the past two decades, fluctuating between 30% B0 and 48% B0 since 1986. Recent
recruitment appears to have returned to average or above average levels, after a
period of below average recruitment over 2006 – 2012. The assumption of average
recruitment over the next three years appears appropriate, so that a three-year RBC
of 2,237 tonnes per year should be sustainable.
Total Eastern School Whiting catches by all fleets in all jurisdictions should remain
within the recommended three-year RBC of 2,237 tonnes per year. The NSW share
of this RBC is appropriate to achieving this outcome.
Bluespotted Flathead
Catches
Bluespotted Flathead (Platycephalus caeruleopunctatus) distribution extends from
southern Queensland to eastern Victoria. However, the stock is primarily fished in
NSW state waters, with no landings data available for other jurisdictions. NSW total
annual commercial catches fluctuated around 200 tonnes from 1951/52 – 1989/90,
exceeding 400 tonnes in 1964/65 – 1965/66, and then decreased to fluctuate around
3Day J, Hall K, Bessell-Browne P and Sporcic M (2020) School Whiting (Sillago flindersi) stock assessment based on data up
to 2019. CSIRO report to AFMA, December 2020, 154 pp.
6150 tonnes per year from 1990/91 – 2011/12. Commercial catches were 210 tonnes
in 2010/11, decreasing to 95 tonnes in 2014/15, before increasing again to 146
tonnes in 2017/18 and 124 tonnes in 2018/194. Bluespotted Flathead is an important
species for recreational and charter boat fishers in NSW and surveys indicate that
the recreational catch exceeds the commercial catch, accounting for up to 70% of
the total NSW SBF harvest, when catches by interstate fishers are included.
Stock status
Substantial time series of catch and CPUE data are available for the commercial
Bluespotted Flathead fishery and these have been subject to increasingly complex
analysis as the temporal resolution of CPUE data has improved from monthly to daily
and then hourly catch rates. The most recent analyses estimate the stock to be at
about 35% of B0, although with a wide range from 20% to 65%, due to the inherently
high uncertainty in the data-poor assessment methods required when only catch and
CPUE data are available. More importantly, most of the CPUE series, as well as
catches, have remained stable or increased around medium- to long-term average
levels over the past 5 to 10 years. This indicates that the stock is at or near a BMSY
target level and that catches appear sustainable and appropriate to maintain the
stock near this target.
Recommendation
• Bluespotted Flathead fishing effort reporting requirements are clearly defined
and understood so that fishing effort is correctly and consistently reported by
all fishers in future. NSW Fisheries should work closely with industry
representatives to ensure that this happens.
Silver Trevally
Silver Trevally (Pseudocaranx georgianus) are relatively long-lived and slow
growing, attaining a maximum age in excess of 25 years, although maturing at a
relatively early age of 2 – 4 years at 18 – 24 cm fork length5. Stock structure is poorly
understood, but adults have been found to have restricted post-settlement
movement. For assessment and management purposes, Silver Trevally off NSW are
considered to constitute a single management stock, but it is likely that this is shared
at least with the Commonwealth fishery off NSW.
Catches
Estimated total annual Silver Trevally catches in all NSW fishing sectors (Ocean
Trawl, Ocean Trap and Line, Estuary General, Ocean Hauling and Recreational)
have declined steadily from more than 1,000 tonnes per year over 1984 – 1990, to
450 tonnes in 1998, to less than 50 tonnes per year over 2019 – 20206. OT Fishery
4
Hall, K.C. (2021) Stock assessment and status summary report 2020 – Ocean Trawl Fishery – Bluespotted Flathead
(Platycephalus caeruleopunctatus). NSW Department of Primary Industries, Coffs Harbour, 73 pp.
5
Rowling, K. R., & Raines, L. P. 2000. Description of the biology and an assessment of the fishery for silver trevally
Pseudocaranx dentex off New South Wales. NSW Fisheries Research Institute, Cronulla, 70 p.
6
Fowler, A.M. and Chick, R. C. 2020. Stock assessment report 2020/21 – Ocean Trawl Fishery – Silver Trevally
(Pseudocaranx georgianus). NSW Department of Primary Industries - Fisheries: 46 pp.
7catches declined rapidly from more than 200 tonnes in 2007 to 7.6 tonnes in 2020
following introduction of a 30 cm total length minimum legal length (MLL). It is
estimated that the northern OTF is currently discarding 37% of the total ST catch by
weight (65% by number), largely due to them being under the MLL. There is a
moderate recreational catch of ST, with survey results indicating a recreational catch
proportion of around 11% - 23% of the NSW total catch.
Of further concern, the estimated proportion of fish in commercial catches larger than
30 cm fork length has decreased from around 70% in 1993 and 1994 (onboard
observers), to 40% in 1997 (onboard observers), 14% in 2008 (fish market sampling)
and only 6% in 2019 (fish market sampling) (A. Fowler DPI pers comm). There are
now few large mature Silver Trevally in the OTF commercial landed catches,
indicating significant overfishing of the adult stock.
Catch rates and stock status
Standardised CPUE catch rates for the OTF have declined rapidly since about 2010,
now being less than 25% of the long-term average. Various optimised catch-only
models estimate the Silver Trevally stock to be between 0.18 and 0.30 of a BMSY
target, well below what would be a recommended 0.50 BMSY limit. The most recent
CPUE assessment for the Commonwealth fishery estimates the portion of the Silver
Trevally stock fished by the Commonwealth has declined rapidly from the CPUE
target level in 2017 to below half the target level (corresponding to being below a
0.20 B0 (BLIM proxy)) in 20197. All available indicators and assessment results
therefore indicate this stock to be depleted below a biologically safe limit.
Recommendations:
• Given the depleted state of the Silver Trevally stock, every effort must be
made to minimise fishing mortality (catches and discards) by all jurisdictions
and fleets. NSW Fisheries should work with the Commonwealth (AFMA) to try
and ensure that this is achieved across all areas of the fishery.
• Given the increase in discards and the decrease in the mean size and
proportion of mature fish in landed catches, options should be explored to
obtain length-frequency composition information for retained and discarded
fish, perhaps by means of a cooperative industry sampling program.
Economic considerations
General Considerations
The four species considered in the OTF form part of multi-species catches in several
fisheries: the OTF, the Southern Fish Trawl Restricted Fishery (SFT), the Ocean
Trap and Line Fishery (OTLF), the Estuary General Fishery (EGF), and the Ocean
Hauling Fishery (OHF). The degree to which these species are targeted varies. For
example, Stout Whiting and Eastern School Whiting and Bluespotted Flathead are
significant byproduct for ocean prawn fishers, but are the main target species in the
7
Sporcic M (2020) Draft Tier 4 Assessments for selected SESSF species (data to 2019). CSIRO report to AFMA for the SERAG
Meeting, 9-10 December 2020.
8fish trawl sector. Compared to fisheries targeting single species, the economic
interactions of multi-species, multi-fleet and mixed-catch fisheries are complex.
To illustrate, a reduction in the TACC for a low value species that is taken as
byproduct, could result in limiting total fishing activity and thereby reducing total trip
revenues. Conversely, it could result in continued fishing after quota has been used,
with over-quota catch discarded. The economic value in this case would similarly be
reduced, but without any sustainability benefits.
An additional difficulty in understanding the economics of the fishery, is that the
TACC to be set for each species will be only a portion of the total catch of the
species. In the case of Bluespotted Flathead, the recreational fishing sector takes a
significant share of total catch. Without formal catch sharing and joint management
arrangements with other jurisdictions, it is difficult to set TACCs in a way that will
improve economic performance of the fishery.
Details of the economic characteristics of the four species, namely catch, price,
gross value of production (GVP), quota transfers and management charges, are
provided in the most recent Ocean Trawl Fishery Management Report – Total
Allowable Catch Determinations 2021/20228. Information on factors directly affecting
the economic performance of the fishery, namely catch, effort, catch rate and
number of active fishers, is provided in NSW Stock assessment and status summary
report 2020 – Eastern School Whiting and Stout Whiting 9, Silver Trevally10, and
Bluespotted Flathead11.
Eastern School Whiting and Stout Whiting
To provide the trends in these various indicators, a summary of the available data for
Eastern School Whiting and Stout Whiting is provided in Table 1. Summary data are
reported for four 5-year time periods, covering the twenty years to 2019/2012.
Table1: Summary economic data – Stout and Eastern School Whiting, 2000/01 – 2019/20
Stout Whiting Eastern School Whiting
Years Catch Price (real) GVP (real) Catch Price (real) GVP (real)
(t/an) ($/kg) ($'000/an) (t) ($/kg) ($'000/an)
2000/01 - 2004/05 408 4.14 1,665 864 3.57 3,093
2005/06 - 2009/10 322 4.71 1,559 742 4.11 2,987
2010/11 - 2014/15 268 4.35 1,176 492 4.84 2,337
2015/16 - 2019/20 212 4.07 871 675 4.62 3,145
8McKinnon, F. 2021. Ocean Trawl Fishery Management Report – Total Allowable Catch Determinations 2021/2022 –
Bluespotted Flathead, Eastern School Whiting, Stout Whiting Silver Trevally. Report to the TAF Committee for the 2021 to
2022 fishing period. NSW Department of Primary Industries, Fisheries NSW, Coffs Harbour, 60 pp.
9 Hall, K.C. 2021. NSW Stock assessment and status summary report 2020 – Eastern School whiting and Stout Whiting
(Sillago flindersi and Sillago robusta). NSW Department of Primary Industries, Coffs Harbour 100 pp.
10
Fowler, A.M. and Chick, R.C. 2020. Stock Assessment report 2021/ _Ocean Trawl Fishery - Silver Trevally (Pseudocaranx
georgianus), NSW Department of Primary Industries - Fisheries, 46 pp.
11
Hall, K.C. 2021. NSW Stock assessment and status summary report 2020 – Ocean Trawl Fishery – Bluespotted Flathead
(Platycephalus caeruleopunctatus). NSW Department of Primary Industries, Coffs Harbour 100 pp.
12 Data for 2020/21 has not been reported due to incompleteness.
9Dividing the past 20 fishing seasons into four 5-year periods captures the essence of
the trends and known economic characteristics of the fishery13. Trends in the key
indicators are as follows:
Catch:
• Annual average catch of Stout Whiting almost halved from the five years
ending 2004/05 to the five years ending 2019/20, falling from 408
tonnes/annum (t/an) to 212 t/an.
• Annual average catch of Eastern School Whiting also declined over the same
period, although only by a little over 20 per cent. The trend in recent years has
been positive with the average catch over the past five years (675t) 37 per
cent above the previous 5-year average (492t). Landings of Eastern School
Whiting have shown much greater year on year variability than for Stout
Whiting. For example, in the most recent 5-year period, annual catch of
Eastern School Whiting ranged from 472 in 2015/16 to 952 tonnes in 2017/18.
Price:
• For Stout Whiting the real price over the past five years has been similar to
that of 20 years ago, despite a slight lift of 10-15 per cent for the years in
between.
• By contrast, the average price for Eastern School Whiting was almost 30 per
cent higher over the past five years than two decades earlier. While the
average prices in the 10 years to 2009/10 saw Stout Whiting receive a
premium of around $0.60/kg ($4.43/kg vs $3.84/kg), the reverse has been true
over the past decade with the average price of Eastern School Whiting
approximately $0.50/kg higher ($4.21/kg vs $4.73/kg).
GVP:
• Reflecting the above trends in catch and price, average annual GVP for Stout
Whiting experienced a fall of almost 50 per cent over the 20 years ($1.7m/yr
to $0.9m/yr).
• Despite a dip in the middle years of the 20-year period, average annual GVP
for Eastern School Whiting in the most recent five years was similar to that of
20 years earlier (around $3.1m/yr). The trend over the past decade has been
positive with the average GVP over the past five years ($3.1m/yr) 35 per cent
above the previous 5-year average ($2.3m/yr)
A simple analysis suggests there is little correlation between the quantity of product
landed and reported prices, particularly in recent years. A more thorough analysis
would require, among other things, comprehensive price data (only SFM data
available); account taken of the quantity of product landed in other
fisheries/jurisdictions; supply of substitute product to the relevant markets and the in-
season responses to variable landings (i.e. daily or weekly price and quantity data).
Additionally, prior to the current fishing season, a significant portion of the trawl
whiting catch was exported, processed and then returned to Australia for wholesale
13 A complete annual data set provided in Appendix 1.
10and retail domestic markets. Further analysis in this area would assist in
understanding these complex market relationships and interactions.
As noted in the previous determination report,14 there are no independent economic
targets or performance indicators for the fishery. Unfortunately, no information is
available on the cost of fishing, which would allow analysis of the economic position
of the fishery. Data on the variable costs of fishing would, at least, enable the
estimation of a gross margin for the active business units and the fishery as a whole.
A fishery gross margin model (or similar partial models) can be an alternative or
proxy to maximising fishery profit as measured by maximum economic yield (MEY)15.
A fishery gross margin can be calculated as total fishery income less total variable
costs, where variable costs are proportionate to fishing effort.
From an economic perspective, a reduction in TACC is likely to have implications for
the level of discarding in the fishery or further constrain the catch of high value
species (e.g. prawns). A moderate increase in TACC is unlikely to create downward
pressure on prices received, unless the increased supply to market was
concentrated over relatively short time periods. For these reasons, an increase in the
TACC of around 15-20 per cent (i.e. 898 to 1,066 tonnes) would almost certainly
improve the economic position of the fishery.
Silver Trevally
A summary of the available economic trend data is provided in Table 2. Summary
data are reported for four 5-year time periods, covering the twenty years to 2019/20.
Table2: Summary economic data – Silver Trevally, 2000/01 – 2019/20
Silver Trevally
Years Catch Price (real) GVP (real)
(t/an) ($/kg) ($'000/an)
2000/01 - 2004/05 88 4.11 360
2005/06 - 2009/10 48 5.92 261
2010/11 - 2014/15 27 6.99 191
2015/16 - 2019/20 19 8.81 159
Source: Appendix 1
Trends in the key indicators are as follows:
• Annual average catch of Silver Trevally was less than one-quarter in the five
years ending 2019/20 compared to the five years ending 2004/05, falling from
88 t/an to 19 t/an.
14 NSW Total Allowable Fishing Committee (2019) Report and Determination for the 2020 Fishing Period. NSW Ocean Trawl
Fishery: Bluespotted Flathead, Tiger Flathead, Silver Trevally, and Eastern School Whiting and Stout Whiting.
15 MEY indicates the level of catch that provides the maximum net economic benefits or profits to society. MEY can be
estimated using complex bio-economic models with key parameters including biological carrying capacity (biomass at no
fishing), biomass growth rate, fishing mortality rate, revenue and costs.
11• The decline is even more marked in recent years with catches of
approximately 8 tonnes in 2018/19 and 5 tonnes in 2019/20. The year to date
(1 May 2020 to 1 March 2021) catch is around 1 tonne.
• The real price over the past 20 years has more than doubled from $4.11/kg to
$8.81/kg and was above $9/kg in each of the last two years.
• Reflecting the above trends in catch and price, average annual GVP
experienced a fall of more than 50 per cent over the past 20 years ($0.36m/yr
to $0.16m/yr). In 2019/20, GVP was just $42,000.
As noted elsewhere in this report, all available indicators and assessment results
suggest the Silver Trevally stock is severely depleted. The current economic
contribution of Sliver Trevally to the OTF is negligible. The long-term economic
performance of the fishery will be enhanced if immediate action is taken to allow the
stock to recover.
Bluespotted Flathead
A summary of the available economic trend data is provided in Table 3. Summary
data are reported for four 5-year time periods, covering the twenty years to 2019/20.
Table3: Summary economic data – Bluespotted Flathead, 2000/01 – 2019/20
Years Catch Price (real) GVP (real)
(t/an) ($/kg) ($'000/an)
2000/01 - 2004/05 119 4.68 559
2005/06 - 2009/10 127 6.67 853
2010/11 - 2014/15 107 6.68 708
2015/16 - 2019/20 85 6.99 591
Source: Appendix 1
Trends in the key indicators are as follows:
• Annual average catch of Bluespotted Flathead has declined over the past 15
years. The catch has been relatively stable in recent years despite some year-
to-year fluctuations.
• The real price has improved from 20 years ago, but has been stable for at
least the last decade. The average price has edged above $7.00/kg in the
past 2-3 years.
• Reflecting the above trends in catch and price, average annual GVP has
experienced a fall, in line with the decline in catch. In 2019/20, GVP was
$520,000, slightly below the 5-year average.
All available indicators and assessment results suggest the stock for Bluespotted
Flathead is currently stable and the biomass is likely to be around the level to attain
maximum sustainable yield. There is no apparent sustainability benefit from lowering
the current TACC and, with the limited economic information available, there is
unlikely to be any associated economic benefits from such a change.
Bluespotted Flathead
12The quota usage in 2019/20 was 64 per cent and after 10 months of the current
fishing year (up to 1 March 2021) usage was approximately 52 per cent, suggesting
an annual usage similar to 2019/20 is likely to be achieved. This suggests an
increase in the TACC would not result in any material economic benefit.
For these reasons, it is recommended to retain the TACC at its current level.
The 2019-20 fishing period (1 May – 30 April) marked the first full year of operation
of the quota market in the OTF. Although the second full year of operation is almost
complete, it is still early days for the quota market and for fishers to fully adjust their
fishing businesses. Comments from industry to the TAFC indicated a number of
difficulties with the market, particularly in identifying who held un-used quota and
knowing how much quota was available in aggregate.
Recommendation:
• Facilitation of information exchange around the quota market would help with
quota lease and quota transfer. Promotion of the FishOnLine noticeboard may
help in this regard.
Fishery management considerations
The Ocean Trawl Fishery (OTF) comprises two main sectors, Ocean Fish Trawl and
Ocean Prawn Trawl fishing north of Barrenjoey Point. The regulatory scheme along
with current issues and recent data can be found in the Ocean Trawl Fishery
Management Report TAC Determinations 2021-2022 (NSW DPI 2021).
The fishery has had almost two years of total allowable commercial catch/individual
transferable quota (TACC/ITQ) management for several key species/species groups;
trawl whiting (Eastern School Whiting & Stout Whiting), Bluespotted Flathead and
Silver Trevally. The introduction of TACC/ITQ management on 1 May 2019 has
required fundamental changes to how the fisheries management system operates so
that the expected improvements to its efficiency and effectiveness can be realised.
These changes, which affect the fishery information that is collected, communicated
and analysed are central to the TAFC’s decision making and are considered further
below. The TAFC also welcomes the progress on harvest strategies for the OTF
which will help guide its decision making in future years.
In terms of changes to fishery information, the TAFC noted that in future stock
assessments are likely to become reliant on a wider range of data, including catch
per unit of effort, catch length frequency and fish ageing. In terms of economic
information, the TAFC has an interest in the development of an efficient market for
leasing and permanent transfer of ITQ, as explained in the economics section of this
determination. For compliance, detecting and minimising quota evasion becomes
important, as it supports an accurate measure of total fishing mortality for each fish
stock.
The TAFC was made aware at its meetings with industry shareholders and NSW
Fisheries of the limitations of historic and current information sources as a basis for
reliable stock assessments. While there are many ways that information could be
13improved, the most pressing issue is verifying fishery-dependent information given
that future assessments will depend primarily on data provided by commercial
fishers. Scientists are spending large amounts of time attempting to reconstruct
reliable historical data series for stock assessments, due to past spatial, catch and
effort reporting deficiencies or changes.
Historically, the lack of verification has been tolerated, but the advent of the
TACC/ITQ system no longer allows this to continue. Fishers must operate within
their quota allocation and are reliant on management to enable the quota market to
work efficiently and that quota reconciliation process to account for unintended over
quota catch is sufficiently flexible. If efficient and flexible systems are not in place,
then there are greater incentives for industry to avoid using the system of ITQ leases
and permanent transfers. Compliance risks, such as transhipment at sea, landing
fish without declaring them, or reporting catch from areas where no TACC applies
are examples of what can occur. These behaviours add uncertainty and risk which
the TAFC must consider when it determines sustainable catch levels.
The primary solution to data verification was first applied in Australian fisheries in
1994 and is now widespread in many TACC/ITQ fisheries across many Australian
jurisdictions - Vessel Monitoring Systems (VMS). These GPS-based systems are
now inexpensive and solve spatial misreporting issues and support high resolution
shot by shot catch and effort data for stock assessments. Through automation and
future integration with electronic logbook systems, VMS can also reduce the burden
of industry reporting.
Recommendation:
• NSW Fisheries work collaboratively with the fishing industry to introduce
Vessel Monitoring Systems (VMS) to the Ocean Trawl Fishery as soon as
possible, to support improved fisheries assessments and industry compliance
reporting.
Good working relationships between science, management and industry are
paramount and need to be fit for purpose in a TACC/ITQ context. These can build on
existing relationships, but industry will need support as it moves from a management
system it knew well (licences, boats, gear, etc) to one that is not yet familiar (harvest
strategies, stock assessments, quota trading, etc). While these are primarily industry
matters, the TAFC noted the difficulties industry is facing in engaging with the stock
assessment process. It would be worthwhile for government and industry to
consider how to improve industry’s engagement in the scientific and economic
processes of providing stock assessment advice.
As noted earlier, the TAFC recognises the importance of the operation of an efficient
and effective ITQ system as a means of ensuring all catches are accurately reported.
Communication between quota owners (to lease or sell/buy quota), business risks
(having access to quota to make the business viable) and ITQ flexibility (quota
reconciliation, undercatch/overcatch) are all important in this regard. Currently in
NSW this is, understandably, a work in progress, but ultimately quota owners need
to readily be able to contact one another to trade quota (while respecting a right to
14privacy) and enable fishing operators to reconcile catch, considering the vagaries of
fishing both during and at the end of a fishing period.
The TAFC was informed about both the Business Efficiency Program (BEP) and the
consideration of the report ‘Economic Analysis and Social and Economic Monitoring
following the NSW Commercial Fisheries Business Adjustment Package’ (Kate
Barclay, UTS, 2020). The BEP is an important process and the TAFC encourages a
focus on improving the ease of use of the TACC/ITQ system and measures that lead
to more accurate measurement of total fishing mortality (landed catch and discards).
Reducing discarding is a significant issue for the OTF, where around 200 tonnes of
whiting is currently discarded each year. The TAFC was made aware that NSW
Fisheries is in the process of responding to the Barclay Report and it will consider
any relevant responses once they are made available. One of the key
recommendations of the report was to establish a social and economic monitoring
framework for NSW commercial fisheries as a matter of high priority and urgency. The
government has supported this recommendation and DPI has initiated the process to
establish independent and ongoing social and economic indicator monitoring for
NSW’s commercial fisheries16.
A further issue is the quality and frequency of data from the recreational, charter
fishing and indigenous sectors. For effective TACC setting, having up-to-date and
reliable estimates of retained catch and discarding from these sectors is important
and the TAFC encourages such data to be collected on a regular basis.
Trawl Whiting
The trawl whiting fishery subject to a TACC is the fishery north of Barrenjoey Point to
the Queensland (QLD) border. It harvests two whiting species, Eastern School
Whiting, which makes up most of the catch and Stout Whiting, which is caught
mainly in the northern part of the fishery. Eastern School Whiting is also caught in
other NSW fisheries, but mainly in the Southern Fish Trawl Fishery (SFTF). The
Eastern School Whiting stock is further shared with the Commonwealth and to a
lesser degree with Victoria and Tasmania. Stout Whiting is a shared stock with QLD,
which is the majority harvester. The TAFC notes and supports the growing working
relationship that NSW has with QLD and the Commonwealth in conducting joint
stock assessments for whiting species.
The TACC for ESW needs to be established within the overall Recommended
Biological Catch (RBC) for Eastern School Whiting, making allowances for discards
and catches by other fleets. The RBC is the estimated total sustainable fishing
mortality derived from the stock assessment. For the purposes of determining a trawl
whiting TACC, the TAFC accepted the 2020 Commonwealth Tier 1 assessment
along with additional advice from NSW Fisheries scientists. (Further information on
the assessment is provided in the science section of this determination).
16https://www.dpi.nsw.gov.au/__data/assets/pdf_file/0011/1256393/Govt-reposnse-Economic-analysis-and-social-and-
economic-monitoring-following-the-NSW-Commercial-Fisheries-Business-Adjustment-Program.pdf
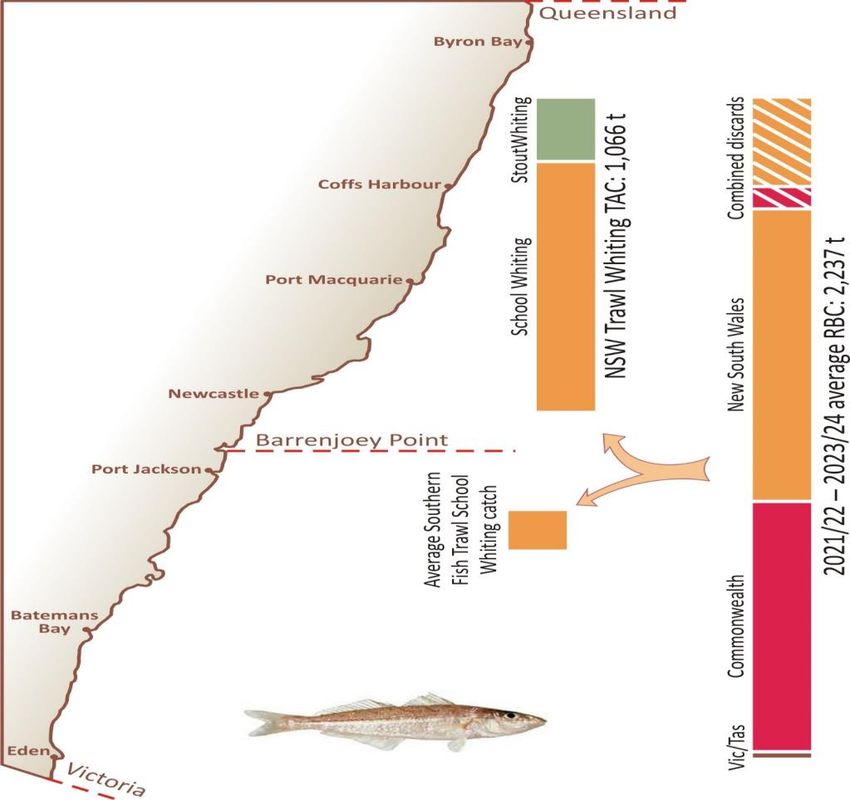
15Given the Eastern School Whiting stock assessment is not expected to be reviewed
until 2024-5, the average RBC of 2,237 tonnes for the next three years was used. An
amount for estimated discarded catch across all fisheries was then deducted (378
tonnes) and a further amount is deducted for state catches (25 tonnes). This
provides an available sustainable catch to be shared between the Commonwealth
and NSW of 1,834 tonnes.
As there is no formal catch sharing arrangement in place between NSW and the
Commonwealth, a percentage of the total catch taken by NSW was used, calculated
as an average for the five years 2014 to 2018. More recent years have not been
used given the possible effects on catch and effort data following the introduction of
TACC/ITQ management. The resulting NSW Eastern School Whiting share was
53.9% of the 1,834 tonnes, being 988 tonnes. The OTF share of this amount is 848
tonnes, once the SFTF Eastern School Whiting catch of 140 tonnes has been
deducted. The SFTF Eastern School Whiting catch was an average of the years
2014 to 2018. The OTF Stout Whiting share is the proportion of the total STW catch
taken in NSW waters averaged over the years 2014 to 2018, this was 217 tonnes.
The combined whiting TACC for the OTF is (therefore 848 + 217 for) a total of 1,066
tonnes, once rounding errors have been accounted for. It is this amount that the
TAFC is determining for trawl whiting for the 2021-22 fishing year. In addition, and
subject to consultation and any relevant scientific advice, the TAFC will seek to
determine the same amount for the following two years to provide stability consistent
with the three-year average RBC until the next stock assessment is completed.
Bluespotted Flathead
Given that stock indicators for Bluespotted Flathead have remained stable or
increased over the past decade, biomass is likely to be around the level supporting
maximum sustainable yield. Catches are often made in association with whiting, but
there is no strong relationship in catch levels between the stocks, as some target
Bluespotted Flathead fishing occurs. Bluespotted Flathead is also an important
contributor to the recreational fishery, but with participation in that sector stable or
declining, the harvest is not expected to increase.
The TAFC noted that while the introduction of ITQ management has made stock
status less certain due to its possible effects on fishery dependent data, it has
determined that the TACC will remain unchanged for the OFT at 108.1 tonnes.
16Figure 1: Diagram illustrating the determination of the New South Wales Whiting TAC for the
Ocean Trawl Fishery. The recommended biological catch (RBC) from the latest stock
assessment average 2,237 tonnes over the three fishing years 2021-22 to 2023-24. The
NSW catch share of this RBC was based on average catch proportions by the NSW and
Commonwealth fleets over the calendar years 2014 to 2018. From this, the average School
Whiting catch in the Southern Trawl fishery over those years was subtracted and the
average Stout Whiting in the northern Ocean Trawl Fishery over those years was added, to
arrive at the Ocean Trawl Whiting TAC of 1,066 t.
17Silver Trevally
The Silver Trevally stock is estimated to be around 10% of initial biomass, which is
well below the commonly used limit reference point for most fisheries (20% of initial
biomass). Silver Trevally are taken in several NSW commercial fisheries (OTF,
Estuary General, Ocean Trap & Line and SFT) and there is a significant charter
fishing and recreational catch component. For the OTF and other commercial
fisheries reported catches have been in decline for many years (see science section
of this report for more details). Further, the OTF TACC has not been caught in
recent years and discarding is estimated to be around 90%, driven by the 30cm
minimum legal limit and proportionally fewer fish above the minimum legal length.
The Silver Trevally stock is severely depleted and immediate action needs to be
taken to allow the stock to recover to above the limit reference point. This will likely
take between 5 and 10 years, if total fishing mortality can be quickly restricted to a
very low level.
Due to the long-term and continuing decline in the reported catch, the TAFC has
decided to use the two most recent fiscal year catches as a basis for setting an
unavoidable bycatch TACC to minimise targeted fishing.
The average reported catch for the fiscal years 2018-19 and 2019-20 is
approximately 10.0 tonnes and is the basis for the TACC determination. However,
any TACC for the OTF is of limited effect, given the catch from this fishery makes up
only a small proportion of total fishing mortality from all NSW sources (commercial,
charter and recreational). Urgent action to reduce fishing mortality need to be taken
for all NSW fisheries, if stock recovery is to occur. Furthermore, the Commonwealth
takes significant quantities of Silver Trevally and that jurisdiction must be strongly
encouraged to reduce its catch to bycatch only levels to support stock recovery.
Recommendation:
• NSW Fisheries take immediate action in all its fisheries and fishing sectors
that harvest Silver Trevally to reduce fishing mortality to unavoidable bycatch
levels to support stock recovery. Furthermore, NSW needs to work closely
with other jurisdictions to immediately reduce Silver Trevally catches,
particularly in the Commonwealth fishery.
18Determination
The Total Allowable Fishing Committee, pursuant to Part 2A of the Fisheries
Management Act 1994, determines that the commercial catch of Eastern School
Whiting, Stout Whiting, Bluespotted Flathead and Silver Trevally in the Ocean Trawl
Fishery should be controlled and allocated through the following measures:
1. A TACC for Trawl Whiting (ESW & STW) during the period 1 May 2021 to 30
April 2022 of 1,066 tonnes;
2. A TACC for Bluespotted Flathead during the period 1 May 2021 to 30 April
2022 of 108.1 tonnes; and
3. A TACC for Silver Trevally during the period 1 May 2021 to 30 April 2022 of
10.0 tonnes.
Species Catch Limit 2021/22 (tonnes)
Trawl Whiting (ESW & STW) 1,066
Bluespotted Flathead 108.1
Silver Trevally 10.0
Signed (for and on behalf of the TAFC)
William Zacharin
Chair, TAFC
9 March 2021
19Appendix 1: Summary landing and price data in the Ocean Trawl Fishery 2000/01 - 2019/20
Stout Whiting Eastern School Whiting Bluespotted Flathead Silver Trevally
Landings Price (real) Landings Price (real) Landings Price (real) Landings Price (real)
(t) ($/kg) (t) ($/kg) (t) ($/kg) (t) ($/kg)
2000/01 334 4.33 787 4.06 127 5.50 70 5.17
2001/02 345 5.00 900 3.59 114 4.54 125 4.33
2002/03 509 3.65 1,005 3.81 120 4.22 75 4.22
2003/04 445 4.04 808 3.42 120 3.97 101 3.29
2004/05 405 3.70 817 2.99 116 5.15 69 3.55
2005/06 382 3.45 932 2.83 112 6.17 72 4.14
2006/07 333 6.04 838 4.34 122 6.75 86 5.15
2007/08 378 7.02 735 4.56 149 7.00 27 6.62
2008/09 267 3.38 569 4.53 134 7.31 29 7.18
2009/10 247 3.64 635 4.30 120 6.12 27 6.49
2010/11 286 3.77 695 4.20 157 6.28 27 6.00
2011/12 262 4.38 540 4.71 117 5.89 17 6.28
2012/13 286 5.55 481 5.07 96 7.36 39 7.71
2013/14 222 3.83 311 5.36 90 7.37 23 7.31
2014/15 285 4.24 435 4.86 76 6.51 28 7.64
2015/16 230 4.89 472 4.44 73 6.38 42 8.32
2016/17 176 3.18 579 4.24 85 6.29 21 8.15
2017/18 185 4.25 952 4.67 104 7.17 19 8.58
2018/19 253 4.02 822 4.99 96 7.15 8 9.66
2019/20 216 4.02 550 4.78 65 7.95 5 9.32
20You can also read