Report by the Government Actuary on: The draft Social Security Benefits Up-rating Order 2020; and The draft Social Security (Contributions) ...
←
→
Page content transcription
If your browser does not render page correctly, please read the page content below
Report by the Government Actuary on:
The draft Social Security Benefits Up-rating Order 2020;
and
The draft Social Security (Contributions) (Rates, Limits
and Thresholds Amendments and National Insurance
Funds Payments) Regulations 2020
Report by the Government Actuary on:
The draft Social Security Benefits Up-rating Order
2020;
and
The draft Social Security (Contributions) (Rates,
Limits and Thresholds Amendments and National
Insurance Funds Payments) Regulations 2020

Presented to Parliament pursuant to section 142(1) of the Social Security
Administration Act 1992, as amended by the Social Security Contributions (Transfer
of Functions, etc.) Act 1999 and sections 150(8), 150A(5) and 151A(6) of the Social
Security Administration Act 1992.

January 2020

© Crown copyright 2020

This publication is licensed under the terms of the Open Government Licence v3.0
except where otherwise stated. To view this licence,
visit nationalarchives.gov.uk/doc/open-government-licence/version/3.

Where we have identified any third party copyright information you will need to obtain
permission from the copyright holders concerned.

This publication is available at www.gov.uk/official-documents.

Any enquiries regarding this publication should be sent to us
at enquiries@gad.gov.uk

ISBN 978-1-5286-1772-7

CCS1119444914              01/20

Printed on paper containing 75% recycled fibre content minimum

Printed in the UK by the APS Group on behalf of the Controller of Her Majesty’s
Stationery Office
To:   The Right Hon. Thérèse Coffey MP, Secretary of State for Work and Pensions

      The Right Hon. Jesse Norman MP, Financial Secretary to the Treasury

I am pleased to present my report on the potential effects on the National Insurance
Fund of the draft Social Security Benefits Up-rating Order 2020 and the draft Social
Security (Contributions) (Rates, Limits and Thresholds Amendments and National
Insurance Funds Payments) Regulations 2020.

This report is made in accordance with section 142(1) of the Social Security
Administration Act 1992, as amended by the Social Security Contributions (Transfer
of Functions, etc.) Act 1999 and sections 150(8), 150A(5) and 151A(6) of the Social
Security Administration Act 1992.

Martin Clarke
Government Actuary
January 2020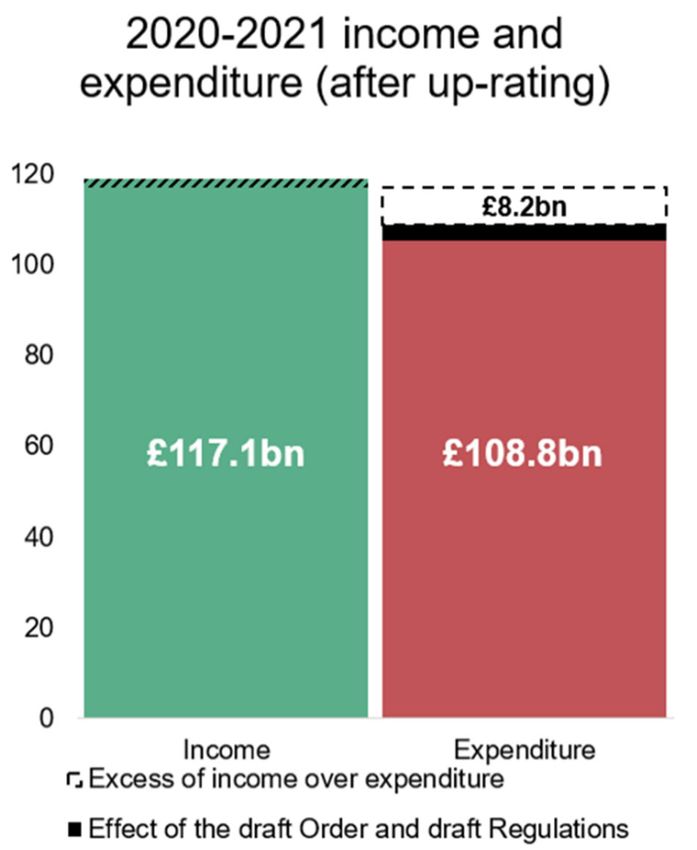
Contents
      Executive summary                                                                                        8

      Principal estimates for receipts, payments and the Fund balance                                        13

      Variant estimates for receipts, payments and the Fund balance                                          18

                     Revised 2019-2020 estimates                                                              21
                     Main benefit rates                                                                       23
                     Main features of the contribution system                                                 26
                     Key assumptions                                                                          28
                     Data, methodology and other assumptions                                                  32
                     NICs split by NIF and NHS                                                                45
                     Variant projections of the Fund to 2024-2025                                             46

At GAD, we seek to achieve a high standard in all our work. We are accredited under the Institute and Faculty of
Actuaries’ Quality Assurance Scheme. Our website describes the standards we apply.
Executive summary
1.1 This report sets out my opinion of the effect on the Great Britain National
Insurance Fund (“the Fund”) of the proposed up-rating of contributory benefits
announced in a written ministerial statement on 4 November 2019 and changes
to the National Insurance Contributions (NICs) rates, limits and thresholds as set
out in the:
draft Social Security Benefits Up-rating Order 2020 (“the draft Order”)
draft Social Security (Contributions) (Rates, Limits and Thresholds
Amendments and National Insurance Funds Payments) Regulations 2020
(“the draft Regulations”).
1.2 The main results of this report show the:
impact of the draft Order and the draft Regulations on the Fund in the
financial year 2020-2021
projected financial position of the Fund to 2024-2025
balance of the Fund as a proportion of benefit payments
1.3 This report does not consider the Northern Ireland National Insurance Fund.
Impact of the draft Order and the draft Regulations on the
Fund in 2020-2021
1.4 The draft Order is estimated to
increase benefit expenditure by £3.4
billion and the draft Regulations are
estimated to reduce contribution
income by £2.0 billion. These effects
are determined relative to the position
were there to be no changes in
benefit rates and contribution rates,
limits and thresholds in 2020-2021.
1.5 Allowing for these changes, receipts
to the Fund in 2020-2021 are
estimated to exceed payments made
by £8.2 billion, increasing the balance
in the Fund between 31 March 2020
and 31 March 2021. The estimated
Fund balance as at 31 March 2021 is
£44.9 billion.
8
Projected financial position of the Fund to 2024-2025
Principal projections
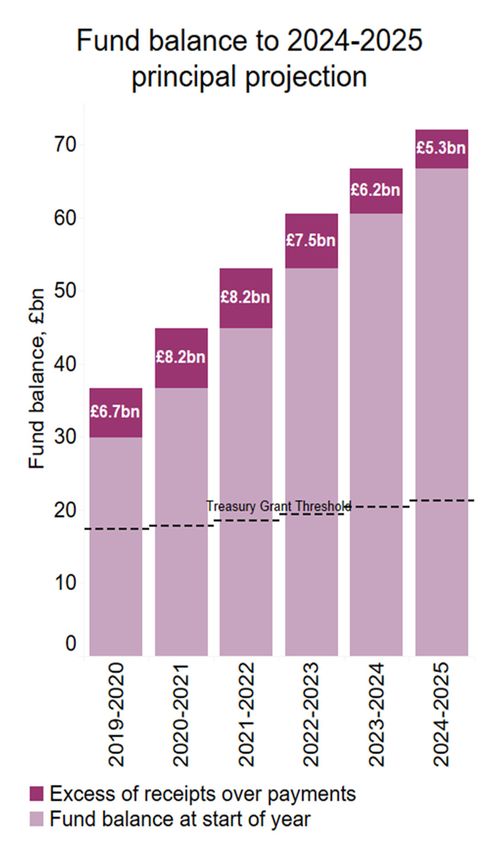
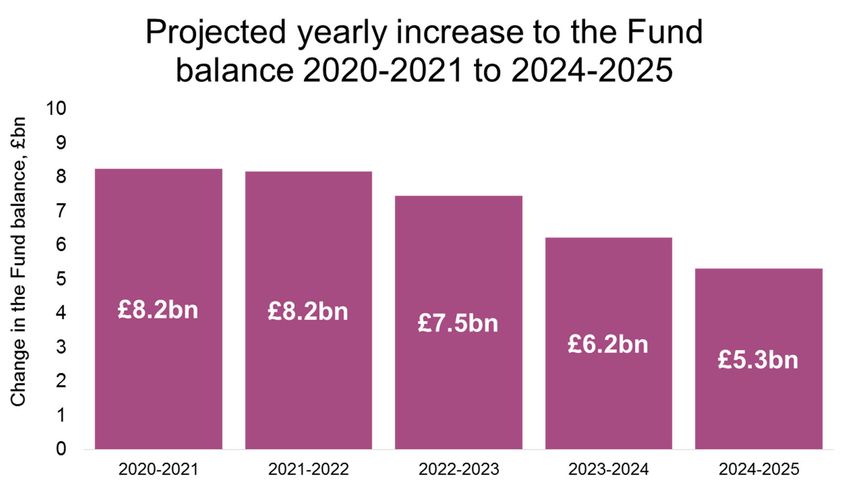
1.6 The projections to 2024-2025 show that, under the principal assumptions, the
balance of the Fund is projected to increase throughout this period as
contribution income is expected to exceed benefit expenditure in each year.
1.7 A more detailed breakdown of these projections split by type of payment from,
and receipt to, the Fund is set out in Section 2 of this report.
1.8 Longer term projections of the Fund (up to 2080) can be found in my
Quinquennial Review of the Fund as at April 2015, published on 19 October
20171. Although the Fund balance is projected to increase in every year up to
2024-2025, over the longer term benefit expenditure is expected to exceed NICs
income primarily as a result of
an increasing old-age dependency ratio
a projected increase in the average state pension benefit payable as
individuals start to receive the new state pension
and increases in the standard rate of state pension benefits arising from
the ‘triple-lock’ policy
1
https://www.gov.uk/government/publications/government-actuarys-quinquennial-review-of-the-national-
insurance-fund-as-at-april-2015
9
Balance of the Fund as a proportion of benefit payments
1.9 A payment of a Treasury Grant2 is usually made if the balance of the Fund is
projected to fall below one-sixth (16.7%) of estimated annual benefit expenditure
(including redundancy receipts). A Treasury Grant was last paid in the 2015-
2016 financial year.
1.10 The projections in this report
indicate that the estimated
2020-2021 end-year Fund
balance (£44.9 billion) will be
just over 40% of estimated
benefit expenditure (£107.1
billion including redundancy
payments) and that this
proportion will remain above
one-sixth up to and including
2024-2025. This suggests
Treasury Grants will not be
required in this period.
Variant projections
1.11 The estimates of receipts and
payments and the Fund
balance are based on various
assumptions and are sensitive
to some of these.
1.12 In particular, the estimates of
contribution income are
sensitive to earnings growth
assumptions.
2
A ‘Treasury Grant’ is a payment into the Fund from money voted by Parliament as permitted under
Section 2 of the Social Security Act 1993. HM Treasury may determine the size of such payments
provided that they do not exceed a certain percentage (17%) of benefit payments for the financial year
concerned as estimated by the Government Actuary or Deputy Government Actuary.
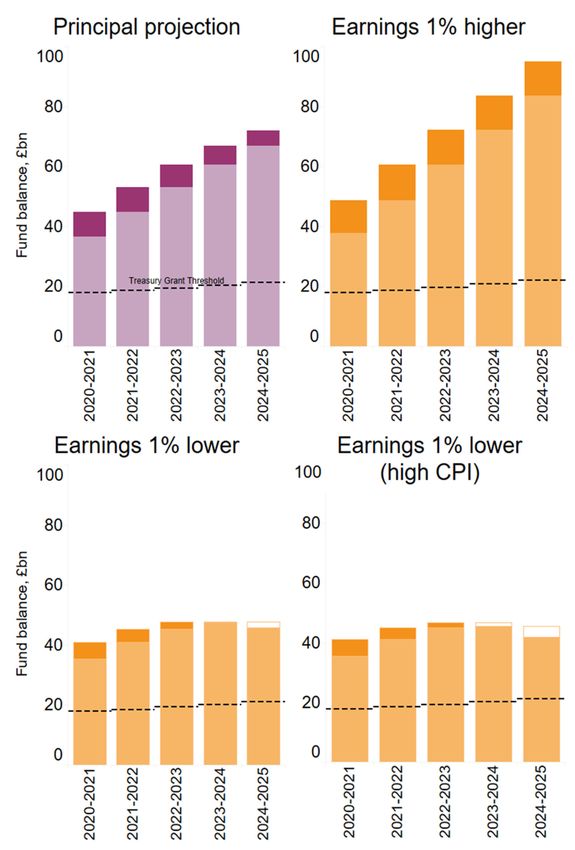
101.13 The charts below illustrate the sensitivity of the results to earnings growth
assumptions. Section 3 of this report provides more detail on these variant
estimates and how the estimates are sensitive to other assumptions too.
11Professional standards and limitations
1.14 This work has been carried out in accordance with the relevant actuarial
professional standards TAS 100 and ASORP1 issued by the Financial Reporting
Council (FRC). The FRC sets standards for actuarial work in the UK.
1.15 This report has been prepared for Parliament in accordance with the Social
Security Administration Act 1992. It is not appropriate for any other purpose. No
other person or third party is entitled to place any reliance on the contents of this
report and GAD has no liability to any other person or third party for any act or
omission taken, either in whole or in part, on the basis of this report.
12Principal estimates for receipts,
payments and the Fund balance
2.1 Table 2.1 below sets out my estimates of receipts and payments of the Fund for
2019-2020 and 2020-2021 allowing for the draft Order and the draft Regulations.
Table 2.1 – Estimated receipts and payments and statement of balances of the Fund
Great Britain, £ million 2019-20201 2020-2021
Receipts
Contributions 112,914 116,724
Less recoveries of statutory 2,589 2,643
payments (and abatements)
Net contribution income 110,325 114,081
Treasury Grant 0 0
Compensation from Consolidated Fund for 2,241 2,632
statutory payments recoveries
Income from investments 261 368
State scheme premiums 25 0
Other receipts 0 0
Total receipts2 112,852 117,081
Payments
Benefits At present rates 104,326 103,461
Increase due to proposed 3,360
changes
Total 104,326 106,821
Administration costs 768 791
Redundancy fund payments (net) 3 304 318
Transfer to Northern Ireland 564 725
Other payments 176 180
Total payments 2 106,139 108,834
Statement of balances
Balance at beginning of year4 29,935 36,648
Excess of receipts over payments 6,713 8,247
Balance at end of year 2 36,648 44,895
Balance at end of year as percentage of 35.0% 41.9%
annual benefit payments5
1 These estimates update those in my report in January 2019 reflecting the latest accounts of the Fund and other
more recent information. A breakdown and analysis of this change is provided in Appendix A.
2 Figures may not sum to totals shown due to rounding.
3 Redundancy payments are shown net of redundancy recoveries, as provided by the Insolvency Service.
4 The balance at 31 March 2019 is taken from the published accounts of the Fund for the year 2018-2019.
5 Percentages of benefit payments allow for net redundancy payments
13Estimates for 2020-2021
Benefit expenditure
2.2 The proposed measures in the draft Order increase the rates of social security
benefits paid from the Fund from April 2020. The basic state pension increases
from £129.20 per week to £134.25 per week and the full amount of the new state
pension increases from £168.60 per week to £175.20 per week. Appendix B sets
out fuller details of all the main rates of the benefits paid from the Fund before
and after the proposed measures.
2.3 I estimate that the increase in benefit expenditure in 2020-2021 as a result of the
proposed measures in the draft Order will be £3.4 billion, taking estimated
expenditure on the relevant benefits from £103.3 billion to £106.7 billion. Table
2.2 overleaf shows this estimate, and the effect of the draft Order, split by benefit
type. These estimates have been calculated using the data, methodology and
assumptions set out in Appendices D and E.
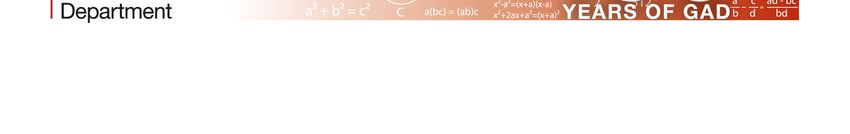
NIF benefit expenditure
120
100
Working-age benefits
80
Expenditure (£bn)
60 New state pension
40 Additional pension
20 Basic state pension
0
2020-2021 after up-rating
14Table 2.2 - Benefit expenditure and the effect of the draft Order in 2020-2021
Great Britain Estimated Estimated total Estimated extra Estimated total
total benefit benefit payments benefit
benefit payments in in 2020-2021 as a payments in
payments 2020-2021 result of the draft 2020-2021 after
£ million in 2019- before the draft Order the draft Order
2020 Order
New state pension1 10,901 13,810 498 14,309
Basic state pension2 69,634 66,398 2,371 68,768
Additional pension 18,312 17,775 409 18,184
Incapacity benefit 2 1 0 1
Widows’/bereavement
243 195 3 198
benefits
Contributory employment
4,406 4,435 70 4,505
and support allowance
Contribution-based
101 109 2 111
jobseeker’s allowance
Maternity allowance 407 424 7 431
Bereavement support
193 187 0 187
payment
Total of benefits covered
104,199 103,334 3,360 106,694
by the draft Order3
Guardian’s allowance4 2 2 0 2
Christmas bonus 125 125 0 125
Total of benefits not
covered by the draft 127 127 0 127
Order3
Total benefits3 104,326 103,461 3,360 106,821
1 Includes amounts of protected payments. The figure for the estimated extra payment in 2020-2021 includes
around £7m in respect of the cost of up-rating of protected payments in payment as at April 2020, effected by
the draft Social Security Benefits Up-rating Order 2020, and around £1m in respect of the cost of revaluing
protected payments which will come into payment during 2020-2021, effected by the State Pension (Revaluation
for Transitional Pensions) Order 2020. This latter Order does not strictly need to be reported on, however it is
immaterial relative to the total cost of up-rating.
2 Includes expenditure on graduated retirement benefit, existing increments and deferral lump sums (which
capture lump sums in respect of both deferred basic state pension and deferred additional pension).
3 Figures may not sum to totals due to rounding.
4 The functions of the Secretary of State under Part 10 of the Social Security Administration Act 1992 (review and
alterations of benefits: Great Britain) so far as relating to guardian’s allowance were transferred to the Treasury
by section 49(3) of the Tax Credits Act 2002. Guardian’s allowance will be up-rated by a separate Statutory
Instrument made by the Treasury.
15Contribution income
2.4 The proposed measures in the draft Regulations increase some of the thresholds
used to determine the amount of earnings or profits that NICs are payable on.
The primary threshold increases from £166 per week to £183 per week and the
secondary threshold increases from £166 per week to £169 per week. Similar
changes apply to the small profits threshold and lower profits limit. Appendix C
sets out fuller details of the main features of the Fund’s contribution system.
2.5 I estimate that the effect of the measures proposed in the draft Regulations will
be a decrease in contribution income in 2020-21 of £2.0 billion. A breakdown of
this estimate by contribution type is shown in Table 2.3 overleaf. The effect of
changes for Classes 2 and 4 are generally not observable due to the delay
between when contributions are accrued and the date that they go on to be paid.
These estimates have been calculated using the data, methodology and
assumptions set out in Appendices D and E.
16Table 2.3 - Contribution income and the effect of the draft Regulations in 2020-
20211
2020-2021 contribution income estimates
Great 2019-2020 Before the Impact of Impact Impact of the After the
Britain contribution draft changes in of draft draft
income Regulations limits and changes Regulations Regulations
£ million estimates thresholds in rates
Class 1 108,802 114,396 (2,034) 0 (2,034) 112,361
Class 1A
1,410 1,484 0 0 0 1,484
and 1B
Class 2 365 375 0 0 02 375
Class 3 67 67 0 0 03 67
Class 4 2,271 2,436 0 0 02 2,436
Total4 112,914 118,758 (2,034) 0 (2,034) 116,724
1 Table 2.3 shows contribution payable to the Fund. These are based on estimates of total NICs including those
allocated to the NHS. The total NICs estimates split by NIF and NHS contributions are set out in Appendix F.
2 There is no impact in 2020-2021 due to the delay between when contributions are accrued and the date they are paid.
3 There is a small positive impact, but it is estimated to be less than £1 million.
4 Figures may not sum to totals shown due to rounding.
Projections to 2024-2025
2.6 Table 2.4 below provides projections for the period to 2024-2025, calculated
using the data, methodology and assumptions set out in Appendices D and E.
Table 2.4 – Fund projections from 2018-2019 to 2024-2025
Great Britain, 2018- 2019- 2020- 2021- 2022- 2023- 2024-
£ million 20191 2020 2021 2022 2023 2024 2025
Total receipts 108,917 112,852 117,081 121,256 125,706 130,330 135,245
Total payments 103,232 106,139 108,834 113,103 118,251 124,112 129,941
Excess of receipts
5,714 6,713 8,247 8,153 7,455 6,218 5,303
over payments
Balance in fund at
29,935 36,648 44,895 53,048 60,503 66,721 72,024
end of year
Balance at end of
year as a
29.5% 35.0% 41.9% 47.7% 52.0% 54.6% 56.3%
percentage of
benefit payments
1 Figures for 2018-2019 are from the Fund accounts.
17Variant estimates for receipts,
payments and the Fund balance
3.1 The estimates provided in this report depend on assumptions made about the
future. In particular the Fund balance in the short-term is sensitive to:
the level of earnings increases
CPI inflation
employment levels
3.2 It is also possible that actual payments and receipts will differ from the estimates
provided due to limitations in the models used to calculate the estimates.
3.3 This section provides projections based on variant assumptions to demonstrate
how different experience could affect the Fund balance.
Risks to the Fund balance at 31 March 2021
3.4 Future contribution income could vary significantly in the short-term as a result of
changes in employment numbers or general earnings increases. Benefit
expenditure over the same timescale tends to be more predictable as the
number of beneficiaries is more closely linked to population numbers, which tend
to be less volatile than the numbers in employment.
3.5 Table 3.1 shows the effects of changes in earnings increases and employment
levels on contribution income for the Fund for the years 2019-2020 and 2020-
2021. Varying these assumptions would not be expected to affect benefit
expenditure significantly for these years as the rates at which benefits are
payable in these years are now known.
18Table 3.1 - Effect on contribution income of variant assumptions (£ million)
Variant assumption Effect on Effect on Approximate
income in income in effect on the
2019-2020 2020-2021 31 March 2021
Fund balance
1% lower employee earnings
(1,201) (2,676) (3,877)
increases
1% higher employee earnings
1,214 2,683 3,897
increases
Lower GB number of employees
0 (742) (742)
by 200,000 in 2020-21 only
Higher GB number of employees
0 742 742
by 200,000 in 2020-21 only
3.6 The effect of a change to both the number of employees and earnings increases
can be estimated by adding together the effect of the change in employees only
and the effect of the change in earnings increases only.
Variant 5-year projections
3.7 I have also prepared variant estimates for the projected cash flow and balance of
the Fund for the 5-year projections to illustrate the sensitivity of the estimates to
economic assumptions.
3.8 These variant projections are shown in the charts in the executive summary.
Details of the figures underlying these charts are provided in Appendix G.
3.9 The variant scenarios considered assume that:
earnings increases are one percentage point higher than the principal
assumption each year (“1% higher earnings increases”)
earnings increases are one percentage point lower than the principal
assumption each year (“1% lower earnings increases”)
earnings increases are one percentage point lower than the principal
assumptions each year and CPI inflation is half a percentage point higher
than earnings growth (“low earnings, high CPI”).
3.10 The “low earnings, high CPI” scenario provides for high CPI relative to earnings
increases. In all projection years this results in a CPI assumption that is higher
than that assumed under the principal projections. Further details of these variant
assumptions are provided in Appendix D.
193.11 As the Fund cash flows are particularly sensitive to changes in earnings growth,
the variants focus on such changes. Changes in earnings growth have a direct
impact on the level of contributions received. Benefit expenditure is also affected
by changes in earnings growth and how it compares to increases in CPI inflation,
in respect of the new State Pension benefits and pre-2016 basic State Pension
benefits, due to the triple lock mechanism.
3.12 The projections of the Fund to 2024-2025 are sensitive to the CPI assumptions.
The CPI assumptions underlying these projections display a strong reversion to
the 2% CPI policy target. The projections would be different if this target is not
achieved.
3.13 Although the Fund is sensitive to earnings increases, earnings growth would
need to be significantly lower than assumed, or other factors would also need to
change, for a Treasury Grant to be required by 2024-2025. I have calculated that
reducing earnings growth assumptions only, earnings growth would need to be
around 2 percentage points lower than the assumptions used to produce the
principal projection each year to produce a scenario where a Treasury Grant is
required for the first time in 2024-2025.
Other areas of uncertainty
3.14 New state pensions have only been payable for a few years and so the estimates
of expenditure on new state pensions (including protected payments) are based
on more limited data than other expenditure. If our estimates of new state
pension expenditure were increased or lowered by around 2% then cumulative
expenditure over the 5 year projection period could be around £2.5 billion higher
or lower than expected.
3.15 The variant projections are purely illustrations of the sensitivity of the results to
economic assumptions. They are not intended to show extremes. A material
change in conditions such as, for example, a significant reduction in employment
rates causing a reduction in contribution income, could result in future experience
being materially different from any of the variant projections shown.
20Revised 2019-2020
estimates
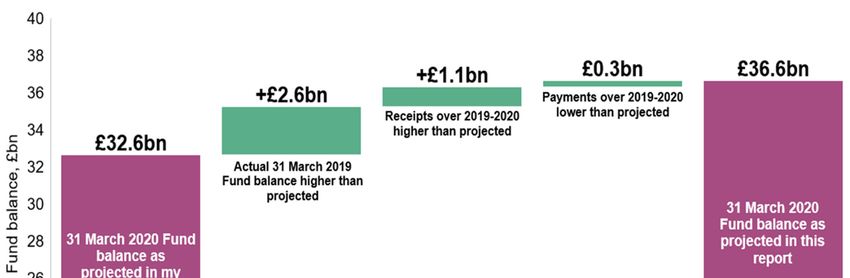
The 2019-2020 estimates shown in Table 2.1 differ from the estimates for the
same period included in my report of January 2019.
In particular the estimated balance of the Fund as at 31 March 2020 of
£36.6 billion differs from that estimated in my report from January 2019 of
£32.6 billion.
This change is primarily due to the updated estimates providing for
the actual Fund balance as at 31 March 2019 of £29.9 billion being £2.6
billion higher than that estimated in my report last year (£27.3 billion)
an increase in 2019-2020 receipts of £1.1 billion, primarily due to the
adoption of revised economic assumptions which assume higher
cumulative earnings increases and higher employment, as produced by
the Office for Budget Responsibility (see Appendix D); and
the estimate of the 2019-2020 transfer to the Northern Ireland National
Insurance Fund reducing to £564 million in this year’s report from £737
million in last year’s report. This primarily reflects contribution income to
the Northern Ireland Fund being higher than estimated in 2018-2019,
relative to a more limited increase in contribution income to the Great
Britain Fund.
21The table below sets out a detailed breakdown of the 2019-2020 estimates in
Table 2.1 of this report with those provided in Table 5.1 of last year’s report.
Great Britain 2019-2020 estimates in 2019-2020 estimates in
Table 2.1 of this report Table 5.1 of last year’s
£ million Report
Receipts
Contributions1 112,914 111,477
Less recoveries of statutory 2,589 2,771
payments (and abatements)
Net contribution income3 110,325 108,706
Treasury Grant 0 0
Compensation from Consolidated 2,241 2,760
Fund for statutory payments
recoveries
Income from investments 261 305
State scheme premiums 25 0
Other receipts 0 0
Total receipts3 112,852 111,771
Payments2
Benefits 104,326 104,523
Administration costs 768 743
Redundancy fund payments (net) 304 295
Transfer to Northern Ireland 564 737
Other payments 176 188
Total payments3 106,139 106,486
Excess of receipts over payments3 6,713 5,285
1 The increase of £1.4 billion in contributions is due to an upward revision in assumed cumulative earnings
growth up to 2019-20 and employment figures, and updates to contribution modelling using more recent
information sources.
2 The decrease of £0.35 billion in payments is due largely to revised assumptions and modelling of benefits
resulting in lower projected expenditure.
3 Figures may not sum to totals due to rounding.
22Main benefit rates
Proposed changes to benefits
The draft Order proposes increasing the rates of some social security benefits
paid from the Fund from April 2020. The most significant benefit paid from the
Fund is state pension. The proposed up-rating of these is described below.
Impact of draft Order on state pension amounts
Under current legislation both the basic state pension (for those reaching
State Pension age (SPa) prior to 6 April 2016) and amounts up to the full rate
of the new state pension (for those reaching SPa on or after 6 April 2016)
must be up-rated by at least the growth in earnings.
However the government has committed to up-rating the basic state pension
and the full rate of the new state pension annually by the highest of growth in
average weekly earnings (AWE), prices (CPI) or 2.5%, referred to as “triple
lock”.
The annual increase in the level of CPI to September 2019 was 1.7% and
AWE increase over the year to May-July 2019 was 3.9%. Therefore, the result
of the triple lock is that the proposal is to up-rate the basic state pension and
the full rate of the new state pension from April 2020 by 3.9%, subject to the
appropriate rounding conventions.
The draft Order also proposes increasing other components of the pre-April
2016 state pension, including earnings-related additional pensions (under the
state earnings-related pension scheme (SERPS), the state second pension
(S2P) and graduated retirement benefit) by 1.7%, in line with the September
2019 CPI increase. The draft Order also proposes increasing amounts in
excess of the full rate of the new state pension (protected payments) and
expenditure on state pension deferral (increments) in line with the CPI
increase.
The financial effects of the up-rating of benefits provided for in the draft Order
are shown in Section 2.
Full details of the rates of benefits provided from the Fund are shown in the
table below.
23Weekly rate
Weekly rate proposed
All figures in £s
in 2019-2020 from April
2020
State pension
New state pension1 168.60 175.20
Category A or B (paid to individuals over SPa as at 5 April 2016 based on their
129.20 134.25
own contributions or those made by a deceased spouse or civil partner)2
Category BL (paid to an individual over SPa as at 5 April 2016 based on their
77.45 80.45
spouse or civil partner’s contributions while the spouse/civil partner is alive)3
Graduated retirement benefit (unit) 0.1416 0.1440
Bereavement benefits4
Bereavement Support Payment (lump sum standard rate) 2,500.00 2,500.00
Bereavement Support Payment (lump sum higher rate) 3,500.00 3,500.00
Bereavement Support Payment (monthly payments standard rate) 100.00 100.00
Bereavement Support Payment (monthly payments higher rate) 350.00 350.00
Widowed parent’s allowance (maximum rate) 119.90 121.95
Employment and Support Allowance (contributory)5
Personal allowance (age 25 or over) 73.10 74.35
Work-related activity component 29.05 29.55
Support component 38.55 39.20
Jobseeker’s Allowance (contribution-based)6
Personal benefit for those aged 18 to 24 57.90 58.90
Personal benefit for those aged 25 and over 73.10 74.35
Maternity Allowance7 148.68 151.20
Statutory Maternity Pay, Statutory Paternity Pay, Statutory Adoption Pay,
Statutory Shared Parental Pay and, from April 2020, Statutory Parental
Bereavement Pay
Standard rate7 148.68 151.20
Guardian’s allowance
First child/other children 17.60 17.90
Increases for the children of widows, widowers, retirement pensioners
and those on long-term rate and higher short-term rate of incapacity
benefit and recipients of Incapacity Benefit over pension age
First child 8.00 8.00
Other children 11.35 11.35
Christmas bonus to pensioners (lump sum) 10.00 10.00
1 Under transitional arrangements not everyone receives this rate; awards are based on an individual’s
National Insurance record. A de minimis of 10 years of contributions applies in respect of post-April 2016
awards.
2 Proportionate rates are paid to those with proportionate contribution records. Pensioners in receipt of
Category A or B basic state pensions receive an increase of 25p per week on reaching age 80 (the Age
Addition).
3 Pensioners in receipt of Category BL basic state pensions receive an increase of 25p per week on reaching
age 80 (the Age Addition).
4 Bereavement Support Payment (lump sums and monthly payments) is available to persons whose spouse
or civil partner died on or after 6 April 2017. The higher rate is payable if the surviving spouse or civil partner
has children under age 20 in full-time education. Widowed Parent’s Allowance is available to persons
24whose spouse or civil partner died before 6 April 2017 for as long as they receive Child Benefit in respect of
a child of that spouse/civil partner.
5 Employment and Support Allowance (ESA) replaced Incapacity Benefit for new claims from 27 October
2008. The benefit contains some extra additions dependent on the circumstances of the recipients.
Everyone who satisfies the Work Capability Assessment will receive a personal allowance and either the
work-related activity component or the support component. However, from April 2017 the Welfare Reform
and Work Act 2016 provides that new ESA claimants placed in the work–related activity group will no longer
receive the work-related activity component. The process to review Incapacity Benefit claims to assess if
they can be transferred to ESA is now largely complete.
6 Unemployed people who meet certain conditions, primarily relating to the payment of NICs in the period
recently before they become unemployed, can claim contribution-based Jobseeker’s Allowance. Other
unemployed people who either exhaust or have no entitlement to the contributory benefit may receive
income-based Jobseeker’s Allowance/Universal Credit. Income-based Jobseeker’s Allowance/Universal
Credit may also be paid to recipients of contribution-based Jobseeker’s Allowance if their income-based
benefit requirements exceed the rate of contributory Jobseeker’s Allowance.
7 The first 6 weeks of Statutory Maternity Pay and Statutory Adoption Pay are paid at 90% of the recipient’s
average weekly earnings with no upper limit. Thereafter the remaining weeks (maximum 33) are paid at the
standard rate or, if lower, 90% of the recipient’s average weekly earnings. Maternity Allowance is paid to
employed women for up to 39 weeks at the amount shown or 90% of the woman’s average weekly earnings
if this calculation results in a figure which is less. The amount of Maternity Allowance a self-employed
woman may receive depends on how many Class 2 NICs they have paid in the 66 weeks immediately
preceding the week their baby is due.
25Main features of the
contribution system
Draft Regulations
The draft Regulations propose increasing some NICs rates and increasing
some of the thresholds and limits that determine the earnings on which
contributions are paid. The table below shows the changes in contribution
rates, limits and thresholds. The financial effects of the draft Regulations are
shown in Section 2.
Rate in 2019- Rate proposed
2020 from April 2020
Class 1
Lower earnings limit (LEL) £118 a week £120 a week
Upper earnings limit (UEL) £962 a week £962 a week
Primary threshold £166 a week £183 a week
Secondary threshold £166 a week £169 a week
Upper secondary threshold for under age 21 group £962 a week £962 a week
Upper secondary threshold for relevant apprentices £962 a week £962 a week
Contribution rates (NI Fund and NHS combined)
Primary On earnings between the primary
12.00% 12.00%
(employee) threshold and UEL
Reduced rate on earnings
between the primary threshold and
5.85% 5.85%
UEL for married women and
widow optants
On earnings above the UEL 2.00% 2.00%
NHS allocation included in above
– percentage of earnings between
2.05% 2.05%
the primary threshold and UEL
– percentage of earnings above
1.00% 1.00%
the UEL
Secondary On all earnings above the
13.80% 13.80%
(employer) secondary threshold
Zero-rate on earnings between the
secondary threshold and upper
0.00% 0.00%
secondary threshold for under age
21 group and relevant apprentices
NHS allocation included in above
(percentage of all earnings on
which contributions are paid for 1.90% 1.90%
employees earning above the
primary threshold)1
26Rate in 2019- Rate proposed
2020 from April 2020
Class 1A and Class 1B
Contribution rate (employer only) 13.80% 13.80%
NHS allocation included in above 1.90% 1.90%
Class 2
Flat-rate contribution £3.00 a week £3.05 a week
£6,365.00 a £6,475.00 a
Small profits threshold
year year
NHS allocation included in above (percentage
15.50% 15.50%
of contribution)
Class 3
Flat-rate contribution £15.00 a week £15.30 a week
NHS allocation included in above (percentage of
15.50% 15.50%
contribution)
Class 4
Lower Profits Limit (LPL) £8,632 a year £9,500 a year
Upper Profits Limit (UPL) £50,000 a year £50,000 a year
Contribution rate
On profits between the LPL and UPL 9.00% 9.00%
On profits above the UPL 2.00% 2.00%
NHS allocation included in above
Percentage of profits between the LPL and UPL 2.15% 2.15%
Percentage of profits above the UPL 1.00% 1.00%
1 The amount of the secondary Class 1 NICs apportioned to the NHS is calculated as the relevant
percentage (currently 1.9%) of the total earnings of those employees who earn above the primary
threshold. This is in line with the interpretation of subsections (5) and (5A) of section 162 of the Social
Security Administration Act 1992 provided to GAD by HMRC.
27Key assumptions
The key assumptions underlying the estimates in this report are population
projections and economic assumptions on future employment levels and the
rate of increase in earnings and CPI. These assumptions are set out in this
appendix alongside the variant assumptions used to show the potential impact
of using different assumptions on the projections.
The population assumptions used in this report are based on the Office for
National Statistics (ONS) 2018-based principal population projection for Great
Britain, published in October 2019.
The Chancellor of the Exchequer has announced that the Budget will take
place on 11 March 2020. OBR will produce an Economic and Fiscal Outlook
(EFO) report alongside the Budget. Until then the most recent EFO report
available is from March 2019. In the absence of a more recent forecast, for
the purpose of this report I have adopted economic assumptions that are
consistent with the central assumptions used in the March 2019 EFO.
My understanding is that both ONS and OBR have determined these
assumptions with the intention that there is no allowance for prudence or
optimism. In my view, these assumptions are reasonable for the purposes of
estimating the financial position of the Fund over the relatively short period
considered in this report and I have therefore decided to adopt them as the
principal assumptions.
One area of uncertainty relates to the nature of the UK’s long-term
relationship with the European Union. The economic assumptions underlying
the EFO incorporate broad based assumptions about the Brexit outcome, as
described in Section 3 of the EFO. My report includes variant projections to
show the impact on the Fund if other economic assumptions were adopted.
The 2020-2021 up-rating assumptions are consistent with ONS’s May to July
earnings growth index and the September 2019 out-turn estimate of CPI
inflation, which were both released after the OBR forecasts were finalised.
My previous report was published in January 2019. The estimates in that
report were also based on the most recent population projections and EFO at
the time. Those estimates were based on ONS’s 2016-based principal
population projection for Great Britain (published in October 2017) and the
OBR’s EFO published on 29 October 2018. Those assumptions are the
“UR 2019” assumptions shown in the tables in this appendix.
28Population projections
My assumptions for the number of individuals over State Pension age (SPa)
are based on the ONS 2018 principal population projections for Great Britain,
published in October 2019 as shown in Table D.1. These projections do not
include any individuals over SPa who receive a state pension while living
overseas.
These figures suggest the number of individuals over SPa is relatively stable
over the 5 year projection period. However, this timeframe coincides with a
period of increasing SPa from 65 to 66 after which the population over SPa is
expected to rise as a result of increasing life expectancy and large cohorts
reaching SPa. The effects of this on the sustainability of the Fund are
highlighted in the longer-term projections in the Quinquennial Review.
Table D.1 – Numbers over SPa at the start of the financial year
Financial UR 2020 UR 2019 Change
year people-based people-based (millions)
(millions) (millions)
2018-19 11.8 11.9 (0.0)
2019-20 11.7 11.7 (0.0)
2020-21 11.5 11.5 (0.0)
2021-22 11.7 11.7 (0.0)
2022-23 11.9 11.9 (0.1)
2023-24 12.1 12.1 (0.1)
2024-25 12.3 N/A N/A
Employment levels
My assumptions for the number of GB employees are set out in Table D.2
below:
Table D.2 - Number of GB employees
Financial UR 2020 UR 2019 Change
year (millions) (millions) (millions)
2019-20 26.9 26.9 0.1
2020-21 27.0 27.1 (0.0)
2021-22 27.2 27.2 (0.0)
2022-23 27.3 27.2 0.0
2023-24 27.4 27.3 0.1
2024-25 27.5 N/A N/A
29The assumed number of employees refers to the number of people employed
rather than the number of jobs, as one person may have more than one job.
Employees exclude the self-employed. The estimates are less sensitive to the
assumed number of self-employed people and these are in Appendix E.
The assumptions in Table D.2 have been derived by:
taking the number of UK employees from Table 1.6 of the
supplementary economy tables published alongside the OBR’s March
2019 EFO
extrapolating the EFO projection period one year further to 2024-2025
adjusting these figures approximately to reflect expected and actual
changes in the population indicated in ONS’s 2018 population
projections (OBR’s March 2019 EFO was based on ONS’s 2016
population projections)
adjusting these figures to exclude Northern Ireland employees
Increase in earnings and CPI
My assumptions for increases in earnings and CPI are set out in Table D.3
below. These figures are the Q2 earnings and Q3 CPI assumptions (taken
from tables 1.6 and 1.7 respectively of the EFO supplementary economy
tables) as up-rating each April is generally based on Q2 earnings and Q3 CPI
out-turn from the previous financial year.
Table D.3 - Annual increase in earnings and CPI
Year of April CPI Increase in earnings
up-rating UR 2020 UR 2019 Change UR 2020 UR 2019 Change
2019 2.41 2.41 0.0 2.61 2.61 0.0
2020 1.71 2.0 (0.3) 3.91 2.7 1.2
2021 1.9 2.0 (0.1) 2.9 2.8 0.1
2022 2.0 2.1 (0.1) 3.1 3.0 0.1
2023 2.0 2.1 (0.1) 3.1 3.1 0.0
2024 2.0 N/A N/A 3.2 N/A N/A
1 The increases to be applied in April 2019 and April 2020 are now determined. Last year the April
2019 increases were determined.
When projecting earnings for the purpose of estimating contribution income,
my assumption on earnings growth is taken from Table 3.10 of the EFO which
shows the average growth across the 4 quarters of the financial year. These
differ from, but are related to, the Q2 assumptions. This assumption for 2024-
2025 is set equal to the 2023-2024 assumption as the EFO only projects to
2023-2024.
30Assumptions for variant projections
The “high/low earnings” variants assume that the increase in earnings
assumptions are one percentage point higher/lower each year from and
including 2019-2020, except that the known up-rating in April 2020 is
unaffected. The “low earnings, high CPI” variant assumes the annual increase
in CPI is half a percentage point higher than (low, Q2) earnings growth, but
again the April 2020 up-rating is unchanged.
Triple Lock
“Triple lock” increases are determined as the highest of the annual growth in
average May-July earnings (AWE), September prices (CPI) and 2.5%. We
have applied this “triple lock” rule to the increase in earnings and CPI
assumptions for each individual year in our projections. For example, under
the “low earnings, high CPI” variant projection in 2023-2024 earnings is 2.1%
and CPI is 2.6% and so the “triple lock” assumption is 2.6% as this is higher
than both 2.1% and 2.5%.
31Data, methodology and
other assumptions
Contributions modelling
Earnings projection
Contributions are estimated separately for each class of NICs.
Estimates of Class 1 NICs are made by first making a projection of workforce
earnings based on:
assumed levels of UK employment in each year, together with an
assumed profile of workers by age and gender; employment numbers
are broken down between Great Britain and Northern Ireland using
ONS labour force data with an allowance for expected future
population changes
average earnings distributions, by age and gender; these were derived
using the 2015 Annual Survey of Hours and Earnings (ASHE)
produced by ONS and the Survey of Personal Incomes published by
HMRC1
assumptions on the rate of earnings growth from year to year
Total NICs income
The projection of earnings is then used to estimate the expected NICs due in
each year.
Other classes of NICs, which generate substantially lower revenues than
Class 1, are estimated using simplified models.
Class 1A and Class 1B contributions are estimated using data and projections
provided by HMRC. These are UK figures and the amount attributable to
Great Britain is taken as a percentage of the UK figure.
1
ONS and HMRC have no responsibility for the distributions adopted beyond the data that they
originally supplied to GAD.
32Class 2 and Class 4 contributions made by the self-employed are estimated in
a similar way to Class 1, but using assumptions on employment, earnings
growth and earnings distributions specifically for the self-employed. These
earnings distributions are derived solely from HMRC’s Survey of Personal
Incomes.
Class 3 contributions are a very small part of total NICs and have been
estimated approximately by assuming that the contributions received each
year are unchanged from the average amount received in the years 2016-
2017 to 2018-2019.
I have assumed that future increases in contribution limits and thresholds will
be in line with CPI increases in each year.
Modelled estimates of NICs are adjusted in line with data provided by HMRC
on actual NICs receipts up to and including 2018-2019. It is assumed that the
same adjustment factors apply in all future years. Our models do not take into
account certain detailed measures announced at successive fiscal events.
Therefore, adjustments are applied to allow for these measures based on
projections made by HMRC. Normally, these HMRC projections would be
updated regularly to reflect any interaction with other policy proposals.
However, for this report, the projections were taken from the work for OBR’s
March 2019 EFO and therefore they could not take into account any impact
from the proposed increase to the primary threshold in 2020-2021. I would not
expect this to lead to any material distortions in the results, but this will be
reviewed as part of my next report.
NICs allocation between the Fund and the NHS
The above calculations focus on making a projection of total NICs. It is then
necessary to divide these NICs between those allocated to the Fund and
those allocated to the NHS.
Class 1 contributions are split between primary Fund and NHS and secondary
Fund and NHS contributions based on data derived from end of year returns
data from the National Insurance PAYE System (NPS) database and provided
in the Earnings Limits Scan supplied by HMRC. The latest Earnings Limits
Scan provides information up to and including 2017-2018. We therefore use
this information to split the total Class 1 NICs received in 2017-2018, as
produced by our calculation model, between the different components. The
split of NICs in future years is then derived from the model adjusted so that it
is consistent with the split shown by the Earnings Limits Scan information.
For Classes 1A, 1B, 2 and 3, the NHS allocations are defined in legislation as
a fixed proportion of the total NICs payable, as set out in Appendix C.
33The NHS allocation for Class 4 contributions is different for contributions paid
on profits above and below the Upper Profits Limit. This means there is not a
constant ratio between contributions allocated to the Fund and NHS for this
class. Therefore, we use our calculation model to determine the split between
the Fund and the NHS shares of the contributions based on the assumed self-
employed earnings distribution.
Reclaimed NICs for statutory payments
Employers can reclaim a proportion of the statutory payments made to
employees, plus an element of “compensation” for small employers, from the
amounts of Class 1 NICs they pay. Statutory payments include:
Statutory Maternity Pay (SMP)
Statutory Paternity Pay (SPP)
Statutory Shared Parental Pay (ShPP)
Statutory Adoption Pay (SAP), and
from April 2020, Statutory Parental Bereavement Pay (SPBP).
In broad terms, amounts reclaimed by employers are estimated by adjusting
data on amounts reclaimed in the latest complete year (2018-2019) in line
with changes in numbers of employees, the numbers of births (or children, in
respect of adoption), rates of benefit, and (where relevant) the average
earnings of potential recipients.
The Fund receives payments from the Consolidated Fund to offset the
amounts recovered by employers (apart from the compensation element).
These payments are estimated in similar way to the amounts recovered by
employers.
Comparison with HMRC estimates
HMRC also make estimates of NICs using their own models. I have compared
my contribution estimates with those made by HMRC. My estimate of total
NICs for 2019-2020 is the same as the figure produced by HMRC to the
nearest £0.1 bn. My estimate for 2020-2021 is also very close to that of
HMRC, but a direct comparison is not possible since the HMRC estimates
(produced in March 2019) did not reflect the latest figures for the contribution
limits to be applied in 2020-2021. I will continue to liaise with HMRC in relation
to the consistency of our projections.
34Other receipts modelling
The estimates given for receipts from state scheme premiums are based on
information taken from the Fund accounts. These premiums relate to
individuals who have been contracted-out of part of the state pension, which
ceased to be possible from 6 April 2016. I have assumed that no more state
scheme premiums will be received after April 2020.
The investment income has been estimated for future years by applying an
assumed rate of investment return to the average balance in the Fund during
each future year. The investment return on the Fund is expected to be close
to the Official Bank of England Rate (Bank Rate) given that the assets of the
Fund are deposited with the Commissioners for the Reduction of National
Debt. The assumed rate of investment return is based on the OBR’s EFO
report published in March 2019.
Pension benefits modelling
Estimates of expenditure on contributory benefits are projected separately for
each of the following 6 types of benefit;
pre-2016 awards of the basic state pension
lump sums payable to those who have deferred, and are not yet in
receipt of, their basic state pension
pre-2016 awards of earnings-related additional pension (known as
SERPS or S2P)
graduated retirement benefit
post-2016 awards of the new state pension
protected payments (paid alongside new state pension)
The projection approaches adopted for each type of benefit are detailed in
paragraphs E.29 to E.76. All the projections allow for the increases in SPa
during 2019-2020.
The projections use the following data sets provided by DWP:
the “quarterly statistical extract” of state pension payments (QSE) data
set - this is a data set which sets out anonymised data for a 5% sample
of all individuals in receipt of benefits and the amount of benefit in
payment - the estimates in this report are based on the QSE relating to
payments as at 31 March 2019 - QSE data sets also include past lump
sums paid where the recipient is still in receipt of a benefit
35 the “lifetime labour market database 2” (L2) data set - this is a data set
which sets out anonymised data for a 1% sample of the population
showing past earnings and contribution record history - the estimates in
this report are based on the L2 data set as at 31 March 2016
the “forecast data” - this is DWP management data forecasting
aggregate amounts of benefit expenditure over the current financial year,
revised monthly based on actual out-turn
The projections use the following data sets published by ONS:
their 2018-based principal population projection for Great Britain
their 2008-based marital status projections for England and Wales
Once produced, the 6 separate benefit projections are adjusted so that our
2019-2020 estimates align with the forecast data. We then apply these same
adjustment factors in each future year of each projection.
The adjustment factors used to align with the forecast data are;
basic state pension: 1.00
lump sums: 1.04
additional pension: 1.025
graduated retirement benefit: 0.965
new state pension: 0.99
protected payments: 1.24
The majority of the adjustment factors are close to 1.00. There are various
reasons why I would not expect them to equal 1.00. For example the QSE
data set is only a 5% sample size and is produced close to the extract date so
does not allow for corrected payments made retrospectively where incorrect
benefit payments have initially been made.
With the exception of lump sums the above adjustment factors are based on
November 2019 forecast data. The amounts of lump sum paid each year tend
to be more volatile than ongoing pension payments and so we derive the lump
sum adjustment factor by comparing our 2019-2020 projection with the total
amount of lump sums paid over the last five years.
The discrepancy in protected payments between our projection for 2019-2020
and the forecast data (a 24% difference) is large. To develop an
understanding of the causes of this discrepancy would require more detailed
analysis and comparison of the L2, forecast data and other relevant data sets.
36Basic state pension
To project expenditure on pre-2016 awards of basic state pension, for each
projection year, we multiply together:
a projected number of people over SPa
an assumed “proportion of the population entitled” (PEnt) to any basic
state pension
an assumed “mean proportion of the standard rate” (MPnSR) payable to
those entitled to any basic state pension
an annual standard benefit rate
We carry out the above calculations separately for each age and for 5
categories of people; men, single women, married women, divorced women
and widows.
The number of men and women at each age over SPa is taken directly from
the 2018-based principal population projection for Great Britain. We then split
the numbers for women into single, married, divorced and widowed women
using ONS’s England and Wales 2008-based marital status projections.
Proportions entitled
For each age for each of the 5 categories of people we determine a PEnt
assumption for the year 2019-2020 by comparing the number of people
receiving basic state pension in the QSE data with the number of people in
the population projection. For married women we set PEnt assumptions
separately depending on whether entitlement is to Category A pension,
Category BL pension or both.
In 2018-2019 this comparison shows that for men and divorced and widowed
women the proportion entitled is close to 100% at all ages old enough to
qualify for basic state pension. For single and married women the proportion
is age related matching recent demographic trends - for example that there
were more female earners in younger generations. Based on these
observations we set PEnt assumptions as 98% for men, 96% for divorced
women, 100% for widows and age related assumptions for single women and
married women.
The same PEnt assumptions are then used in every future year of the
projection but with the age related assumption applying to those aged one
year older in each future projection year reflecting the ageing of those old
enough to qualify for basic state pension.
37Mean proportion of the standard rate
For each age for each of the 5 categories of people we determine an MPnSR
assumption for the year 2019-2020. This is done by calculating the average
amount of basic state pension received by those receiving some basic state
pension in the QSE data and express this as a proportion of the standard
benefit rate. For married women we set MPnSR assumptions separately
depending on whether entitlement is to Category A pension, Category BL
pension or both.
In 2018-2019 this comparison shows that for men and single, divorced and
widowed women the proportion entitled is between 90% and 100% at all ages
old enough to qualify for basic state pension. For married women the
proportion is age related matching recent demographic trends. Based on
these observations we set MPnSR assumptions as 97% for men, 91% for
single women, 94% for divorced women, 98% for widows and age related
assumptions for married women entitled to different categories of basic state
pension.
The same MPnSR assumptions are then used in every future year of the
projection but with the age related assumption applying to those aged one
year older in each future projection year reflecting the ageing of those old
enough to qualify for basic state pension.
Adjustments for Category D pensions and increments
Some pensioners in receipt of basic state pension are eligible for an increase
in pension up to a specified amount on reaching age 80 (the “Over 80
Pension”). This increase is not based on NICs and is not payable from the
Fund but is included and not separately identified in the QSE data. Our
projection therefore includes an adjustment to the MPnSR assumptions
described above to model the exclusion of Over 80 Pension payments from
the expenditure projections for basic state pension. These adjustments range
between a 0% and 4% reduction in the MPnSR assumption depending on the
category of person being projected. In general larger reductions are made to
those with lower MPnSR assumptions.
After calculating the MPnSR assumptions described above we make an
adjustment to those assumptions to reflect that some basic state pension
relates to increments paid to those who have previously deferred their basic
state pension and are now in receipt of it. These adjustments reflect the
proportion of basic state pension that is made up of increments as shown in
the QSE data and the different up-rating that increments attract (CPI rather
than the triple lock that applies to basic state pension).
38Apart from lump sums captured in the lump sums projections described
below, new awards in relation to those who have deferred their basic state
pension and are not yet in receipt of it are ignored.
Except for women with entitlement to Category BL pension (regardless of any
entitlement to Category A), the standard benefit rate for projection year 2019-
2020 is £129.20 per week. For women with entitlement to Category BL
pension the standard benefit rate for projection year 2019-20 is £77.45 per
week. The standard benefit rates used are up-rated in line with triple lock up-
rating implied by the economic assumptions for future projection years.
Overseas pensioners receiving basic state pension
Pensioners residing overseas are not captured in the approach to projecting
basic state pension expenditure described above as the population
projections used only cover those in GB.
The QSE data set shows that the net impact of immigration and emigration
over SPa is immaterial to the total level of overseas state pension payable.
We therefore model payment of basic state pension to overseas pensioners
separately as though this group are a closed population. This separate
projection is then added to the basic state pension projection described
above.
Payments of basic state pension to pensioners overseas (including
increments already in payment) are projected forward by running off the
existing payments shown in the QSE data set. The run off uses mortality rates
based on ONS’s 2018-based GB population projection (i.e. assuming mortality
rates for overseas pensioners are in line with those experienced
domestically). These projections do not uprate pensions for those living in
countries where up-rating is frozen.
These projections allow for Category B coming into payment to widows at an
average aggregate rate equal to 90% of the Category A pension that it derives
from and ignore Category B coming into payment to widowers and bereaved
civil partners. Apart from lump sums captured in the lump sum projections
described below, new awards in relation to those living overseas who have
deferred their basic state pension and are not yet in receipt of it are also
ignored.
Lump sums
People reaching SPa before 6 April 2016 can defer payment of their basic
state pension and take a lump sum when they bring their basic state pension
into payment. Projections are made of the amounts of lump sum payable in
the future to those still deferring their basic state pension.
39You can also read