The Population of Bristol - August 2021 Insight, Performance and Intelligence www.bristol.gov.uk/population - Bristol City Council
←
→
Page content transcription
If your browser does not render page correctly, please read the page content below
The
 Population
 of Bristol
  August 2021

Insight, Performance and Intelligence
www.bristol.gov.uk/population
The Population of Bristol - August 2021
Key population trends in the Bristol local authority area
Following a period of population decline in the post war years, the population of
Bristol stabilised in the 1990s. This was followed by a period of unprecedented
population growth through the 2000s, particularly in central areas of Bristol. Since
2016, the population has grown at a slower rate. This trend is in-line with the UK
population which last year grew at its slowest rate for 20 years.
The population of Bristol has become increasingly diverse and some local
communities have changed significantly. There are now at least 45 religions, at least
187 countries of birth represented and at least 91 main languages spoken by people
living in Bristol.
In the 10 years since 2010 the total population of Bristol local authority is estimated
to have increased by 42,800 people an increase of 10.1%, this compares to an
England and Wales increase of 7.2% over the same decade. The growth in population
includes a large increase in students living in Bristol during term time.
The large increase in the population of Bristol since 2002 can be attributed to a
number of factors including a significant increase in births, a decrease in deaths and
an increase in net-international migration. Since 2016, however, population growth
has slowed due to falling numbers of births and lower levels of net migration, mainly
due to an increase in international emigration. Natural change remains the main
driver of population change in Bristol.
Nationally, EU net migration has fallen since the EU Referendum in 2016, although
more EU citizens still arrive long-term than leave. The change has mostly been driven
by a decrease in EU citizens coming to the UK to work, an increase in the number of
EU citizens leaving the UK, together with an increase in the number of non-EU
citizens coming to the UK for work and study.
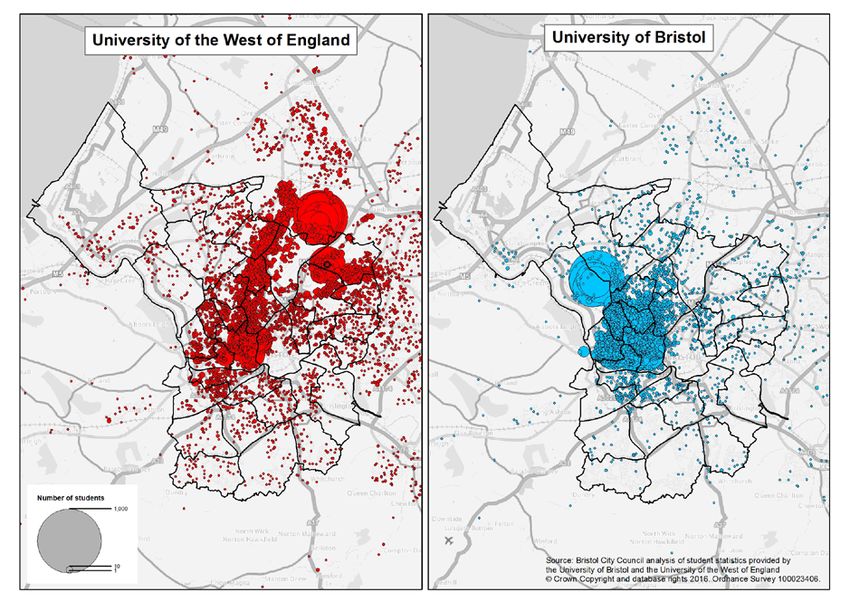
In 2019/20 there were 58,100 students in total registered at the two main Bristol
universities. In the 5 years up to 2019/20 there was a 20% (+9,800) increase in
university student numbers. The majority of this growth can be accounted for by an
increase in full time students at the University of Bristol.
Future population projections are uncertain. Current events – including the Covid-19
pandemic, leaving the EU, the new Hong Kong British National Overseas visa and the
global climate emergency – and their potential impacts on our economy and society,
are not reflected in the current 2018-based population projections. However, in the
event that pre-pandemic trends were to continue, the total population of Bristol
would be projected to increase by 15% over the 25 year period (2018-2043) to reach
a total population of 532,700 by 2043.
1
Contents

1.   Introduction ........................................................................................................................ 4
2.   Coronavirus and the impact on population estimates ....................................................... 5
3.   Current population ............................................................................................................. 6
     Mid-2020 Population Estimates ......................................................................................... 6

     Population by age ............................................................................................................... 7

     Population by ward ............................................................................................................. 9

4.   Recent population trends ................................................................................................. 10
     Bristol trends..................................................................................................................... 10

     Population trends by age .................................................................................................. 11

     Components of population change .................................................................................. 13

     Small area population trends ........................................................................................... 18

5.   Population projections...................................................................................................... 21
     Uncertainty of population projections ............................................................................. 21

     Population projections for Bristol..................................................................................... 22

     Population projections by age .......................................................................................... 23

     Projected components of population change .................................................................. 24

     Household projections ...................................................................................................... 25

6.   Population characteristics ................................................................................................ 27
     A changing population profile .......................................................................................... 27

     Ethnic group ...................................................................................................................... 27

     Country of birth ................................................................................................................ 31

     Migrants ............................................................................................................................ 32

     Religion ............................................................................................................................. 34

     Language ........................................................................................................................... 35

     Students ............................................................................................................................ 36

     2011 Census topics ........................................................................................................... 36

7.   Other sources of population statistics .............................................................................. 38
     National Insurance Number Registrations (NINos) .......................................................... 38

                                                                     2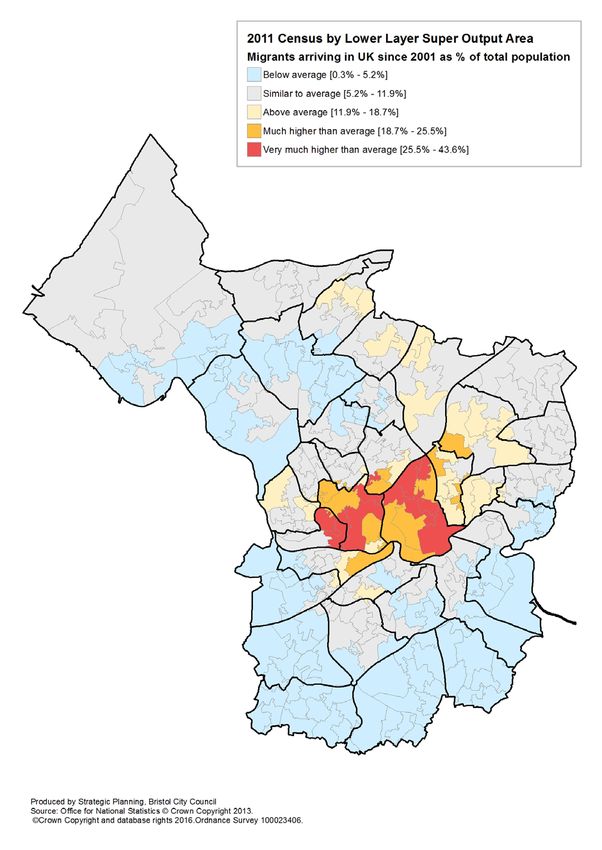
University Students ........................................................................................................... 41

8.    Population change and policy ........................................................................................... 43
9.    Conclusion ......................................................................................................................... 45
Useful links and more information .......................................................................................... 46

                                                                     3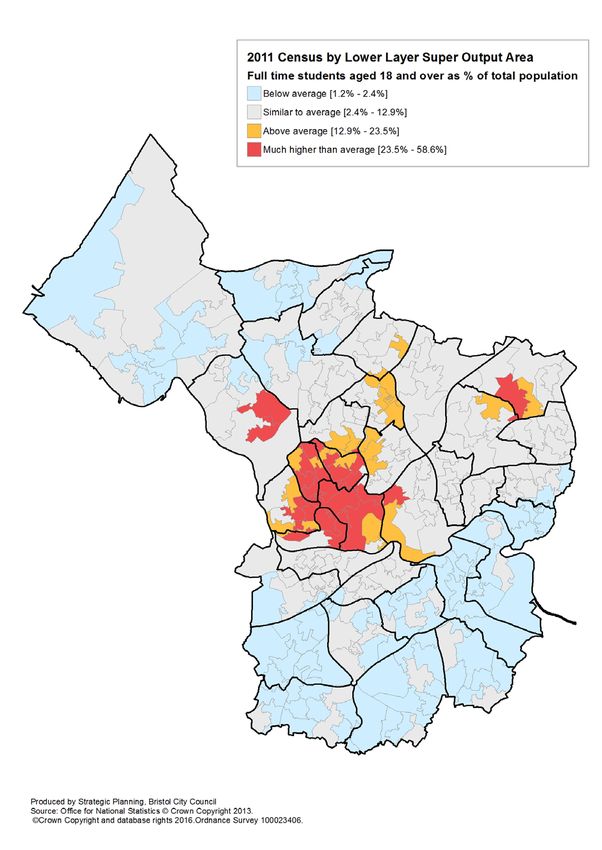
1. Introduction
1.1      The population of Bristol is estimated to be 465,900 people 1. Bristol is the largest
city in the South West and one of the ten ‘Core Cities’ in Great Britain. Following a period of
population decline in the post war years, the population stabilised in the 1990s and
increased substantially during the 2000s. Since 2016, the population has grown at a slower
rate. This trend is in-line with the UK population which last year grew at its slowest rate for
20 years. If pre-Covid-19 pandemic trends continue, Bristol’s population will increase to over
half a million usual residents by mid-2031.

1.2     The population of Bristol has become increasingly diverse. The proportion of the
population who are not ‘White British’ has increased from 12% to 22% of the total
population. In Bristol, there are now at least 45 religions, at least 187 countries of birth
represented and at least 91 main languages spoken. Census 2021 will provide a fresh picture
of the population when the results are published from Spring 2022.

1.3     Estimating and projecting the population of Bristol and areas within Bristol is
important in order to meet the needs of our changing society. Population statistics underpin
public service finances, strategic planning, Covid-19 response and recovery and the
provision of local facilities and services such as schools, hospitals and open space. The
particular requirements and characteristics of different ethnic and cultural groups also need
to be identified, so that inequalities can be addressed.

1.4      This report aims to build a picture of the population of Bristol now and in the future.
The report brings together statistics on the current estimated population of Bristol, recent
trends in population, future projections and looks at the key characteristics of the people
living in Bristol. Bristol data in the report refers to the Bristol local authority area unless
otherwise stated.

1
    ONS 2020 Mid-Year Population Estimate

                                               4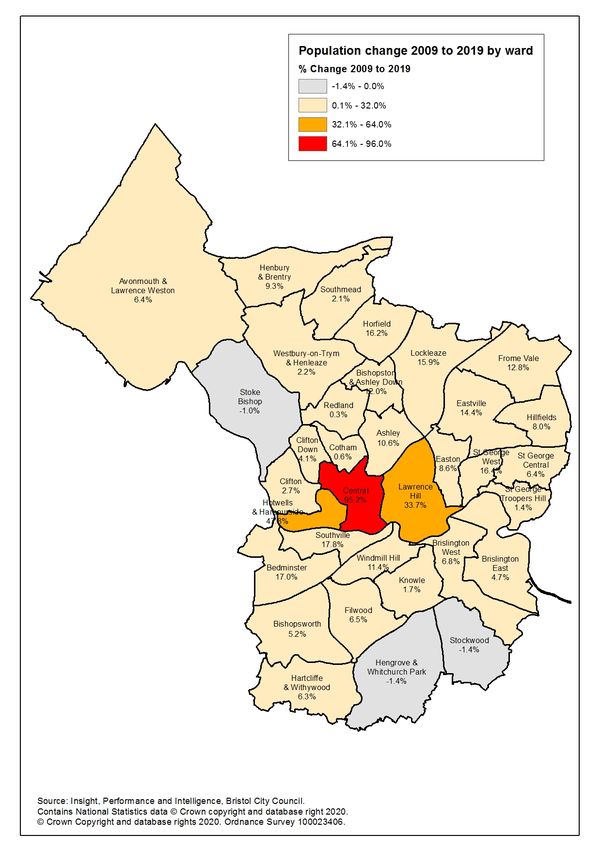
2. Coronavirus and the impact on
population statistics2
2.1 The population estimates presented in this report reflect the population of Bristol
and the UK at the end of June 2020 towards the end of the first wave of the Covid-19
pandemic. During the period between March and June 2020, the UK was in lockdown for
much of the time and these restrictions had direct impacts on population change at both
the national and local level. Events that affected the components of population change and
that feed into the population estimates include:
a “first wave” of deaths from the Covid-19 pandemic occurred during the period up
to June 2020
moving home within the UK became more difficult from 23 March 2020, however,
many moves for study had already occurred before the pandemic
international immigration became more difficult, with the Foreign and
Commonwealth Office advising against overseas travel from 17 March 2020
areas with the ‘other’ populations, such as prisoners or members of armed forces,
had fewer people joining those populations in the months up to June 2020
2.2 Estimates of the mid-year population reflect changes in long-term international
migration between July 2019 and June 2020. Historically, estimates of long-term
international migration are sourced from the Office for National Statistics’ Migration
Statistics Quarterly Report using information on UK arrivals and departures collected via the
International Passenger Survey (IPS). The IPS however was suspended in mid-March
following the restrictions imposed during the pandemic. To overcome the lack of IPS data
from March to June 2020, measures of long-term international migration were modelled to
estimate UK international migration.
2.3 The Census 2021 results for England and Wales are due to be published from Spring
2023. These will, in time, provide the most robust and comprehensive picture of the
population possible.
2
ONS Statistical Bulletin June 2021
5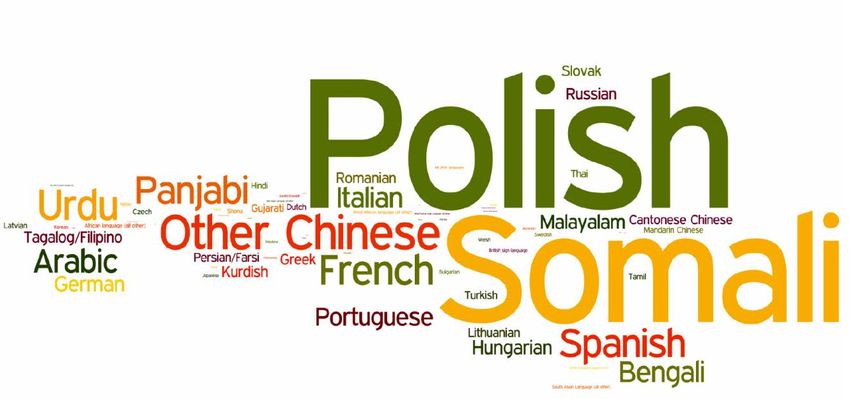
3. Current population
Mid-2020 Population Estimates

3.1     The mid-2020 population of Bristol local authority is estimated to be 465,900. Mid-
2020 Population Estimates for local authorities were published by the Office for National
Statistics (ONS) on 25 June 2021.

3.2     Within England and Wales Bristol is the 8th largest city and the 11th largest local
authority. Bristol local authority accounts for 70% of the total population of the built-up
area of the city, which is often referred to as ‘Greater Bristol’, or the ‘Bristol Urban Area’.
The population of the Bristol Urban Area is estimated to be 670,300 (mid-2019).

Figure 1. Mid-2020 Population pyramid
Source: ONS 2020 Mid-Year Population Estimates. Crown Copyright.

                80 - 84

                70 - 74
                                          Males                                   Females
                60 - 64

                50 - 54
    Age group

                40 - 44

                30 - 34

                20 - 24

                10 - 14

                  0-4
                          15         10             5             0           5         10          15
                                                        % of the population

                           Bristol Females        Bristol aales       E&W Females       E%W aales

3.3     Mid-year Population Estimates are produced for all local authorities and updated
annually using a combination of registration, survey and administrative data to estimate the
different components of population change. Persons included are those people usually
resident 3 in Bristol including students and school boarders at their term time address and
long-term migrants (i.e. coming to UK for more than a year).

3
 The estimated resident population of an area includes all those people who usually live there, regardless of
nationality. Arriving international migrants are included in the usually resident population if they remain in the
UK for at least a year. Emigrants are excluded if they remain outside the UK for at least a year.
                                                         6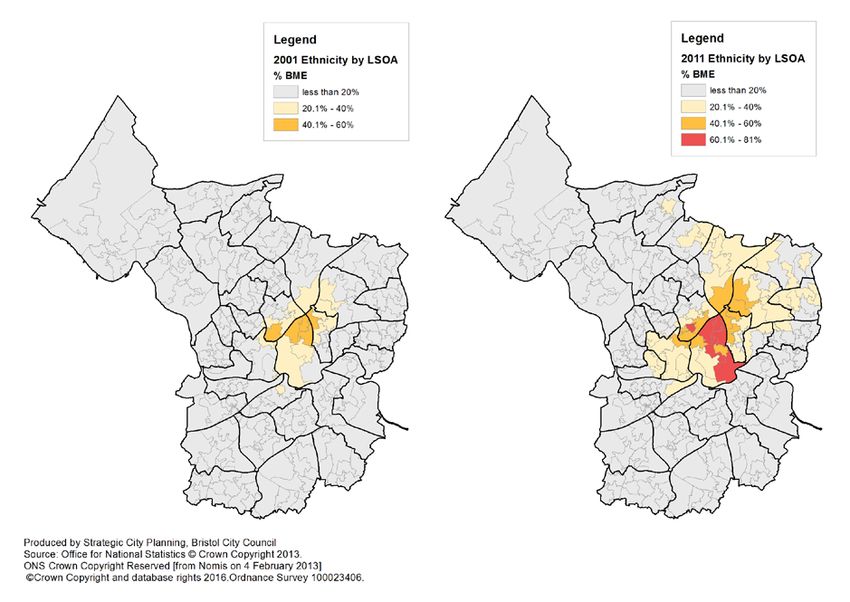
3.4    Short-term residents 4 are not included in ONS estimates of the resident population.
Estimates of short-term migration give a more complete picture of migration into and out of
an area. ONS estimate that there were around 1,400 short-term migrants living in Bristol in
mid-2017.

Population by age
3.5     Bristol has a relatively young age profile with more children aged 0-15 than people
aged 65 and over. The median age of people living in Bristol in 2020 was 32.4 years old, this
compares to the England and Wales median of 40.3 years. The profile of Bristol’s population
by five year age band and sex is illustrated in Figure 1 and estimates for broad age bands
and sex are shown in Table 1.

Table 1. 2020 Population estimates by age and sex
Source: ONS 2020 Mid-Year Population Estimates. Crown Copyright.
                                                                                          % share by
Age band                           Males              Females               Persons        age band
0-15                               44,000                41,700               85,700             18.4
16-24                              36,700                37,000               73,700             15.8
25-49                              93,500                86,500              180,000             38.6
50-64                              32,700                33,600               66,200             14.2
65 and over                        27,500                32,800               60,300             12.9
All ages                          234,300              231,600               465,900            100.0

Children
3.6     Overall, there are more children living in Bristol than people aged 65 and over.
Bristol’s 85,700 children make up 18.4% of the total population, i.e. almost 1 in every five
people living in Bristol is aged under 16.

Working age
3.7    Bristol has a higher proportion of working age (16-64 year old) people than
nationally – 69% of the total population in Bristol is of working age compared to 62% in
England and Wales. The highest proportions are amongst the 20-34 year olds which make
up almost a third 31% of Bristol’s total population compared to 20% nationally. Many of the
people in this age group will be students living in Bristol during term time.

Older people
3.8     Bristol’s 60,300 older people make up 13% of the total population, i.e. 1 in every
seven people living in Bristol is aged 65 or over. The proportion of older people is lower than
in England and Wales as a whole where 19% of the population are aged 65 and over. There
are 9,000 people living in Bristol aged 85 and over.

4
 Short term residents are anyone born outside of the UK who has stayed, or intends to stay, in the UK for a
period of three months or more but less than twelve months.
                                                      7
Figure 2. Mid-2019 Ward population estimates by broad age band
Source: ONS Small Area Population Estimates Crown Copyright
For estimates of the total population see Table 5
Children (0-15 year olds) Working Age (16-64 year olds) Older People (65 years and over)
0 5,000 10,000 15,000 20,000
Central 1,300 19,800 700
Avonmouth & Lawrence Weston 4,800 13,200 3,400
Westbury-on-Trym & Henleaze 4,200 10,900 4,800
Lawrence Hill 5,000 13,300 1,300
Ashley 3,400 14,400 1,300
Hartcliffe & Withywood 5,100 11,200 2,600
Hengrove & Whitchurch Park 3,400 10,000 3,600
Eastville 2,800 10,100 1,600
Easton 2,800 10,000 1,300
Filwood 3,500 8,700 1,600
Windmill Hill 2,500 10,200 1,100
Frome Vale 2,400 8,800 2,400
Clifton 1,200 10,600 1,600
Horfield 2,300 9,400 1,600
Bishopston & Ashley Down 2,500 9,600 1,200
Lockleaze 3,000 8,700 1,600
Knowle 2,900 8,400 2,000
Redland 2,500 9,100 1,500
Southville 1,900 9,800 1,200
St George Central 2,500 8,600 1,800
Hillfields 3,000 8,300 1,600
Southmead 2,900 7,800 2,000
Bedminster 1,900 8,900 1,700
Henbury & Brentry 2,700 7,600 2,200
Stoke Bishop 1,900 7,500 2,500
Brislington East 2,400 7,600 1,800
Cotham 1,100 9,700 1,000
Clifton Down 900 9,600 1,000
Brislington West 2,100 7,900 1,500
Bishopsworth 2,300 7,000 2,100
Stockwood 2,100 6,700 2,500
St George West 1,200 4,600 800
Hotwells & Harbourside 400 5,400 600
St George Troopers Hill 1,100 3,700 1,000
8Population by ward
3.9 Bristol City Council has 34 wards, represented by 70 councillors. Five wards have 3
councillors, 26 wards have 2 councillors and 3 wards have 1 councillor.
3.10 The number of electors living in each ward per councillor is fairly similar across the
city with 4,787 electors per councillor on average in 2019. However, the number of
residents living in each ward differs substantially. As a result, statistics presented by ward
should be treated with care and rates should be used for comparison purposes rather than
counts or numbers.
3.11 The latest population estimates by ward are for mid-2019. The largest ward in
Bristol is Central ward with an estimated population of 21,800 people and the smallest is St
George Troopers Hill with 5,800 usual residents.
3.12 The age profile within each ward also varies significantly. Figure 2 shows the
population within each ward broken down by broad age group. Wards where more than a
quarter of the population is aged under 16 include Hartcliffe and Withywood (27%),
Lawrence Hill (26%), and Filwood (25%).
3.13 The wards with the lowest proportions of children are all in areas in the inner west
and central areas of Bristol including Central (6%), Hotwells and Harbourside (6%), Clifton
Down (8%), Clifton (9%) and Cotham (9%). These wards have the highest proportions of
people aged 16-24, including a large number of students, as well as low proportions of
people aged 65 and over.
3.14 The wards with the highest proportions of working age people are all in the inner
west and central areas of Bristol. In four wards more than 80% of the usually resident
population are of working age – Central (91%), Hotwells & Harbourside (85%), Clifton Down
(84%) and Cotham (83%).
3.15 The highest proportions of older people (aged 65 and over) are in Westbury-on-Trym
& Henleaze (24%), Stockwood (22%), Stoke Bishop (21%) and Hengrove & Whitchurch Park
(21%). More than a fifth of the total population in these wards is aged 65 and over.
94. Recent population trends
Bristol trends
4.1 Following a period of population decline in the post war years, the population of
Bristol stabilised in the 1990s. This was followed by a period of unprecedented population
growth through the 2000s, particularly in central areas of Bristol. Since 2016, the population
has grown at a slower rate. This trend is in-line with the UK population which last year grew
at its slowest rate for 20 years.
4.2 In the 10 years since 2010 the total population of Bristol local authority is estimated
to have increased by 42,800 people an increase of 10.1%, this compares to an England and
Wales increase of 7.2% over the same decade. The growth in population includes a large
increase in students living in Bristol during term time.
4.3 Similar levels of population increase have been experienced in other Core Cities, the
highest percentage growth being in Manchester (12.8%), Nottingham (12.5%) and
Newcastle (10.9%) (Table 2).
Table 2. Population estimates 2010-2020 West of England and Core Cities
Source: ONS Mid-Year Population Estimates. Crown Copyright.
change mid-
Area mid-2010 mid-2020 2010-2020 % change
Bath & NE Somerset 174,300 196,400 22,100 12.7
Bristol 423,000 465,900 42,800 10.1
North Somerset 203,000 215,600 12,600 6.2
South Gloucestershire 261,500 287,800 26,300 10.1
West of England 1,061,700 1,165,600 103,900 9.8
West of England Combined Authority 858,800 950,000 91,300 10.6
Core Cities
Birmingham 1,061,100 1,140,500 79,500 7.5
Cardiff 341,400 369,200 27,800 8.1
Glasgow 586,500 635,600 49,100 8.4
Leeds 747,600 798,800 51,200 6.9
Liverpool 461,400 500,500 39,100 8.5
Manchester 492,600 555,700 63,100 12.8
Newcastle upon Tyne 276,700 306,800 30,100 10.9
Nottingham 299,800 337,100 37,300 12.5
Sheffield 544,600 589,200 44,600 8.2
England and Wales 55,692,400 59,719,700 4,027,300 7.2
104.4 Annual population change in Bristol since 1951 is illustrated in figure 3. Most years
between 1951 and 1990 saw Bristol’s population decrease whilst throughout the 1990s
annual population change was more volatile. Since 2002/3, Bristol has experienced annual
increases in population, particularly in 2004/5 when the A8 Accession countries joined the
European Union, with the exception of the 12 months to mid-2019 when there no change in
Bristol’s population.
Figure 3. Bristol annual population change 1951 to 2020
Source: ONS Mid-Year Population Estimates. Crown Copyright.
12,000
9,700
10,000
6,800
8,000
6,100
5,400
5,300
5,300
5,000
5,000
4,300
6,000
4,200
4,200
4,100
3,500
3,500
3,300
3,000
2,900
2,900
2,500
2,300
4,000
1,700
1,600
1,400
Persons
2,000
700
700
400
300
300
300
200
0
0
0
0
-200
-300
-300
-400
-500
-600
-600
-800
-800
-900
-900
-900
-2,000
-1,000
-1,100
-1,100
-1,200
-1,200
-1,300
-1,600
-1,900
-2,000
-2,100
-2,200
-2,300
-2,700
-2,900
-4,000
-3,000
-3,300
-3,400
-4,100
-4,400
-4,400
-4,400
-4,600
-4,900
-6,000
-5,500
-8,000
Population trends by age
4.5 Table 3 shows the estimated population change in Bristol’s age structure since mid-
2010 by broad age band and Figure 4 shows the change by five year age band.
Table 3. Bristol population change by broad age band 2010 to 2020
Source: ONS Mid-Year Population Estimates. Crown Copyright.
% share of
total Change % change
Broad age band Mid-2010 Mid-2020 population 2010-20 2010-20
0-15 years 76,800 85,700 18.4 8,900 11.6
16-24 years 65,200 73,700 15.8 8,400 12.9
25-49 years 162,400 180,000 38.6 17,600 10.8
50-64 years 62,900 66,200 14.2 3,300 5.2
65 and over 55,700 60,300 12.9 4,600 8.3
All ages 423,000 465,900 100.0 42,800 10.1
11Children
4.6 Between 2010 and 2020 the number of children living in Bristol increased by 8,900
(11.6%), higher than the England and Wales increase of 8.6%. The increase has been largely
amongst primary school aged children, with the number of 5-11 year olds increasing by 25%
over the decade. The trends reflect the substantial increase in numbers of births in Bristol
in recent years, although the number of births is now falling (see section on Components of
Population Change for more information).
Figure 4. Bristol population change by five year age band 2010 to 2020
Source: ONS Mid-Year Population Estimates. Crown Copyright.
12,000
10,000
10,000
8,700
7,900
8,000
5,800
6,000
Persons
3,800
4,000 3,000 3,100
2,800
2,000 1,300 1,400
600
200 200
0
-300 -300 -400
-2,000 -900
-800
-1,200
-2,000
-4,000
10-14
15
16-19
20-24
25-29
30-34
35-39
40-44
45-49
50-54
55-59
60-64
65-69
70-74
75-79
80-84
85-89
0-4
5-9
90+
Age group
Working age
4.7 The working age population in Bristol has increased by 29,300 people (10%) since
2010 compared to an increase of 3% in England and Wales as a whole. The greatest increase
was in the 20-34 year olds which increased by 22%, compared to just 5% nationally. This age
group alone accounted for the majority (62%) of the total increase in population in Bristol
during this period. Many of these people are likely to be students (see section on
Components of Population Change for more information).
4.8 Population growth mid-2018 to mid-2020 in many local authorities with large
student populations is lower than in recent years, partly reflecting smaller cohorts of 18-
and 19-year-olds across the UK in mid-2020.
Older people
4.9 Although the number of older people has increased year-on-year 2007-2019, Bristol
does not have an aging population according to the official definition 5. Overall, between
2010-20 the number of older people aged 65 and over in Bristol increased by just 8.3%, a
much lower increase than in England and Wales where there was a 22.1% increase in the
number of older people. Most of the increase in Bristol was in the 70-74 year olds.
5
Ageing of the population refers to both the increase in the average (median) age of the population and the
increase in the number and proportion of older people in the population.
124.10 The number of over 85s increased by just 210 people (2%) between 2010 and 2020 –
males increased by 19% and females fell by 5%. Nationally, the number of people aged 85
and over increased by 20.4%.
4.11 Decreases in mortality over recent years have resulted in increasing life expectancies
in the UK and a narrowing of the gap in life expectancies between men and women. This
reflects a fall in the proportions of males who smoke or hold a high-risk occupation 6. In
2020, Bristol males account for 36% of all people aged 85 and over compared to 31% a
decade ago.
Components of population change
4.12 Annual population change is driven by births, deaths and migration. Collectively,
these are referred to as the ‘components of change’. The difference between the number of
live births and the number of deaths is known as ‘natural change’.
4.13 Since 2002 population growth in Bristol has been generated by more births than
deaths and an increase in net-international migration. There was a notable spike in
international in-migration in 2004/5, the result of the Accession countries joining the
European Union. In more recent years, natural change (births minus deaths) has contributed
more than net migration to annual population change in Bristol (see Figure 5 and Table 4).
Figure 5. Components of population change in Bristol 2010/11 to 2019/20
Source: ONS Mid-Year Population Estimates. Crown Copyright.
12,000
10,000
2,500
8,000 2,000 1,600 1,100
1,100 1,900
300 200 700 1,300 1,100 2,100
100 300
200
6,000 800
4,000
6,600 6,900 6,600 6,400 6,400 6,400 6,200 5,900 5,700
Persons
5,400
2,000
0 -400 -200
-700
-3,300 -3,300 -3,400 -3,300 -3,400 -3,300 -3,400 -1,600
-2,000 -3,500 -3,500
-4,000 -3,400
Deaths International Migration Net
-6,000
Internal Migration Net Births
-8,000
2010/11 2011/12 2012/13 2013/14 2014/15 2015/16 2016/17 2017/18 2018/19 2019/20
Year
6
ONS Statistical Bulletin July 2020
13Births and deaths
4.14 In Bristol, there are more live births than deaths resulting in an increase in the
population due to natural change (see Figure 6). Over the last decade (2010-2020) in
Bristol, there were a total of 62,400 births and 33,700 deaths, resulting in a population
increase of 28,700 due to natural change alone. Natural change accounts for two thirds
(67%) of the total population change in Bristol over the decade. This is in contrast to the
national picture where net international migration remains the largest component of
population change.
4.15 The number of births in Bristol gradually increased from the year 2000 onwards,
reaching a peak of 6,800 births per annum in 2012. Since then births in Bristol have fallen
gradually. In 2019 the number of births fell to 5,557, a fall of 18% since the recent peak in
2012.
Table 4. Components of population change in Bristol 2009/10 to 2019/20
Numbers may not add to total due to rounding
Source: ONS Mid-Year Population Estimates. Crown Copyright.
2009/10 2010/11 2011/12 2012/13 2013/14 2014/15 2015/16 2016/17 2017/18 2018/19 2019/20
Births 6,400 6,600 6,900 6,600 6,400 6,400 6,400 6,200 5,900 5,700 5,400
Deaths 3,300 3,300 3,300 3,400 3,300 3,400 3,300 3,400 3,500 3,400 3,500
Natural Change 3,100 3,300 3,600 3,200 3,100 3,000 3,100 2,800 2,400 2,300 1,900
Internal Migration In 25,400 25,200 27,300 26,900 28,500 29,300 29,500 33,800 34,700 36,400 33,100
Internal Migration Out 25,500 24,900 27,100 26,700 27,900 28,000 28,400 33,600 35,100 37,100 33,300
Internal Migration Net -100 300 200 100 700 1,300 1,100 200 -400 -700 -200
International Migration In 5,300 6,000 5,100 5,800 6,400 7,300 7,200 6,400 7,500 7,100 7,400
International Migration Out 3,700 4,000 4,000 3,900 4,800 4,800 6,200 6,100 5,400 8,600 6,600
International Migration Net 1,600 2,000 1,100 1,900 1,600 2,500 1,100 300 2,100 -1,600 800
Other changes -600 -500 100 0 0 0 100 0 100 0 0
Migration & Other changes 1,000 1,800 1,400 2,100 2,300 3,800 2,300 500 1,800 -2,300 600
4.16 Nationally, the story of births is one of decreases and record lows, with the total
number of births continuing the fall. Births in England and Wales are now at or near record
low levels and are on a downward trend. The total fertility rate (TFR) for England and Wales
in 2019 was 1.65 children per woman, declining for the 7th consecutive year 7.
4.17 Fertility rates decreased in all age groups except for women aged 40 years and over.
For the fifth consecutive year, the fertility rate for women aged 40 years and over (16.5 per
1,000 women of this age) was higher than the rate for women aged under 20 years (11.2 per
1,000 women of this age); this is a pattern last recorded in 1947.
4.18 Possible reasons for the decrease in TFRs in recent years could be due to improved
access to contraception, the reduction in mortality rates of children aged under five years
(resulting in women having fewer babies) and lower levels of fertility, or difficulties
conceiving due to postponement in childbearing. Rising fertility rates at older ages have
affected the average age of mothers’, which has been increasing since 1975, reaching 30.7
years in 2019.
7
ONS Statistical bulletin: Births in England and Wales: 2019
144.19 The Total Fertility Rate in Bristol in 2019 was 1.44 children per woman, down from
1.52 in 2018, and lower than the England and Wales average of 1.65. The average age of
mothers in Bristol is older than nationally at 32.9 years.
Figure 6. Components of natural change (births minus deaths) in Bristol 2001/2 to 2019/20
Source: ONS Mid-Year Population Estimates. Crown Copyright.
10,000
9,000 Births minus Deaths
8,000 Births
7,000 Deaths
6,000
Persons
5,000
4,000
3,000
2,000
1,000
0
Figure 7. Live births by mother's country of birth Bristol 2001-19
Source: ONS Annual District Birth data by calendar year
7,000
6,000
5,000
Number of births
4,000
3,000
2,000
1,000
0
2001 2002 2003 2004 2005 2006 2007 2008 2009 2010 2011 2012 2013 2014 2015 2016 2017 2018 2019
Births to UK born mothers Births to non-UK born mothers Total births
154.20 Changes in total fertility rate are driven mainly by women born in the UK as they
make up the majority of the population of childbearing age (see Figure 7). However, non-UK
born women made up an increasing share of the population, which also acted to push
fertility rates upwards. The percentage of births in Bristol to non-UK born-mothers has
increased from 13% in 2001 to 29.8% in 2019. In 2019, the Total Fertility Rate for non-UK
born women in England and Wales was estimated to be 1.97 children per woman, compared
to 1.57 for women born in the UK 8.
4.21 Statistics are also available on the country of birth of the mother. Figure 8 shows
trends in numbers of live births since 1995 in Bristol of the top five countries not including
UK born mothers.
4.22 Births to Somalia-born and Poland-born mothers remain the highest in 2019,
followed by Pakistani-born, Romanian-born and Indian-born mothers. The number of births
in Bristol reflect the growth in the Somali population from the year 2000 onwards and the
growth in the Polish population following expansion of the EU in 2004.
Figure 8. Number of live births to non-UK born mothers
Five most common countries of birth of mother - Bristol 1995-2019
Source: ONS Annual District Birth data
400
350
300
Somalia
250 Poland
Number of births
Pakistan
200 Romania
India
150
100
50
0
1995
1996
1997
1998
1999
2000
2001
2002
2003
2004
2005
2006
2007
2008
2009
2010
2011
2012
2013
2014
2015
2016
2017
2018
2019
4.23 It’s too early to know what effect the Covid-19 pandemic will have on birth rates.
However, the response to economic and other uncertainty and insecurity is often a
reduction in birth rates as people put plans on hold. If that happens now, then the birth rate
could fall even lower.
8
ONS Statistical Bulletin: Births by parents’ country of birth, England and Wales: 2019
16Migration
4.24 Nationally, overall migration levels have remained broadly stable in recent years, but
new patterns have emerged for EU and non-EU migrants since 2016 when the EU
referendum took place.
4.25 The ONS Migration Statistics Quarterly Report: May 2020 shows EU net migration
has fallen since 2016, although more EU citizens still arrive long-term than leave. The
change has mostly been driven by a decrease in EU citizens coming to the UK for work-
related reasons as well as a gradual increase in the number of EU citizens leaving the UK.
4.26 Non-EU net migration has gradually increased since 2013 and is now at the highest
level since information by citizenship was first collected in 1975. This change has been
driven by an increase in the number of non-EU citizens coming to the UK for work-related
reasons and a gradual rise in the in those coming to the UK for formal study, driven by
students from China and India.
4.27 Since 2010, the population of Bristol has increased by 14,100 people due to net
migration and other changes, accounting for a third (33%) of all population change in Bristol
over the decade. The majority of the migration captured in the 12 months to mid-2020
occurred prior to the start of the pandemic in the UK and the travel restrictions that were
implemented in March 2020.
4.28 Net international migration in Bristol increased substantially in the early part of the
2000s with a notable spike in international in-migration in 2004/5, the result of the
Accession countries joining the European Union in 2004. Since 2004/5 net international
migration has seen annual fluctuations but has remained fairly stable.
4.29 The 12 months to mid-2019, saw a step change in this trend. In 2018/19 there were
7,100 international in-migrants (450 fewer than the previous year -6%) and 8,600
international out-migrants (3,300 more than the previous year +60%). This resulted in
negative net international migration, with more people leaving Bristol to live outside the UK
than arriving from outside the UK.
4.30 In the 12 months to mid-2020, there were 7,400 international in-migrants and 6,600
international out-migrants, so 800 more people moving into Bristol to live from outside the
UK than leaving to live outside the UK. All the net increase was in people aged under 25, in
particular 18 to 24 year olds, and all the net loss was in people aged 25 and over.
4.31 Net internal migration 9 has seen, for the third year running, more people move out
of Bristol to other parts of the UK than moved into Bristol from other parts of the UK. The
12 months to mid-2020 saw a net loss of 200 people. All age groups saw a net loss except
18-29 year olds where there was a large net gain, reflecting the recent increase in the
number of students living in Bristol during term time.
4.32 The main moves to and from Bristol were to/from the surrounding local authorities
plus London, Cardiff, Wiltshire and Cornwall. More people moved from London to Bristol
9
Internal migration includes migration within England & Wales, plus cross-border migration flows to and from
Scotland and Northern Ireland.
17(5,200) than from moved out of Bristol to London (4,400), resulting in a net gain of around
700 people.
4.33 It is important to note that the flows of people moving in and out of Bristol to other
parts of the UK (population flows) are around five times greater than the numbers of
international migrants to and from Bristol. In the 12 months to mid-2020 33,100 people
moved into Bristol from other areas of UK whilst 33,300 moved out of Bristol to other areas
of UK. In contrast, 7,400 people moved into Bristol from outside the UK and 6,600 people
moved out of Bristol to go abroad.
4.34 Estimates of migration are subject to higher levels of uncertainty than numbers of
births and deaths. One of the clearest impacts of the Covid-19 pandemic on internal
migration for the year to mid-2020 was a reduction in the number of moves because of the
first national lockdown which restricted people moving home. Also, the completeness of
internal migration estimates for the year to mid-2020 may have been affected, as
movement may not have been accompanied by timely updates to the administrative data
used to produce the estimates.
4.35 To summarise: the large increase in the population of Bristol since 2002 can be
attributed to a number of factors including a significant increase in births, a decrease in
the number of deaths and an increase in net-international migration. Since 2016,
however, population growth has slowed due to falling numbers of births and lower levels
of net migration, mainly due to an increase in international emigration. Natural change
remains the main driver of population change in Bristol.
Small area population trends
4.36 Figure 9 and Table 5 show population change between 2009 and 2019 by ward. The
areas of highest population growth have been in central areas of Bristol.
4.37 Whilst there have been increases in population across all but three wards over the
last decade, there has been exceptional increases in the central area of Bristol. The greatest
increases have been in Central ward where the population has almost doubled over the
decade (95%), Hotwells and Harbourside ward (48%) and Lawrence Hill ward (34%). Indeed
40% of the total increase in population in Bristol over the last decade took place in Central,
Lawrence Hill and Hotwells and Harbourside wards alone.
4.38 The components of population change vary from ward to ward across Bristol. Whilst
there have been significant levels of births across many wards over the decade, the
population of a number of wards, notably in the central areas of Bristol, appears to be due
to large increases in net-migration, including students.
18Figure 9. Population change 2009 to 2019 by ward
Source: Annual Small Area Population Estimates, Office for National Statistics © Crown Copyright 2020
19Table 5. Population estimates 2009-2019 by ward
Source: Annual Small Area Population Estimates, Experimental Statistics, Office for National Statistics © Crown
Copyright 2020 Note: population estimates may not add to total due to rounding.
Change 2009-2019
Code 2016 Ward Mid-2009 Mid-2019 number %
E05010885 Ashley 17,200 19,100 1,800 10.6
E05010886 Avonmouth & Lawrence Weston 20,100 21,400 1,300 6.4
E05010887 Bedminster 10,700 12,500 1,800 17.0
E05010888 Bishopston & Ashley Down 11,900 13,300 1,400 12.0
E05010889 Bishopsworth 10,800 11,400 600 5.2
E05010890 Brislington East 11,300 11,800 500 4.7
E05010891 Brislington West 10,700 11,500 700 6.8
E05010892 Central 11,100 21,800 10,600 95.2
E05010893 Clifton 13,100 13,500 400 2.7
E05010894 Clifton Down 11,100 11,500 500 4.1
E05010895 Cotham 11,600 11,700 100 0.6
E05010896 Easton 13,000 14,200 1,100 8.6
E05010897 Eastville 12,700 14,600 1,800 14.4
E05010898 Filwood 13,000 13,900 800 6.5
E05010899 Frome Vale 12,100 13,600 1,500 12.8
E05010900 Hartcliffe & Withywood 17,800 18,900 1,100 6.3
E05010901 Henbury & Brentry 11,400 12,500 1,100 9.3
E05010902 Hengrove & Whitchurch Park 17,200 17,000 -200 -1.4
E05010903 Hillfields 11,900 12,800 900 8.0
E05010904 Horfield 11,500 13,400 1,900 16.2
E05010905 Hotwells & Harbourside 4,300 6,400 2,100 47.8
E05010906 Knowle 13,100 13,300 200 1.7
E05010907 Lawrence Hill 14,700 19,600 4,900 33.7
E05010908 Lockleaze 11,500 13,300 1,800 15.9
E05010909 Redland 13,000 13,000 0 0.3
E05010910 St George Central 12,100 12,900 800 6.4
E05010911 St George Troopers Hill 5,700 5,800 100 1.4
E05010912 St George West 5,700 6,600 900 16.4
E05010913 Southmead 12,300 12,600 300 2.1
E05010914 Southville 10,900 12,900 1,900 17.8
E05010915 Stockwood 11,500 11,400 -200 -1.4
E05010916 Stoke Bishop 12,100 12,000 -100 -1.0
E05010917 Westbury-on-Trym & Henleaze 19,400 19,800 400 2.2
E05010918 Windmill Hill 12,300 13,800 1,400 11.4
Bristol 419,000 463,400 44,400 10.6
205. Population projections
PLEASE NOTE Population projections will be updated in Spring 2023
following the results of the Census 2021.
Uncertainty of population and household projections
5.1 Sub-national population projections provide estimates of the future population of
local authorities, assuming a continuation of recent local trends in fertility, mortality and
migration. The projections do not attempt to predict the impact that future government or
local policies, changing economic circumstances, local development policy, the capacity of
an area to accommodate population or other factors might have on demographic
behaviour.
5.2 Future population projections are uncertain. Current events – including the Covid-19
pandemic, leaving the EU, the new Hong Kong British National Overseas visa and the global
climate emergency – and their potential impacts on our economy and society, are not
reflected in the current 2018-based population projections.
5.3 Population and household projections are usually published on a two year cycle, the
latest being 2018-based projections. However, given the 2021 Census, the uncertainty
around the 2020 population estimates due to the Covid-19 pandemic and following user
feedback, the next set of sub-national projections that ONS plan to publish will be the 2021-
based subnational population projections and household projections in Spring/Summer
2023. These projections will use Census 2021 data to re-base population trends and
projections when these become available.
5.4 Future projections will be produced using an updated set of demographic
assumptions using innovative use of alternative data sources (for example, modelled
estimates of international migration). The improvements to the methods are designed to
better reflect the population changes that have taken place over the course of the Covid-19
pandemic and provide the best possible national picture for decision makers.
5.5 Due to the uncertainties outlined above and because the first two years of the
2018-based population projections for Bristol have been shown to be too high, the 2018-
based population and household projections should be used and interpreted with care.
21Population projections for Bristol
5.6 Future population projections are uncertain, however, in the event that pre-
pandemic trends were to continue, the total population of Bristol would be projected to
increase by 69,300 people over the 25 year period (2018-2043) to reach a total population
of 532,700 by 2043. This would be a projected increase of 15% higher than the projection
for England of 10% and the highest percentage increase of the other eight English Core
Cities.
5.7 Over the next decade (2018-28), the population increase in Bristol in terms of
numbers is projected to be the 10th highest of all LAs in England. By mid-2031 Bristol local
authority is projected to have a population of more than half a million usual residents. The
long term trend for Bristol is shown in Figure 10.
Figure 10. Population trend 1951 to 2043
Source: Mid-Year Estimates and 2018-based Sub-national Population Projections ONS
600,000
500,000
400,000
Population
300,000
ONS Mid year population estimates
200,000 ONS 2018-based population projections
100,000
0
1951 1956 1961 1966 1971 1976 1981 1986 1991 1996 2001 2006 2011 2016 2021 2026 2031 2036 2041
5.8 Figure 11 shows levels of annual population change between 2001 and 2020
together with projected levels of annual population change up to 2043. The projections are
trend-based projections, which mean assumptions for future levels of births, deaths and
migration are based on observed levels mainly over the 2013 to 2018 period.
5.9 Mid-2019 and mid-2020 population estimates show that the population of Bristol is
lower than the first 2 years projected by the 2018-based population projections.
22Figure 11. Annual population change 2001-2043
Source: Mid-Year Estimates and 2018-based Sub-national Population Projections ONS
10,000
Population Estimates
9,700
8,000 2018-based Population Projections
6,800
6,000
5,400
5,300
5,300
Persons
5,000
5,000
4,000
4,300
4,200
4,200
4,100
3,500
3,300
3,000
3,000
3,000
2,900
2,900
2,900
2,800
2,800
2,800
2,800
2,800
2,000
2,700
2,700
2,700
2,700
2,700
2,700
2,600
2,600
2,500
2,400
2,400
2,400
2,400
2,300
2,200
1,700
0
0
-300
-2,000
Population projections by age
5.10 Future changes in specific age groups have direct implications for policy making and
planning, it is therefore important to understand the projected changes to the age structure
of the area. In Bristol, between 2018 and 2043 all age bands are projected to increase.
Table 6 shows the projected change in population by broad age band. Figure 12 shows how
the age structure is projected to change over the same 25 year period.
Table 6. Population Projections by broad age band 2018-2043
Source: 2018-based Sub-national Population Projections, ONS
change 2018-43
Age 2018 2023 2028 2033 2038 2043 number %
Age 0-15 85,700 86,800 86,400 87,900 91,500 95,600 9,900 12%
Age 16-24 73,000 76,100 83,200 87,100 83,900 81,900 8,900 12%
Age 25-49 178,200 187,500 193,300 199,000 207,800 211,500 33,300 19%
Age 50-64 66,600 67,100 65,200 64,600 66,300 71,200 4,700 7%
Age 65-74 31,800 31,500 32,800 35,000 34,900 32,900 1,100 4%
Age 75+ 28,100 30,500 32,400 34,200 36,700 39,500 11,400 40%
All ages 463,400 479,600 493,400 507,800 521,000 532,700 69,300 15%
23Figure 12. Change in Population Projections by age 2018 and 2043
Source: 2018-based Sub-national Population Projections, ONS
12,000
2018-2043 change
10,000 Children 2018
2043 projection
+9,900
8,000
Older people
Population
6,000
+12,500
Working Age
4,000
+46,900
2,000
0
0 5 10 15 20 25 30 35 40 45 50 55 60 65 70 75 80
Age
Children
5.11 By 2043 there is projected to be 95,600 children (0-15 years) living in Bristol. The
number of children is projected to continue to increase, with 9,900 more children in 2043
than in 2018 representing an increase of 12%. Children as a proportion of the total
population is likely to remain the same at around 18% of all people living in Bristol.
Working age
5.12 By 2043 there is projected to be 364,700 people of working age (16-64 years) living
in Bristol. There is projected to be an increase of 46,900 working age people between 2018
and 2043, an increase of 15%. The working age population as a proportion of the total
population is likely to remain the same at around two thirds of the total population.
Older people
5.13 By 2043 there is projected to be 72,400 people aged 65 and over living in Bristol. In
total there is projected to be an additional 12,500 older people between 2018 and 2043, an
increase of 21%. The majority of this growth over the 25 year period is projected to be in
people aged 75 and over which are likely to grow by 40%. Older people as a proportion of
the total population is likely to increase from 13% to 14% of all people living in the city.
Projected components of population change
5.14 The projected components of population change, shown in Figure 13, illustrate
continuing high levels of births in Bristol, low levels of net international migration relative to
the last decade, gains from which will be offset by more people leaving Bristol to live in
other parts of the UK than moving to Bristol from other parts of the UK.
24Figure 13. Projected components of population change for Bristol 2018-2043
Source: 2018-based Sub-national Population Projections, ONS
10,000 International migration net Internal and cross border migration net Deaths Births
8,000 400 400 400 400 400
400 400 400
400 400 400 400 400 400 400
1,000 900 500 400 400 400 400
800 700 600
300
6,000
4,000 7,400 7,500 7,600 7,700 7,700 7,800
6,800 6,900 6,900 6,900 7,000 7,000 7,100 7,100 7,200 7,300
6,200 6,300 6,300 6,300 6,400 6,600 6,600 6,700 6,700
Persons
2,000
0
-3,200 -3,300 -3,300 -3,300 -3,300 -3,300 -3,300 -3,300 -3,300 -3,300 -3,300 -3,300 -3,300 -3,300 -3,400 -3,400 -3,400 -3,400 -3,400 -3,400 -3,400 -3,500 -3,500 -3,500 -3,500
-2,000
-400
-4,000 -1,100 -1,100 -1,100 -1,100 -1,000 -1,100 -1,100 -1,100 -1,000 -1,200 -1,400 -1,400 -1,400
-800 -300 -1,500 -1,700 -1,900 -2,000
-2,100 -2,200 -2,400 -2,500
-6,000
5.15 There are now two years of estimates which overlap with the 2018/19 and 2019/20
projections. The estimates show that in the first two years of the projection for Bristol, the
number of births has been lower than projected with the downward trend in births likely to
continue, the number of deaths has been higher than projected and levels of net migration
also lower than projected.
Household projections
5.16 2018-based household projections were published by the Office for National
Statistics (ONS) on 29 June 2020. They provide the projected number of households in
England and local authorities up to 2043. The projections are based upon the 2018-based
sub-national population projections, published by ONS in March 2020 and are subject to the
same caveats as outlined at the start of this section.
Figure 14. Household Projections by type of household in Bristol 2018-2043
Source: Office for National Statistics © Crown copyright 2020
250,000
200,000
Other households
number of households
with two or more
150,000 adults
Households with
100,000 dependent
children
50,000 One person
households
0
Year 2017
Year 2018
Year 2019
Year 2020
Year 2021
Year 2022
Year 2023
Year 2024
Year 2025
Year 2026
Year 2027
Year 2028
Year 2029
Year 2030
Year 2031
Year 2032
Year 2033
Year 2034
Year 2035
Year 2036
Year 2037
Year 2038
Year 2039
Year 2040
Year 2041
Year 2042
25Table 7. Household Projections by type of household in Bristol 2018-2043
Source: Office for National Statistics © Crown copyright 2020
Change 2018-43
Household type 2018 2023 2028 2033 2038 2043 number %
One person households 66,300 69,100 71,500 73,900 76,400 78,700 12,300 19%
Households with dependent children 50,300 51,800 53,700 55,400 57,000 58,300 7,900 16%
Other households with two or more adults 76,000 78,600 80,700 83,100 85,800 88,100 12,100 16%
Total households 192,700 199,500 205,800 212,400 219,100 225,000 32,400 17%
5.17 The number of households in Bristol is projected to increase by 32,400 over the 25
year period, from 192,700 in 2018 to 225,000 in 2043 (see Table 7). This is a 17% increase
and similar to the projected increase of 16% in England as a whole.
5.18 All household types are projected to increase – one person households by 19%,
households with dependent children by 16% and other households with two or more adults
by 16% (see Figure 14).
266. Population characteristics
PLEASE NOTE This section will be updated with the results of the
Census 2021 when they are published from Spring 2022 onwards.
A changing population profile
6.1 As outlined in earlier sections of this report, since 2001 there has been a large
increase in the total number of people living in Bristol which has resulted in a changing
population profile. The proportion of the population who are not ‘White British’ has
increased from 12% to 22% of the total population. In Bristol, there are now at least 45
religions, at least 187 countries of birth represented and at least 91 main languages spoken
by people living in Bristol.
6.2 Although all parts of the city have experienced changes in population numbers since
2001, changes to population characteristics have been concentrated in the inner city and
inner east areas of the city, in particular in the wards of Lawrence Hill, Ashley, Easton and
Eastville. Central ward has also experienced a large growth in population but this is mainly
attributable to a large increase in the number of students since 2001, in particular
international students.
6.3 The remainder of this section will outline the main characteristics of Bristol’s
population (excluding age which has been covered earlier) using the 2011 Census results
and look at how these characteristics have changed since 2001. The following characteristics
are included:
• Ethnic group
• Country of birth
• Migrants
• Religion
• Language
• Students
Ethnic group
6.4 The Black, Asian and Minority Ethnic group (BAME) population (all groups with the
exception of all the White groups) make up 16% of the total population in Bristol. This is an
increase from 8.2% of all people in 2001. ‘White British’ make up 78% of all people and
‘White non-British’ make up 6% of all people. ‘White non-British’ include the Eastern
European population as well as ‘White Irish’ and ‘White Gypsy or Irish traveller’.
6.5 Overall, people who are not ‘White British’ make up 22% of the total population in
Bristol - this is an increase from 12% of all people in 2001.
27Figure 15. Population by ethnic group
Source: 2011 Census Office for National Statistics © Crown Copyright 2013 [from Nomis]
Pakistani
6,863 Caribbean
Black Other 6,727
6,922
Indian 6,547
Other Asian
4,255
African 12,085
Chinese 3,886
White British Non-'White British'
333,432 94,802 Irish 3,851
Any other
Mixed, 15,438 ethnic
group
2,543
Bangladeshi
2,104
Arab 1,272
Other White 21,950
Gypsy or Irish
Traveller 359
Somali population estimate
The Somali population are not identified as a separate ethnic group in the 2011 Census but
are included in both the Black African and Black Other groups, depending on which tick box
people chose on the Census questionnaire.
The best estimate we can make of the number of Somalis living in Bristol is to take the
number of Black Africans and Black Others who identified themselves as Muslims and to
include only those born in Somalia (4,300), the UK (3,100) and other parts of Europe (900).
This gives us a Somali population estimate of 8,300.
Local knowledge suggests that it is likely that some Somalis, in particular men living in
informal accommodation, may have been under estimated by the 2011 Census. Taking this
into consideration, the likely number of Somalis living in Bristol in 2011 could be around
10,000.
National Insurance Registrations to Overseas Nationals (NINos) can be used to supplement
2011 Census statistics and ONS migration trends. Since 2002, of all local authorities in the
UK, Bristol had the second highest number of Somali nationals registering for National
Insurance. In total 2,400 Somalis registered to work in Bristol. Only Birmingham had a higher
number with 2,750 registrations. The number of Somalis registering for NINos in Bristol has
declined sharply since 2002, with only 66 registrations in total in Bristol in 2013/14.
286.6 The age profile of the Black, Asian and Minority Ethnic population is much younger
than the age profile of the Bristol population as a whole. The proportion of children (aged 0-
15) who belong to a Black, Asian and Minority Ethnic group is 28%, the proportion of people
of working age (aged 16-64) who belong to a Black, Asian and Minority Ethnic group is 15%
and the proportion of older people (aged 65 and over) who belong to a Black, Asian and
Minority Ethnic group is just 5%.
6.7 Table 8 shows how different ethnic groups have changed since 2001. The largest
increases by ethnic group since 2001 have been in Other White, Black African, Black Other
and Multiple/mixed ethnic groups. These changes reflect the large growth in the Somali and
the Polish populations in Bristol, as well as an increase in international students and the
increasingly mixed child population. The Somali population estimate text box has more
information about the number of Somalis living in Bristol.
Table 8. Population by ethnic group 2001 and 2011
Source: 2011 Census Office for National Statistics © Crown Copyright 2013 [from Nomis]
Note: the 2001 Census undercounts the population in Bristol by around 10,000
2001 Census 2011 Census
Ethnic group number % number %
White British 335,085 88.0 333,432 77.9
White Irish 4,321 1.1 3,851 0.9
White Gypsy or Irish Traveller n/a n/a 359 0.1
White Other 10,124 2.7 21,950 5.1
Mixed ethnic group 7,934 2.1 15,438 3.6
Indian 4,595 1.2 6,547 1.5
Pakistani 4,050 1.1 6,863 1.6
Bangladeshi 1,230 0.3 2,104 0.5
Chinese 2,149 0.6 3,886 0.9
Other Asian 984 0.3 4,255 1.0
Black African 2,310 0.6 12,085 2.8
Black Caribbean 5,585 1.5 6,727 1.6
Black Other 936 0.2 6,922 1.6
Arab n/a n/a 1,272 0.3
Any other ethnic group 1,312 0.3 2,543 0.6
Total White 349,530 91.8 359,592 84.0
Total BAME 31,085 8.2 68,642 16.0
All people 380,615 100.0 428,234 100.0
Total non-‘White British’ 45,530 12.0 94,802 22.1
6.8 The Black, Asian and Minority Ethnic group population varies significantly across the
city - in Lawrence Hill ward 60% of all people belong to a Black, Asian and Minority Ethnic
group compared to 4% in Bishopsworth. This difference is emphasised even more when
looking at areas smaller than wards (see Figure 16) – in ‘St Pauls Grosvenor Road’ 80% of all
people belong to a Black, Asian and Minority Ethnic group whilst just 1.4% are Black, Asian
and Minority Ethnic in ‘The Coots’ in Stockwood.
6.9 Since 2001, the distribution of the Black, Asian and Minority Ethnic group population
of Bristol has changed considerably (Figure 17). Whilst in 2001 the Black, Asian and Minority
Ethnic group population largely lived in the inner city wards of Ashley, Easton, Lawrence Hill
and Eastville, in 2011 the distribution of the Black, Asian and Minority Ethnic group
29You can also read