Socioeconomic inequalities in children's weight, height and BMI trajectories in Norway - Nature
←
→
Page content transcription
If your browser does not render page correctly, please read the page content below
www.nature.com/scientificreports
OPEN Socioeconomic inequalities
in children’s weight, height
and BMI trajectories in Norway
Teferi Mekonnen1*, Eleni Papadopoulou2, Onyebuchi A. Arah3, Anne Lise Brantsæter2,
Nanna Lien1 & Mekdes K. Gebremariam1
Studies exploring when social inequalities in body mass index (BMI) and its composites emerge
and how these evolve with age are limited. Thus, this study explored parental income and
education related inequalities in children’s weight, height, weight velocity and body mass index
among Norwegian children from 1 month to 8 years. The study population included 59,927 family/
children pairs participating in the Norwegian Mother, Father, and Child Cohort Study. Growth was
modelled using the Jenss–Bayley model and linear mixed effects analyses were conducted. Maternal
and paternal educational differences in children’s weight and BMI trajectories emerged during
infancy, continuing to age 8 years. Parental income-related inequalities in children’s weight were
observed from the age of 1 month to 4 years for maternal and up to 1 year for paternal income-
related differences but then disappeared. Parental income-related inequalities in child’s BMI were
observed from 18 months to 8 years for maternal income, and from 9 months to 8 years for paternal
income-related differences. These results suggest that social inequalities in children’s BMI present
early in infancy and continue to 8 years of age. The inequalities sometimes differed by indicator of
socioeconomic position used. Interventions to combat these inequalities early in life are, thus needed.
Socioeconomic inequalities in overweight (OW)/obesity (OB) among children and adolescents are p revalent1–3
and represent important public health concerns. Tackling these inequalities is a key public health goal because of
the short and long-term adverse health effects of early life OW and OB4,5, including the tracking of body weight
from childhood into a dolescence6 and adulthood7–11. Socioeconomic inequalities in children’s BMI trajectories
can vary with children’s age because of the socioeconomic gradients in various perinatal and early life factors,
including breastfeeding12, complementary feeding practices13,14, childhood dietary behaviours15–18 and sedentary
behaviours19. Tackling such inequalities requires an understanding of when in early life they emerge and how
they evolve with increasing age.
Few studies with available longitudinal data from birth to childhood have explored how early socioeconomic
inequalities in body mass index (BMI) trajectories emerge and how they evolve throughout childhood. Evidence
from these studies revealed mixed results regarding the timing at which distinct BMI trajectories by socioeco-
nomic status e merge3,20–26. Therefore, there is a need for more longitudinal studies with data from birth and with
long periods of follow-up. Additionally, BMI changes could be attributable to changes in weight, height or both.
Few studies with data from birth to childhood have considered weight and height measurements along with
BMI20,24. Thus, exploring inequalities in children’s weight and height trajectories in addition to BMI could help
to understand the roots of the inequalities in BMI or OW/OB among children. Another important aspect that
helps to better explore the origin of inequalities in children’s BMI could be exploring socioeconomic inequalities
in the rate of child growth per unit of time (e.g. weight gain velocities). In this regard, there is a lack of studies
assessing inequalities in weight gain velocities.
In addition, it is important to take into account different indicators of socioeconomic position (SEP) while
assessing socioeconomic inequalities in OW/OB among children, as different SEP indicators might influence
the pathways leading to health inequalities in different manners. For example, income could influence the
choice of healthy vs unhealthy lifestyle behaviors through the ability to afford healthier food alternatives. On
the other hand, education could influence food choice by equipping parents with skills to gain better access to
health information and to critically evaluate this i nformation27. Most studies have used different SEP indicators
1
Department of Nutrition, Faculty of Medicine, Institute of Basic Medical Sciences, University of Oslo, Oslo,
Norway. 2Section of Environmental Exposure and Epidemiology, Norwegian Institute of Public Health, Oslo,
Norway. 3Department of Epidemiology and Department of Statistics, University of California, Los Angeles (UCLA),
Los Angeles, USA. *email: t.m.yitayew@medisin.uio.no
Scientific Reports | (2021) 11:4979 | https://doi.org/10.1038/s41598-021-84615-w 1
Vol.:(0123456789)www.nature.com/scientificreports/
interchangeably1,21,26,28. However, studies are showing the independent influence on anthropometric markers
exerted by income and education. For instance, studies among adults in the US demonstrated that BMI and
skinfold thickness among women were independently associated with education, but not with income; among
men these anthropometric markers were independently associated with income only29,30. Another study among
Brazilian adults showed that in less developed regions obesity among women was associated with both income
and education, but in more economically developed regions, obesity among women was associated only with
education. Among men, obesity was positively associated with income and to a certain extent with education31.
In addition, limited evidence of a potential interaction between SEP indicators (i.e. education and income) on
its association with OW/OB e xists32.
Therefore, this study aimed to examine the associations between various measures of SEP and growth tra-
jectories (i.e. BMI, weight, weight gain velocity, and height) among Norwegian children from birth to 8 years of
age using data from one of the largest prospective pregnancy cohorts in the world.
Methods
Study design and sample. The Norwegian Mother, Father and Child Cohort Study (MoBa) is a pop-
ulation-based pregnancy cohort study conducted by the Norwegian Institute of Public Health33. Participants
were recruited from all over Norway from 1999 to 2008. The invitation to participate was sent to pregnant
women prior to the first ultrasound examination offered to all free of charge. The women consented to participa-
tion in 41% of the pregnancies. The cohort now includes 114,500 children, 95,200 mothers and 75,200 fathers.
Included women received questionnaires at 17, 22 and 30 weeks of pregnancy, and when the child was 6 months,
18 months, 3 years, 5 years, 7 years and 8 years old. The current study is based on version 12 of the quality-
assured data files released for research in January 2019, with linkage to the Medical Birth Registry of Norway,
the national health registry containing information about all births in Norway. The establishment of MoBa and
the initial data collection was based on a license from the Norwegian Data Protection Agency and approval from
The Regional Committees for Medical and Health Research Ethics. The MoBa cohort is now based on regula-
tions related to the Norwegian Health Registry Act. The current study was approved by the Regional Committees
for Medical and Health Research Ethics (REK 2018/470). Written informed consent was obtained from each
MoBa participant upon recruitment. All experiments were performed in accordance with relevant guidelines
and regulations.
After exclusion of women with multiple gestations, malformations and chromosomal abnormalities, 83,475
mothers with live-born singleton births remained. Of these, 70,913 had complete data on maternal and paternal
educational level and income status. Further exclusions were made based on missing data on birth weight and
length, missing postnatal weight or height/length measurements, or missing data for the included covariates,
yielding a final sample of 59,927 out of the 83,475 (71.8%). Supplementary Figure S1 shows the inclusion chart
of the participants.
Measures. Parental socioeconomic position was measured by self-reported maternal and paternal education
and income during pregnancy (baseline questionnaire). Maternal and paternal educational status was defined
into three categories as low (≤ 12 years of education), medium (13–16 years of education) and high (≥ 17 years
of education). We have used average household income per year done in accordance with data from the statis-
tics Norway at the time of baseline data collection (1999–2008) to define income status. Maternal and paternal
income were defined as earned “below mean income” if their annual income is < 300,000 NOK per year and
earned “greater than/equal to mean income” if their annual income is ≥ 300,000 NOK per year.
Anthropometric measurements of children in Norway are routinely conducted by health professionals at well
child clinics (i.e. up to 5 years) and at school health services (i.e. after 5 years) according to guidelines from the
Norwegian directorate of h ealth34.
Mothers reported the weight and length/height of their child at 11 age points; 6 weeks, 3 months, 6 months,
8 months, 1 year, 1.5 years, 2 years, 3 years, 5 years, 7 years, 8 years (details on anthropometric measurements
described in Supplementary Table S1). Birth weight and length data were obtained from the Medical birth reg-
istry of Norway. From 6 weeks to 18 months, mothers were asked to refer to their children’s health card, while
no specification was provided for measurements from 2 to 8 years.
Implausible anthropometric values were identified and excluded by separately implementing two different
methods; (1) by comparing with the WHO Growth standards, as a weight-for-age or height-for-age z-score < 6
SD below or > 6 SD (5 SD for weight) above the mean35, and (2) by identifying measured values with a > 3 SD
andwww.nature.com/scientificreports/
Socio-demographic variables N (%)
Child gender
Male 30,738 (51.3)
Female 29,189 (48.7)
Maternal marital status
Living with partner 58,468 (97.6)
Others 1459 (2.4)
Parity
Primiparaous 27,610 (46.1)
Multiparous 32,317 (53.9)
Maternal educational status*
Low 18,149 (30.3)
Medium 25,758 (43.0)
High 16,020 (26.7)
Paternal educational status*
Low 27,197 (45.4)
Medium 17,407 (29.1)
High 15,323 (25.6)
Maternal income**
Below mean income 31,129 (63.6)
Greater than/equal to mean income 21,798 (36.4)
Paternal income**
Below mean income 20,504 (34.2)
Greater than/equal to mean income 39,423 (65.8)
Table 1. Socio-demographic characteristics of family/child pairs included in this study (N = 59,927). *Low:
completed ≤ 12 years of education, medium completed 13–16 years of education, and high completed ≥ 17 years
of education. **Below mean income < 300,000 Norwegian Krone per year and greater than/equal to mean
income ≥ 300,000 Norwegian Krone per year.
Childhood weight status (not overweight/obese, overweight/obese) at the age 2 to 8 years was defined by applying
the age and gender specific International Obesity Task Force BMI cut-offs (kg/m2)38 in the predicted BMI values.
Statistical analysis. Graphical illustration of the overall distributions of children’s anthropometric data
(i.e. Weight, weight gain velocity, height, and BMI) at the ages of 1 month to 8 years at 14-time points was cre-
ated. Linear mixed effect models with random intercept at the child-level and a random slope for age were used
to analyze associations between SEP indicators and children’s anthropometry at 14 time points between ages
of 1 month to 8 years. The associations between SEP indicators and children’s anthropometry at 14 time points
were illustrated using the high SEP position as a reference. The average marginal effects of SEP indicators on
children’s anthropometry at 14 time points were estimated. Then, the estimated marginal effects were presented
in tables and graphs. The other SEP indicator was mutually adjusted for in the analyses in order to estimate the
independent effect of each SEP indicator (parental education, parental income). The interaction between the SEP
indicators was tested. Adjustment for child gender, birth weight, parity, maternal civil status, and gestational age
was made. Multicollinearity was checked. The main analyses were performed with Stata version 16 statistical
software (Stata Corporation, College Station, Texas, USA). R version 3.2.239,40 was used for the growth models.
The p-value for statistical significance was set to P < 0.05.
Results
Among 59,927 families /child pairs included in the study, 30.3% and 63.6% of the children had mothers with
low education and who earned below mean income, respectively. The proportion of children with low paternal
education and fathers who earned below mean income were 45.4% and 34.2%, respectively (Table 1).
The percentage of those with OW/OB among children aged 2 years to 8 years was higher for the lowest socio-
economic groups for all the SEP indicators used (Supplementary Table S3). The overall shape and distribution
of children’s weight, weight gain velocity, height and BMI from age 1 month to 8 years (14-time points) is shown
in the violin plot (Supplementary Fig. S2).
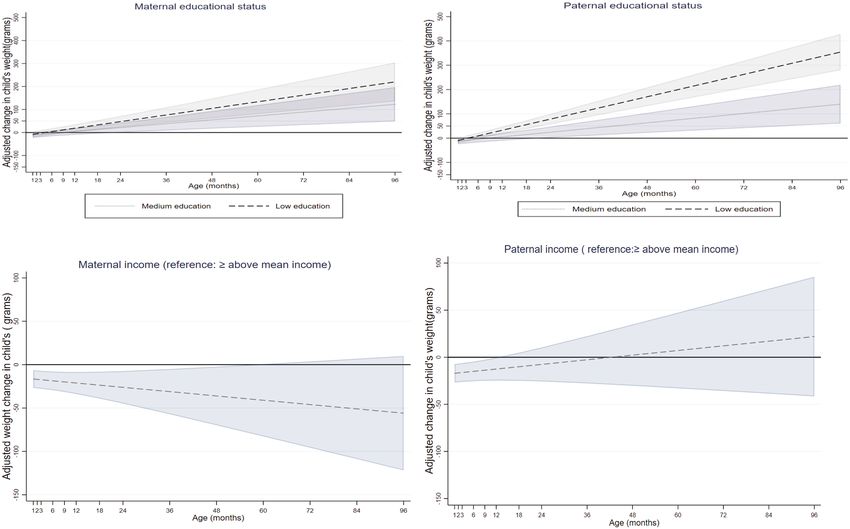
SEP and child weight and weight gain velocity up to 8 years. Maternal educational level was
inversely associated with children’s weight from the age of 1 year onwards (Fig. 1). Children of low educated
mothers on average weighed more from the age of 1 year onwards compared to their peers with high educated
mothers (e.g. weighed; 18.6 g more (95% CI 2.4, 34.7 g) at the age of 1 year and 219.9 g more (95% CI 135.8,
304.0 g) at the age of 8 years). Children of medium educated mothers weighed more from the age of 2 years to
8 years compared to their peers with high-educated mothers (Fig. 1, Supplementary Table S4).
Scientific Reports | (2021) 11:4979 | https://doi.org/10.1038/s41598-021-84615-w 3
Vol.:(0123456789)www.nature.com/scientificreports/
Figure 1. Associations between maternal and paternal education and income with children’s weight in grams
from 1 month to 8 year (β coefficients in dash and dot lines and 95% CIs in solid lines).
Paternal educational level was inversely associated with children’s weight from the age of 9 months onwards
(Fig. 1). Children of low educated fathers on average weighed more from the age of 9 months onwards compared
to their peers with high-educated fathers (e.g. weighed; 21.1 g more (95% CI 8.0, 34.1 g) at the age of 9 months
and 354.1 g more (95% CI 279.8, 428.4 g) at 8 years). Children of fathers with medium educational level on aver-
age weighed more from the age of 2 years to 8 years compared to their peers with high educated-fathers (Fig. 1,
Supplementary Table S4).
Maternal income was positively associated with children’s weight from the age of 1 month up to 4 years
(Fig. 1). Children of mothers who earned below mean income on average weighed less from the age of 1 month
up to 4 years, compared to their peers with mothers who earned greater than/equal to mean income (e.g.
weighed 16.6 g less (95% CI − 26.8, − 6.4) and 36.1 g less (95% CI − 69.8, − 2.3 g) at the age of 1 month and 4 years,
respectively). This association was not present from the age of 5 years onwards (Fig. 1, Supplementary Table S4).
Paternal income was positively associated with children’s weight from 1 month to 1 year; after 1 year, the
paternal income gradient in children’s weight was no longer significant (Fig. 1). Children of fathers who earned
below mean income on average weighed less from the age of 1 month to 1 year, compared to their peers with
fathers who earned greater than/equal to mean income (e.g. weighed 17.1 g less (95% CI − 26.9, − 7.2 g) at the
age of 1 month and 12.5 g less 95% CI − 24.7, − 0.3 g) at 1 year age) (Fig. 1, Supplementary Table S4).
Children of low educated mothers on average had higher weight gain velocity from the age of 18 months to
6 years compared to their peers with high-educated mothers (e.g. gain 1.8 g/month more (95% CI 0.1, 3.5 g/
month) at the age of 18 months and 2.5 g/month more (95% CI 0.0, 4.8 g/month) at age 6 years). No association
was observed up to 18 months and after 7 years. Children of low educated fathers on average had higher weight
gain velocity from 1 month to 8 years compared to their peers with high-educated fathers (e.g. gain 3.2 g/month
more (95% CI 1.2, 5.1 g/month) at the age of 1 month and 4.3 g/month more 95% CI 1.3, 7.3 g/month) at age
8 years). Parental income was not associated with children’s weight gain velocity at any of the age points assessed
(Supplementary Table S4).
SEP and height among children aged up to 8 years. Maternal and paternal educational level were not
associated with children’s height at any of the age points assessed (Supplementary Table S4).
Maternal income was positively associated with children’s height at the age of 1 month to 8 years (Fig. 2).
Children of mothers who earned below mean income on average were shorter from the age of 1 month to 8 years
compared to their peers with mothers who earned greater than /equal to mean income (e.g. 0.08 cm shorter (95%
CI − 0.14, − 0.03 cm) at the age of 1 month and 0.37 cm shorter (95% CI − 0.50, − 0.25 cm) at the age of 8 years
(Fig. 2, Supplementary Table S4).
Scientific Reports | (2021) 11:4979 | https://doi.org/10.1038/s41598-021-84615-w 4
Vol:.(1234567890)www.nature.com/scientificreports/
Figure 2. Associations between maternal and paternal income with children’s height in centimeters from
1 month to 8 year (β coefficients in dash lines and 95% CIs in solid lines).
Figure 3. Associations between maternal and paternal education and income with children’s BMI from
1 month to 8 year (β coefficients in dash and dot lines and 95% CIs in solid lines).
Paternal income was positively associated with children’s height from the age of the 1 month to 8 years
(Fig. 2). Children of fathers who earned below mean income on average were shorter from the age of the 1 month
to 8 years compared to their peers with fathers who earned greater than /equal to mean income (e.g. 0.10 cm
shorter (95% CI − 0.16, − 0.05 cm) at the 1st month and 0.32 cm shorter (95% CI − 0.44, − 0.21 cm) at 8 years
(Fig. 2, Supplementary Table S4).
SEP and BMI among children up to 8 years. Maternal educational level was inversely associated with
children’s BMI (kg/m2) from the age of 1 month to 8 years (Fig. 3). Children of low educated mothers on average
had a higher BMI from the age of 1 month to 8 years compared to their peers with mothers with high education
(e.g. 0.05 kg/m2 higher (95% CI 0.02, 0.07 kg/m2) at the 1st month and 0.16 kg/m2 higher (95% CI 0.12, 0.20 kg/
m2) at 8 years). Children of mothers with medium educational level on average had a higher BMI from the age
Scientific Reports | (2021) 11:4979 | https://doi.org/10.1038/s41598-021-84615-w 5
Vol.:(0123456789)www.nature.com/scientificreports/
of 18 months onwards compared to children with high-educated mothers (e.g. 0.02 kg/m2 higher (95% CI 0.00,
0.04 kg/m2) at 18 months and 0.07 kg/m2 higher (95% CI 0.04, 0.11 kg/m2) at 8 years) (Fig. 3, Supplementary
Table S4).
Paternal educational level was inversely associated with their children’s BMI from the age of 1 month to 8 years
(Fig. 3). Children with low-educated fathers on average had a higher BMI from the age of 1 month to 8 years
compared to their peers with fathers with high education (e.g. 0.04 kg/m2 higher (95% CI 0.02, 0.06) at the age
of 1 month and 0.21 kg/m2 higher (95% CI 0.17, 0.24) at the age of 8 years). Children of fathers with medium
educational level on average had a higher BMI from the age of 4 years to 8 years compared to their peers with
high-educated fathers (e.g. 0.03 kg/m2 higher (95% CI 0.01, 0.06) at 4 years and 0.07 kg/m2 higher (95% CI 0.03,
0.11) at 8 years) (Fig. 3, Supplementary Table S4).
Maternal income was inversely associated with a children’s BMI from the age of 18 months onwards (Fig. 3).
Children with below average income mothers on average had a higher BMI from the age of 1 year onwards com-
pared to their peers with mothers who earned greater than /equal to mean income (e.g. 0.02 kg/m2 higher (95%
CI 0.00, 0.04) at 18 months and 0.06 kg/m2 higher (95% CI 0.03, 0.10) at 8 years) (Fig. 3, Supplementary Table S4).
Paternal income was inversely associated with children’s BMI from the age of 9 months onwards (Fig. 3).
Children of fathers who earned below mean income on average had a higher BMI than their counterparts with
fathers who earned greater than /equal to mean income (e.g. 0.02 kg/m2 higher (95% CI 0.00, 0.03) at 9 months
and 0.09 kg/m2 higher (95% CI 0.06, 0.12) at 8 years) (Fig. 3, Supplementary Table S4).
Results of interaction analyses revealed interaction effects at some age points in the association between SEP
indicators and weight and BMI. For example, children of low educated mothers weighed more from the age of
18 months onwards compared to their peers with higher educated mothers, irrespective of maternal income. The
same was found for paternal education but with an earlier onset, from 12 months onwards. Within low-income
mothers, children of low educated mothers had a higher BMI growth trajectory up to 8 years compared to their
peers with mothers with higher education. The same was found within mothers who earned greater than/equal
to mean income but with a later onset, from 12 months onwards. Irrespective of paternal income status, children
of low educated fathers had a higher BMI growth trajectory from the age of 1 month to 8 years compared to their
peers of high-educated fathers (Supplementary Table S5).
Discussion
This study showed that there were socioeconomic differences in weight, height, and BMI trajectories among
Norwegian children from the age of 1 month to 8 years, although the magnitudes of the differences were generally
small. Maternal and paternal educational differences in children’s weight and BMI trajectories emerged during
infancy, continuing to age 8 years. Maternal and paternal educational differences in children’s height were not
found. Parental income-related differences in children’s weight trajectory emerged at the age of 1 month and
continued up to 4 years for maternal and up to 1 year for paternal income-related differences. Small parental
income-related differences in children’s height emerged at the age of 1 month, continuing to 8 years. Parental
income-related differences in children’s BMI emerged early (18 months and 9 months for maternal and paternal
income, respectively) and continued up to 8 years. Interactions between education and income were found at
some age points.
Previous studies with data from birth demonstrated that socioeconomic inequalities in children’s BMI
emerged from 1 month continuing to 5 years in F rance20; from 4 to 10 years in E
ngland21; from 1 to 7 years in
24 3
Denmark , and from 3 years to 4.5 years in the N etherlands . The age at which socioeconomic inequalities in
children’s BMI trajectory emerged in our study were earlier than in studies from E ngland21, Denmark24 and the
3 20
Netherlands , but consistent with results from a French cohort s tudy . The differences in the age at which these
inequalities emerged might support the evidence that early life factors such as breast feeding, smoking during
pregnancy, dietary and physical activity behaviours, which affect BMI, have different socioeconomic patterns in
different countries41–42. Our study results indicated that Norwegian children showed the same pattern of socioeco-
nomic inequalities in OW/OB trajectories as other high-income countries showing a higher proportion of child-
hood OW/OB among the lower socioeconomic g roups43,44, which is in accordance with the reversal h ypothesis45.
An early onset of socioeconomic inequalities in children’s BMI was found in this study. Interventions against
these inequalities targeted early in life are thus needed. Furthermore, body weight change is caused by an interac-
tion of factors. Thus, this early onset of socioeconomic inequalities and widening with increasing age might be
due to differences in exposures to factors influencing child weight development at different stages of develop-
ment. In this regard, studies have documented socioeconomic differences in the factors influencing child weight
development such as prenatal factors46, breast-feeding12, complementary feeding practices13,14, childhood dietary
behaviours15–18, and sedentary behaviours19. However, the extent to which these factors contribute to the occur-
rence and continued widening of socioeconomic inequalities in children’s weight development are not fully
understood47; such studies are thus warranted.
Investigating how socioeconomic inequalities in children’s weight and height growth trajectories evolve with
increasing age is important to understand the roots of the inequalities in BMI or OW/OB among children. Our
findings demonstrated that both parental income and education related inequalities in children’s weight trajectory
emerged early in infancy and only parental education-related inequalities were evident after early infancy. The
socioeconomic inequalities in the children’s height growth trajectories were observed for parental income only.
The SEP indicator specific results in the inequalities in children’s weight and height trajectories might indicate
that parental education-related differences in BMI among Norwegian children could be attributed to educational
related differences in children’s weight, rather than height. Meanwhile, income-related differences in children’s
BMI could be attributed to differences in children’s height and weight up to the infancy stage and to differences
in children’s height afterward.
Scientific Reports | (2021) 11:4979 | https://doi.org/10.1038/s41598-021-84615-w 6
Vol:.(1234567890)www.nature.com/scientificreports/
We found that children with low educated parents had higher weight gain velocity at most of the age points
eriod48,49.
studied. Weight gain velocity is a measure of children’s growth, which reflects weight gain over a given p
Studies have shown that children who gain weight rapidly during early life are at higher risk of obesity in later
life50 and had a higher likelihood of developing cardiovascular diseases in early a dulthood51,52. Thus, initiating
interventions targeting inequalities in children’s weight development and growth outcomes early in life could be
a critical time to break the cycle for the risk of chronic disease inequalities in later life.
SEP indicator specific differences in the weight, height, BMI trajectories. Studies addressing
socioeconomic inequalities in children’s weight, height BMI, and OW/OB have used different SEP indicators
interchangeably1,21,26,28. In our study, we assessed the independent effects of maternal income, maternal educa-
tional level, paternal income and paternal educational level on children’s height, weight, weight gain velocity,
and BMI trajectories, with results indicating that there were SEP indicator-specific associations in children’s
weight, height and BMI trajectories among Norwegian children aged 1 month to 8 years. In general, differences
between maternal and paternal SEP indicators were not very significant, in terms of both timing and magnitude,
although some differences were observed. Our results showed that the effect estimates in the association between
parental income and education with children’s weight, weight gain velocity, and BMI were higher for the parental
education related differences than for parental income related ones. This implies that parental educational sta-
tus contributes more for the inequalities in children’s weight and BMI trajectories than parental income status.
Results from interaction analyses of parental education and income in their association with children’s weight
and BMI showed that despite similar income levels, those children with higher parental education had more
favorable weight and BMI trajectories at some age points, showing the additional protective impact of education.
Our finding supports by the finding by a study conducted in Germany highlighting the particular importance of
parental education in its association with obesity over the other socioeconomic position indicators used53. The
protective effects of a higher parental education on favorable children’s weight development might be because
of the impact of education on parents’ ability to process health information leading to improved health-related
decisions in parenting practice. This might in turn affect their motivation to adopt a healthy lifestyle, and act as
role models for their children27,54,55. Thus, considering different parental SEP indicators in future studies explor-
ing socioeconomic inequalities in child weight development is encouraged.
Strengths and limitations. The strengths of this study include the large sample size, the prospective
assessments of weight, length/ height over a long follow-up period and the assessment of the independent effects
of SEP indicators on trajectories of child weight, height and BMI. In addition, the missing anthropometric meas-
urements were handled with the use of a growth model, an approach that can overcome the problem of loss to
follow-up, which tend to be more pronounced among the less advantaged and less healthy p opulation57–58.
However, this study has weaknesses as well. The anthropometric measurements of the children were not
based on direct measurements; they were based on parental reported measurements (although consultation of
the children’s health card was suggested for some age points), which might introduce measurement errors. The
cohort includes only those who read Norwegian; as a result, ethnic differences in the existing socioeconomic
inequalities could not be explored. Self-selection in MoBa is also a concern. Women participating in MoBa are
older, better educated and include fewer smokers than the general population of pregnant women59. Therefore,
effect estimates for the socioeconomic differences in children’s weight, height, and BMI in the current study are
likely underestimated; the generally small magnitude of differences between groups should thus be seen in light
of this potential underestimation.
Conclusions
Socioeconomic differences in children’s weight, height and BMI trajectories emerge early in infancy and remain
up to 8 years of age. The magnitude of these differences varied by indicator of socioeconomic position. Early
interventions to combat these inequalities are thus needed to avoid or minimize their negative health conse-
quences. To inform such interventions, identifying the underlying mechanisms behind the early occurrence and
continuing widening of the inequalities in children’s BMI with an increasing age is vital.
Data availability
The datasets analyzed during the current study are not publicly available due to data protection regulations.
Researchers who want access to data sets for replication should submit an application to datatilgang@fhi.no.
Access to data sets requires approval from The Regional Committee for Medical and Health Research Ethics in
Norway and an agreement with MoBa.
Received: 22 August 2020; Accepted: 17 February 2021
References
1. Bann, D., Johnson, W., Li, L., Kuh, D. & Hardy, R. Socioeconomic inequalities in childhood and adolescent body-mass index,
weight, and height from 1953 to 2015: An analysis of four longitudinal, observational, British birth cohort studies. The Lancet
Public Health 3, e194–e203 (2018).
2. Rasmussen, M. et al. Trends in social inequality in overweight and obesity among adolescents in Denmark 1998–2018. Int. J. Public
Health 65, 1–10 (2020).
3. Bouthoorn, S. H. et al. Development of socioeconomic inequalities in obesity among Dutch pre-school and school-aged children.
Obesity 22, 2230–2237 (2014).
Scientific Reports | (2021) 11:4979 | https://doi.org/10.1038/s41598-021-84615-w 7
Vol.:(0123456789)www.nature.com/scientificreports/
4. Withrow, D. & Alter, D. A. The economic burden of obesity worldwide: A systematic review of the direct costs of obesity. Obes.
Rev. 12, 131–141 (2011).
5. Di Angelantonio, E. et al. Body-mass index and all-cause mortality: Individual-participant-data meta-analysis of 239 prospective
studies in four continents. The Lancet 388, 776–786 (2016).
6. Evensen, E., Wilsgaard, T., Furberg, A.-S. & Skeie, G. Tracking of overweight and obesity from early childhood to adolescence in
a population-based cohort—The Tromsø Study, fit futures. BMC Pediatr. 16, 64 (2016).
7. Tom, N., David, B., Rebecca, H. & William, J. Socioeconomic inequalities in childhood-to-adulthood BMI tracking in three British
birth cohorts. Int. J. Obes. 44, 388 (2020).
8. Power, C., Manor, O. & Matthews, S. Child to adult socioeconomic conditions and obesity in a national cohort. Int. J. Obes. 27,
1081 (2003).
9. Power, C. et al. The contribution of childhood and adult socioeconomic position to adult obesity and smoking behaviour: An
international comparison. Int. J. Epidemiol. 34, 335–344 (2005).
10. Strand, B. H., Murray, E. T., Guralnik, J., Hardy, R. & Kuh, D. Childhood social class and adult adiposity and blood-pressure
trajectories 36–53 years: Gender-specific results from a British birth cohort. J. Epidemiol. Community Health 66, 512–518 (2012).
11. Bann, D., Johnson, W., Li, L., Kuh, D. & Hardy, R. Socioeconomic inequalities in body mass index across adulthood: coordinated
analyses of individual participant data from three British birth cohort studies initiated in 1946, 1958 and 1970. PLoS Med. 14,
e1002214 (2017).
12. Heck, K. E., Braveman, P., Cubbin, C., Chavez, G. F. & Kiely, J. L. Socioeconomic status and breastfeeding initiation among Cali-
fornia mothers. Public Health Rep. 121, 51–59 (2006).
13. Dallazen, C. et al. Introduction of inappropriate complementary feeding in the first year of life and associated factors in children
with low socioeconomic status. Cadernos de Saude Publica 34, e00202816 (2018).
14. Rinaldi, A. E. M. & Conde, W. L. Socioeconomic inequality in dietary intake begins before 24 months in Brazilian children. Rev.
Saude Publica 53, 9 (2019).
15. Campbell, K. et al. Family food environments of 5–6 year-old-children: Does socioeconomic status make a difference?. Asia Pac.
J. Clin. Nutr. 11, 553–561 (2002).
16. Santos, L. P., Assunção, M. C. F., Matijasevich, A., Santos, I. S. & Barros, A. J. Dietary intake patterns of children aged 6 years and
their association with socioeconomic and demographic characteristics, early feeding practices and body mass index. BMC Public
Health 16, 1055 (2016).
17. De Irala-Estevez, J. et al. A systematic review of socio-economic differences in food habits in Europe: Consumption of fruit and
vegetables. Eur. J. Clin. Nutr. 54, 706–714 (2000).
18. Wijtzes, A. I. et al. Social inequalities in young Children’s meal skipping behaviors: The generation R study. PLoS ONE 10, e0134487
(2015).
19. Pulsford, R. M., Griew, P., Page, A. S., Cooper, A. R. & Hillsdon, M. M. Socioeconomic position and childhood sedentary time:
Evidence from the PEACH project. Int. J. Behav. Nutr. Phys. Activity 10, 105 (2013).
20. Ballon, M. et al. Socioeconomic inequalities in weight, height and body mass index from birth to 5 years. Int. J. Obes. 42, 1671–1679
(2018).
21. Howe, L. D. et al. Socioeconomic disparities in trajectories of adiposity across childhood. Int. J. Pediatr. Obes. 6, e144–e153 (2011).
22. Jansen, P. W., Mensah, F. K., Nicholson, J. M. & Wake, M. Family and neighbourhood socioeconomic inequalities in childhood
trajectories of BMI and overweight: Longitudinal study of Australian children. PLoS ONE. https://doi.org/10.1371/annotation/
f7e5e1f3-77f6-4c56-b0ba-53b54a86df14 (2013).
23. Langnase, K., Mast, M., Danielzik, S., Spethmann, C. & Müller, M. J. Socioeconomic gradients in body weight of German children
reverse direction between the ages of 2 and 6 years. J. Nutr. 133, 789–796 (2003).
24. Morgen, C. S. et al. Socioeconomic disparities in birth weight and body mass index during infancy through age 7 years: A study
within the Danish National birth cohort. BMJ Open 7, e011781 (2017).
25. Ruijsbroek, A. et al. The development of socio-economic health differences in childhood: Results of the Dutch longitudinal PIAMA
birth cohort. BMC Public Health 11, 225 (2011).
26. McCrory, C. et al. Maternal educational inequalities in measured body mass index trajectories in three European countries. Paediatr.
Perinat. Epidemiol. 33, 226–237 (2019).
27. Adler, N. E. & Newman, K. Socioeconomic disparities in health: Pathways and policies. Health Aff. 21, 60–76 (2002).
28. Galobardes, B., Lynch, J. & Smith, G. D. Measuring socioeconomic position in health research. Br. Med. Bull. 81, 21 (2007).
29. Flegal, K. M., Harlan, W. & Landis, J. Secular trends in body mass index and skinfold thickness with socioeconomic factors in
young adult men. Am. J. Clin. Nutr. 48, 544–551 (1988).
30. Flegal, K. M., Harlan, W. R. & Landis, J. R. Secular trends in body mass index and skinfold thickness with socioeconomic factors
in young adult women. Am. J. Clin. Nutr. 48, 535–543 (1988).
31. Monteiro, C. A., Conde, W. L. & Popkin, B. M. Independent effects of income and education on the risk of obesity in the Brazilian
adult population. J. Nutr. 131, 881S-886S (2001).
32. Liu, Y. et al. Interaction between parental education and household wealth on children’s obesity risk. Int. J. Environ. Res. Public
Health 15, 1754 (2018).
33. Magnus, P. et al. Cohort profile update: The Norwegian mother and child cohort study (MoBa). Int. J. Epidemiol. 45, 382–388
(2016).
34. Juliusson, P. et al. Nasjonale faglige retningslinjer for veiing og måling i helsestasjons-og skolehelsetjenesten (The Norwegian Direc-
torate of Health, Oslo, 2010).
35. World Health Organization. WHO child growth standards: Length/height-for-age, weight-for-age, weight-for-length, weight-for-height
and body mass index-for-age: Methods and development (WHO, Geneva, 2006).
36. Jenss, R. M. & Bayley, N. A mathematical method for studying the growth of a child. Hum. Biol. 9, 556 (1937).
37. Comets, E., Lavenu, A. & Lavielle, M. SAEMIX: Stochastic Approximation Expectation Maximization (SAEM) Algorithm. R
package version 1 (2011).
38. Cole, T. J. & Lobstein, T. Extended international (IOTF) body mass index cut-offs for thinness, overweight and obesity. Pediatr.
Obes. 7, 284–294 (2012).
39. Team, R. C. R: A language and environment for statistical computing. R Foundation for Statistical Computing. Vienna, Austria
https://www.R-project.org (2018).
40. Bosi, A. T. B., Eriksen, K. G., Sobko, T., Wijnhoven, T. M. & Breda, J. Breastfeeding practices and policies in WHO European region
member states. Public Health Nutr. 19, 753–764 (2016).
41. Fernandez-Alvira, J. M. et al. Country-specific dietary patterns and associations with socioeconomic status in European children:
The IDEFICS study. Eur. J. Clin. Nutr. 68, 811–821 (2014).
42. Boucher, J. & Konkle, A. Understanding inequalities of maternal smoking—Bridging the gap with adapted intervention strategies.
Int. J. Environ. Res. Public Health 13, 282 (2016).
43. Yang, Z. et al. Trends in overweight and obesity by socioeconomic status in Year 6 school children, Australian Capital Territory,
2006–2018. BMC Public Health 19, 1512 (2019).
44. Chung, A. et al. Trends in child and adolescent obesity prevalence in economically advanced countries according to socioeconomic
position: A systematic review. Obes. Rev. 17, 276–295 (2016).
Scientific Reports | (2021) 11:4979 | https://doi.org/10.1038/s41598-021-84615-w 8
Vol:.(1234567890)www.nature.com/scientificreports/
45. Pampel, F. C., Denney, J. T. & Krueger, P. M. Obesity, SES, and economic development: A test of the reversal hypothesis. Soc. Sci.
Med. 74, 1073–1081 (2012).
46. Cameron, A. J. et al. A review of the relationship between socioeconomic position and the early-life predictors of obesity. Curr.
Obes. Rep. 4, 350–362 (2015).
47. Gebremariam, M., Lien, N., Nianogo, R. & Arah, O. Mediators of socioeconomic differences in adiposity among youth: A systematic
review. Obes. Rev. 18, 880–898 (2017).
48. Senterre, T. & Rigo, J. Reduction in postnatal cumulative nutritional deficit and improvement of growth in extremely preterm
infants. Acta Paediatr. 101, e64–e70 (2012).
49. Olusanya, B. O. & Renner, J. K. Predictors of growth velocity in early infancy in a resource-poor setting. Early Hum. Dev. 87,
647–652 (2011).
50. Monteiro, P. O. A. & Victora, C. G. Rapid growth in infancy and childhood and obesity in later life—A systematic review. Obes.
Rev. 6, 143–154 (2005).
51. Leunissen, R. W., Kerkhof, G. F., Stijnen, T. & Hokken-Koelega, A. Timing and tempo of first-year rapid growth in relation to
cardiovascular and metabolic risk profile in early adulthood. JAMA 301, 2234–2242 (2009).
52. Kerkhof, G. F., Willemsen, R. H., Leunissen, R. W., Breukhoven, P. E. & Hokken-Koelega, A. C. Health profile of young adults born
preterm: Negative effects of rapid weight gain in early life. J. Clin. Endocrinol. Metab. 97, 4498–4506 (2012).
53. Lamerz, A. et al. Social class, parental education, and obesity prevalence in a study of six-year-old children in Germany. Int. J.
Obes. 29, 373–380 (2005).
54. Wolfson, J. A., Gollust, S. E., Niederdeppe, J. & Barry, C. L. The role of parents in public views of strategies to address childhood
obesity in the United States. Milbank Q. 93, 73–111 (2015).
55. Cutler, D. M. & Lleras-Muney, A. Education and Health: Evaluating Theories and Evidence. Report No. 0898-2937 (National Bureau
of Economic Research, Cambridge, 2006).
56. Strandhagen, E. et al. Selection bias in a population survey with registry linkage: Potential effect on socioeconomic gradient in
cardiovascular risk. Eur. J. Epidemiol. 25, 163–172 (2010).
57. Goldberg, M. et al. Socioeconomic, demographic, occupational, and health factors associated with participation in a long-term
epidemiologic survey: A prospective study of the French GAZEL cohort and its target population. Am. J. Epidemiol. 154, 373–384
(2001).
58. Howe, L. D., Tilling, K., Galobardes, B. & Lawlor, D. A. Loss to follow-up in cohort studies: bias in estimates of socioeconomic
inequalities. Epidemiology (Cambridge) 24, 1 (2013).
59. Nilsen, R. M. et al. Self-selection and bias in a large prospective pregnancy cohort in Norway. Paediatr. Perinat. Epidemiol. 23,
597–608 (2009).
Acknowledgements
The Norwegian Mother and Child Cohort Study is supported by the Norwegian Ministry of Health and Care
Services and the Ministry of Education and Research, NIH/NINDS (Grant No. 1 UO1 NS 047537-01 and Grant
No. 2 UO1 NS 047537-06A1). We are grateful to all the participating families in Norway who take part in this
ongoing cohort study. This work was funded by the Norwegian Research Council BEDREHELSE program (Grant
Number 273823). E.P is funded by the Research Council of Norway, under the MILJØFORSK program (project
number: 268465).
Author contributions
T.M. performed data preparation, statistical analyses, interpretation of the results, wrote the first draft of the
manuscript, and had the main responsibility of writing the paper. M.K.G., N.L., E.P., A.-L.B. and O.A.A. con-
ceived the study, participated in reviewing the drafts. All authors provided feedback on different versions of the
manuscript and approved the final version submitted for publication.
Competing interests
The authors declare no competing interests.
Additional information
Supplementary Information The online version contains supplementary material available at https://doi.
org/10.1038/s41598-021-84615-w.
Correspondence and requests for materials should be addressed to T.M.
Reprints and permissions information is available at www.nature.com/reprints.
Publisher’s note Springer Nature remains neutral with regard to jurisdictional claims in published maps and
institutional affiliations.
Open Access This article is licensed under a Creative Commons Attribution 4.0 International
License, which permits use, sharing, adaptation, distribution and reproduction in any medium or
format, as long as you give appropriate credit to the original author(s) and the source, provide a link to the
Creative Commons licence, and indicate if changes were made. The images or other third party material in this
article are included in the article’s Creative Commons licence, unless indicated otherwise in a credit line to the
material. If material is not included in the article’s Creative Commons licence and your intended use is not
permitted by statutory regulation or exceeds the permitted use, you will need to obtain permission directly from
the copyright holder. To view a copy of this licence, visit http://creativecommons.org/licenses/by/4.0/.
© The Author(s) 2021
Scientific Reports | (2021) 11:4979 | https://doi.org/10.1038/s41598-021-84615-w 9
Vol.:(0123456789)You can also read