WEALTH OF THE NATION - CACI
←
→
Page content transcription
If your browser does not render page correctly, please read the page content below

WEALTH OF THE NATION

CONTENTS

Introduction: How CACI data reveals the wealth of the nation ................................ 4

Household Incomes ..................................................................................................... 8

Housing Affordability .................................................................................................. 12

The Savings Market .....................................................................................................20

Summary ..................................................................................................................... 26

Appendix ..................................................................................................................... 28

           At CACI we’ve worked with clients to analyse customers and
           catchments on a daily basis over the past 40 years.

           Whether you need to benchmark postcodes, neighbourhoods or
           catchments, CACI’s Data solutions define the industry standard;
           every dataset is built, maintained and updated by a dedicated team
           of expert analysts ensuring you have a robust source of independent
           analysis to corroborate your decisions and support your strategy.
HOW CACI DATA REVEALS
    THE WEALTH OF THE NATION

    Every year, CACI releases Paycheck, an estimate of the income and outgoings of households across the UK. Our
    data shows the average and modelled distribution of household incomes and essential outgoings for the 1.5 million
    residential postcodes in the UK.

    We’ve analysed the latest Paycheck data to reveal the state of the nation’s finances, and to uncover some
    overarching trends. Using this analysis, this report provides informed opinion on topics including the affordability of
    housing and the behaviour of the nation’s savers.

      “              In two decades of CACI reporting on the Wealth of the
                     Nation, both the data available and the tools we use to
                                                                                                                                                           GRAHAM SMITH
                                                                                                                                                           Associate Director

                     model and interrogate it have transformed the depth,
                     sophistication and accuracy of our analysis.                                               “
    For the purposes of this report we look at average household income by broader geographic areas: Postcode
    Sectors (e.g. W14 8) and Local Authority Districts / Unitary Authorities. We have identified local concentrations of
    wealth and hardship by ranking neighbourhoods with the highest proportion of high and low earners. The report
    focuses on the spatial variation in the average income of the UK population rather than seeking to identify the
    locations of the super-rich or extremely deprived.

    Our proprietary products and the insights they provide combine to reveal the income, wealth and affluence of the
    UK and how how these impact lifestyles and housing affordability.

    With all of these sources, together with granular postcode and address-level mapping, we have incredibly powerful
    data and tools to unpack fresh insight that shows both historic patterns and signposts future trends. Today, they
    provide vital insights for consumer and B2B organisations in the commercial and public sectors, helping to plan
    and deliver services, support infrastructure and to predict and tackle social challenges, from rural poverty and          STEWART ELDRIDGE
    indebtedness to urban housing and transport provision.
                                                                                                                              Head of Public Sector Data

4                                                                                                                                                                               5
CACI’S KEY PROPRIETARY DATA PRODUCTS

    Paycheck provides gross household income estimates at full postcode level across the UK. It uses information from            Ocean is CACI’s database containing the names and addresses of over 48 million UK adults, each with over 550
    Ocean, CACI’s lifestyle database, in conjunction with data from the ONS’s Average Weekly Earnings and Living                 variables attributed to them describing their demographic, digital, lifestyle and attitudinal characteristics. Built from
    Costs & Food Survey to build a consistent and statistically reliable model. Income reflected by Paycheck is gross            over one billion separate pieces of GDPR compliant information and updated quarterly, Ocean forms a complete
    household income from all sources including earnings, benefits and investments.                                              and current picture of the UK population. This rich data source allows organisations to better target consumers with
                                                                                                                                 the right message, product or service – at the right time and across the right channel.
    Paycheck includes additional information which allows us to study households at various life stages (young singles
    and couples, families, empty nesters and retired), right down to the individual postcode level (e.g. W14 8TR). With          The variables held within Ocean cover a huge range of categories, of which many are particularly relevant to the
    this level of detail, planners and analysts are able to see the underlying, regional variations in income patterns as well   Wealth of the Nation. There are variables to capture individuals’ savings and investment products; their credit card
    as local differences and so produce a true picture of the nation’s wealth.                                                   expenditure and whether balances are paid in full each month; how confident individuals are at managing their own
                                                                                                                                 money; and how likely price comparison sites are used.

                                                                                                                                 Consumer segmentation is one of the many applications of Ocean. The database is also invaluable in modelling
                                                                                                                                 applications primarily because of its level of granularity and broad range of variables.

    Paycheck Disposable Income provides an estimate of the income available to households after tax, national
    insurance and other essential outgoings.

    Understanding household income is vital in being able to provide the most appropriate products and services to
    customers and communities. Knowing how much income is actually available once the basic cost of living has been              Acorn is a geodemographic segmentation of the UK’s population. It provides a detailed understanding of the
    taken into account offers even more insight into your consumers.                                                             consumer characteristics of people and places, allowing organisations to define and deliver appropriate targeting
                                                                                                                                 strategies. Acorn segments households, postcodes and neighbourhoods into 6 categories, 18 groups and 62 types.
    We have built a range of statistically robust models to accurately predict expenditure on each of 16 categories              By analysing significant social factors and population behaviour, it provides precise information and an in-depth
    of essential outgoings. These have been built using data from Ocean, CACI’s lifestyle database, as well as official          understanding of different types of people.
    statistics and survey data. Average disposable income and outgoings are provided for each of the 1.5 million
    residential postcodes in the UK

                                                                                                                                 StreetValue is a postcode level directory of average residential property prices, covering all residential postcodes,
    Fresco is CACI’s most powerful financial services segmentation and the first consumer classification of its kind in          each of which contain 15 households on average. Unlike any other published sources of information on the housing
    the UK. Using GFK’s Financial Research Survey and CACI’s own wealth of data on the UK population, it describes               market, StreetValue allows you to analyse property price information at the very detailed level of individual
    individuals in terms of their financial product holdings, attitudes, lifestage, affluence and digital behaviour.             postcodes, useful for assessing housing affordability and as a demographic indicator for modelling other aspects of
                                                                                                                                 consumer behaviour.
    Fresco is a code which can be appended to each record at individual level. The ability to divide UK consumers
    into discrete and clearly defined groups provides organisations with a universal vocabulary with which to describe           The standard StreetValue postcode directory provides estimates of the mean, median and range of house values in
    customers, prospects and the market. Fresco can be used both for strategic and tactical planning in a wide range of          a postcode, together with index comparisons against the corresponding Postcode Area and against the whole of the
    different applications including propositions development, branch planning and management, prospect targeting and            UK.
    campaign planning.

6                                                                                                                                                                                                                                                            7
HOUSEHOLD INCOMES

                                                                                                                                                                    Current
    The current average gross household income in the UK is £39,800, an increase from £39,100 in 2018.

    At a Regional level the South East has, not surprisingly, the highest average figure at £46,400 with Northern Ireland                            2018
    having the lowest at £33,400.

    London residents aren’t far behind the South East with a mean gross household income of £44,000.

     “                                                                                                                                                         £39,800
                                                                                                                            average gross
                                                                                                                            household income       £39,100
                  However, looking at disposable income, once the cost
                  of mortgage, rents, bills and other essential outgoings
                  are taken into account, Londoners are actually worse off
                  than the UK average, with a net disposable income of just
                                                                                                                                                             disposable income
                  £13,600 per household against a UK average of £17,500.
                                                                                                             “              Lowest gross
                                                                                                                            household income

                                                                                                                              £33,400                        LONDON
    Averaging across large areas does tend to result in figures lower than you may intuitively expect. Within London
                                                                                                                                                             £13,600
    itself there is a huge income disparity, with some households benefiting from incomes way above the national
    average. Almost 6% percent of London households have a mean household income of over £100k, compared to
    4.6% for the UK as a whole.                                                                                                                              AVERAGE
                                                                                                                                                             £17,500
                                                                                                                                                 £46,400
                                                                                                                              Highest gross
                                                                                                                              household income

8                                                                                                                                                                                9
HOUSEHOLD INCOMES                                                                                                       Table 1: Top Ten Postcode Sectors by Mean Annual Household Income:

                                                                                                                              Postcode                                                                 Number of    Mean Annual Gross
                                                                                                                                                    Area Name
                                                                                                                              Sector                                                                   Households   Household Income
     We’ve identified the top ten and bottom ten Postcode Sectors in the UK by average household income (Tables 1
     and 2 opposite):                                                                                                         WD3 4                 Loudwater, Hertfordshire                           1,450        £73,000

     Six of the top ten Postcode Sectors were also in the top ten of our previous Wealth of the Nation report, with           SE21 7                Dulwich, London                                    1,400        £72,800
     Postcode Sectors in Loudwater, St Albans, Oxshott and South Kensington being new additions. Six of the bottom
     ten also remain there from the last report, joined by Postcode Sectors in Greenock, Shankhill, Stockbridge Village,      SW11 6                Clapham, London                                    4,350        £71,200
     and Vauxhall.
                                                                                                                              AL5 3                 Harpenden, Hertfordshire                           1,800        £71,100
     As well as comparing average incomes by geographical level we can also examine differences across life stages.
     For instance, Manchester has the lowest average income for Retired households of any local authority in the UK           AL5 2                 Harpenden, Hertfordshire                           1,800        £70,800
     at £17,900, but other demographic groups bring up the overall figure, with Singles and Couples (£33,700), Families
     (£34,200) and Empty Nesters (£35,600) all having higher average household incomes.                                       N20 8                 Totteridge, London                                 1,550        £70,500

     This kind of information from our Paycheck datasets has proved vital for our clients when making decisions across all    AL1 4                 St Albans, Hertfordshire                           3,600        £69,900
     areas of business and government, for everything from assessing housing affordability to planning premium banking
     services.                                                                                                                KT22 0                Oxshott, Surrey                                    1,500        £69,700

     It provides a detailed understanding of geographic areas that is key to meeting the needs of customers and               KT10 9                Esher, Surrey                                      2,050        £69,500
     communities. Accurate, granular data enables organisations to provide targeted, appropriate services and to make
                                                                                                                              SW7 2                 South Kensington, London                           850          £69,100
     sound commercial judgements.

                                                                                                                             Table 2: Bottom Ten Postcode Sectors by Mean Annual Household Income:

                                                                                                                              Postcode                                                                 Number of    Mean Annual Gross
                                                                                                                                                    Area Name
                                                                                                                              Sector                                                                   Households   Household Income

                                                                                                                              TS1 5                 Newport, Middlesbrough                             800          £14,800

                                                                                                                              PA15 1                Greenock, Inverclyde                               1,400        £15,000

                                                                                                                              B7 4                  Nechells Green, Birmingham                         1,500        £15,100

                                                                                                                              CH41 3                Birkenhead, Merseyside                             750          £15,100

                                                                                                                              B19 3                 Jewellery Quarter, Birmingham                      1,450        £15,600

                                                                                                                              BT13 1                Shankhill, Belfast                                 2,000        £15,900

                                                                                                                              L5 0                  Anfield, Liverpool                                 800          £16,100

                                                                                                                              L28 5                 Stockbridge Village, Liverpool                     650          £16,200

                                                                                                                              L5 8                  Vauxhall, Liverpool                                750          £16,700

                                                                                                                              NE4 7                 Elswick, Newcastle upon Tyne                       1,350        £16,900

                                                                                                                             Source: CACI Population and Household Estimates & Projections, Paycheck 2019

10                                                                                                                                                                                                                                      11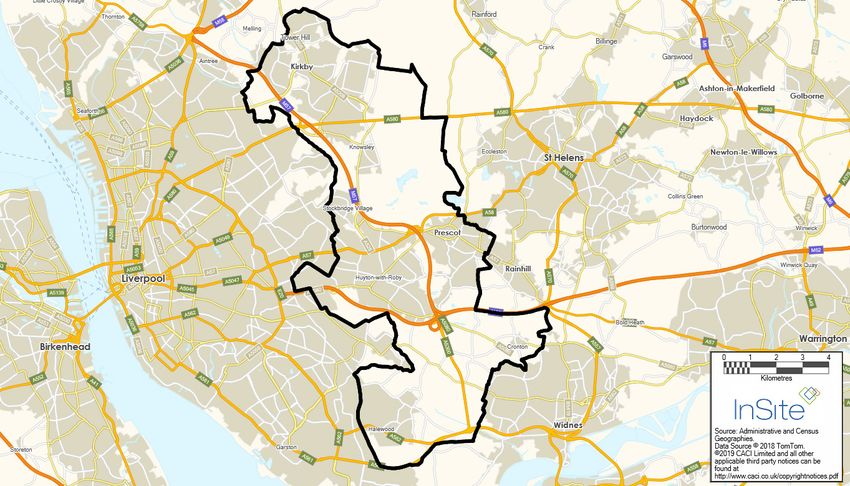
HOUSING AFFORDABILITY FROM A LOCAL
     AUTHORITY PERSPECTIVE

     Local Authorities make use of a variety of data sources including income and house price when assessing housing          Although the statistics in the ONS report come from a robust and recognised source, like a lot of open data there
     affordability, the latter being treated as a barometer for the strength of the economy. However, a home is only          is a data lag and it doesn’t provide the detail required by many public and private sector organisations.
     affordable if someone really has the means with which to pay for it and whilst this is largely governed by house price
     and income, the socio-economic characteristics of the population also have an influencing factor.                        To complement ONS and other open data, many public sector organisations make use of commercial data sources
                                                                                                                              such as CACI’s gross household income dataset, Paycheck and house price dataset, StreetValue, as they provide a
     It has been widely reported that the housing market in general faces many challenges. In particular, a general           more up-to-date view of the housing market at detailed postcode and/or household levels that open data cannot
     shortage of housing to meet demand and an increase in homelessness. Shelter 1 assessed that there were some              provide. In particular, local authorities will use this kind of data to support a variety of different analysis projects
     320,000 people living in temporary accommodation, sleeping rough or in hostels.                                          such as Housing Needs Assessments which include the requirement to understand housing affordability and need.
                                                                                                                              Authorities such as Shropshire Council 2 and North Ayrshire Council3 publish analysis that outlines their approach
     According to the Housing Affordability in England and Wales: 2018 document published by the Office for National          and findings.
     Statistics (ONS), Copeland, in the North West of England, remained the most affordable local authority in England
     and Wales with average house prices being 2.5 times average workplace-based annual earnings. Kensington and              In this section of the Wealth of the Nation Report, we look at average house prices in conjunction with gross
     Chelsea remained the least affordable local authority, with average house prices being 44.5 times workplace-based        household income to assess affordability by the cash shortfall (or surplus) in the highest and lowest income areas
     average annual earnings.                                                                                                 for the two-tier authority system (Borough/District, Unitary and County) across the UK. Unlike other sources of
                                                                                                                              income data, Paycheck provides a consistent measure of income from all sources and not just earnings.

                                                                                                                              Our calculations are based on a three times multiple of mean gross household income from CACI’s Paycheck,

       “
                                                                                                                              which is about the average given for a mortgage (i.e. mortgage availability). In this example we take account of a
                                                                                                                              10% deposit on the mean house price (from CACI’s StreetValue), which is the current average minimum of loan to
                                                                                                                              value (i.e. mortgage needed), leaving us with the “cash gap”. It also assumes there is no other equity or other assets
                                                                                                                              available (e.g. selling existing property).
                     The same report also identified 77 local authorities that
                     became less affordable over the last five years (most
                     in London, the South East and the East of England)
                     and there were no local authorities where affordability                                   “
                     improved.

                                                                                                                                                                                                                                       CASH
                                                                                                                                                                                                                                       GAP
                                                                                                                              Note: While CACI has based its income multiplier on 3 times, we know that some banks will lend up to 4.5 times.

12                                                                                                                                                                                                                                                       13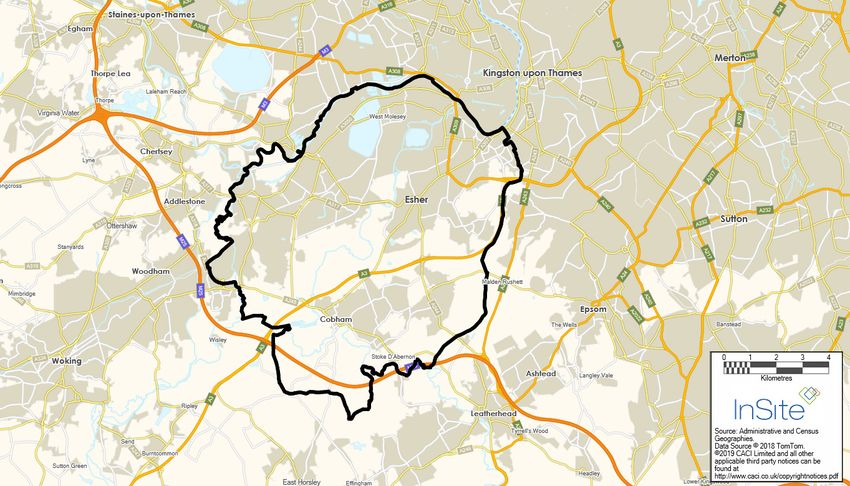
HOUSING AFFORDABILITY -
     ELMBRIDGE & KNOWSLEY

                                    An Example Housing Affordability Assessment - Elmbridge & Knowsley

                                    This section explores the cash gap by lifestage and house type for the Borough of Elmbridge in
                                    Surrey and Knowsley Metropolitan Borough in Merseyside.

                                    These areas were chosen for comparison as they are respectively at the highest and lowest ends
                                    of the spectrum in terms of average gross annual household income by Borough and District
                                    Authority, with the average Elmbridge household earning £58,300 and those in Knowsley earning

     KNOWSLEY                       £28,200.

                                    Elmbridge and Knowsley are both very similar in terms of geographic coverage and population
                                    size – Elmbridge has 149,000 residents and Knowsley has 138,000 – however, this is where the
                                    similarities end. According to CACI’s consumer segmentation, Acorn, the demographic and
                                    lifestyle of these populations differ greatly.

                                    In Knowsley the dominant Acorn groups come from Struggling Estates, Striving Families and
                                    Steady Neighbourhoods where incomes are below the average for the country. In contrast,
                                    Elmbridge’s Acorn groups are dominated by Executive Wealth, Lavish Lifestyles and Career
                                    Climbers where income is significantly above the national average.

                                    The results of the analysis suggest that lower income areas are more likely to be able to afford
                                    homes within their local area as the cash gap is generally a lot less compared to higher income
                                    areas. However, residents in lower income areas could struggle to qualify for a mortgage given
                                    lenders’ stringent application processes as well as the fact that there is a cash-gap shortfall at all.

                                    Areas that have a high concentration of residents with a younger age profile like Knowsley are
                                    more likely to struggle with their applications for a mortgage. This is supported by a report
                                    by Which?4 that found homeowners aged 18-24 are much more likely to have faced mortgage
                                    rejection than older applicants. Areas that have a high concentration of residents with an
                                    older age profile could take advantage of Retirement Interest Only (RIO) mortgages. Similar
                                    comparisons can be found in the Appendix for Unitary Authorities and Counties.

                        ELMBRIDGE
14                                                                                                                                            15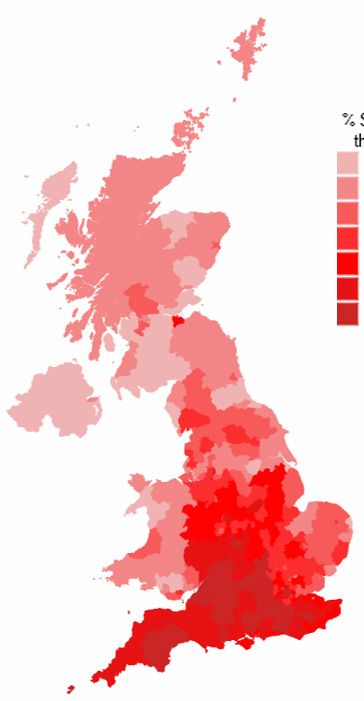
HOUSING AFFORDABILITY - ELMBRIDGE &
     KNOWSLEY
     Figure 1: Map of Borough of Elmbridge                                                                                                            Figure 2: Map of Knowsley Metropolitan Borough

     Table 3: Borough of Elmbridge – Cash Gap by Lifestage and House Type                                                                             Table 4: Knowsley Metropolitan Borough – Cash Gap by Lifestage and House Type

                                                               Average House Price by House Type (Source: CACI StreetValue)                                                                                   Average House Price by House Type (Source: CACI StreetValue)
                Average Annual Gross                                                                                                                             Average Annual Gross
                 Household Income                                                                                                                                 Household Income
                                                                 Flat/                                 Semi-                                                                                                    Flat/                                Semi-
                    by Lifestage                                                   Terraced                                  Detached         All                    by Lifestage                                                 Terraced                           Detached              All
                                                              Maisonette                              Detached                                                                                               Maisonette                             Detached
              (Source: CACI Paycheck)                                              £555,800                                 £1,455,650     £868,700            (Source: CACI Paycheck)                                            £91,750                            £227,000           £123,150
                                                              £405,500                                £697,200                                                                                                £75,850                               £136,250

      Singles & Couples                 £55,000             -£200,100           -£335,350          -£462,600           -£1,145,200       -£616,950     Singles & Couples                £26,700            £11,800            -£2,500             -£42,550        -£124,200          -£30,750

      Families                          £67,200             -£163,450           -£298,700          -£425,950           -£1,108,550       -£580,300     Families                         £33,800            £33,200            £18,850             -£21,150        -£102,850          -£9,400

      Empty Nesters                     £62,900             -£176,250           -£311,500          -£438,750           -£1,121,350       -£593,100     Empty Nesters                    £34,500            £35,250            £20,950             -£19,100        -£100,750          -£7,300

      Retired                           £43,600             -£234,100           -£369,350          -£496,650           -£1,179,200       -£650,950     Retired                          £18,700            -£12,200           -£26,500            -£66,550        -£148,200          -£54,750

      All                               £58,300             -£190,050           -£325,300          -£452,550           -£1,135,150       -£606,900     All                              £28,200            £16,400            £2,100              -£37,950        -£119,650          -£26,200

                                                                                                                                                      3: North Ayrshire Council – Rural Housing, Local Housing Strategy 2017 to 2022
     1: Shelter                                                                                                                                       https://www.north-ayrshire.gov.uk/Documents/PropertyServices/HousingBuilding/lhs-rural-housing.pdf
     https://england.shelter.org.uk/media/press_releases/articles/320,000_people_in_britain_are_now_homeless,_as_numbers_keep_rising
                                                                                                                                                      4: Which?
     2: Shropshire Council – Market Signals and Housing Affordability Profile
     https://www.shropshire.gov.uk/media/7138/market-signals-and-housing-affordability-profile-september-2017-part-ii.pdf                             Four in 10 young homeowners had a mortgage application rejected - https://www.which.co.uk/news/2019/01/four-in-10-young-homeowners-had-a-
                                                                                                                                                      mortgage-application-rejected/

16                                                                                                                                                                                                                                                                                                 17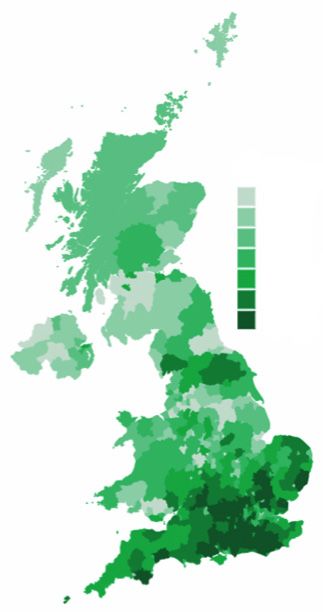
HOUSING AFFORDABILITY FROM A
     DEVELOPERS PERSPECTIVE

     How much can builders afford to charge?                                                                                  The Impact of Savings

     As the affordability of housing becomes an increasingly contentious point – for developers, buyers and local             Savings can have a huge impact on what people can afford. Dramatic differences in house prices mean deposits play
     authorities alike – house builders need to pay ever closer attention to how they craft their pricing strategy.           a varying role, and a 10% deposit on the house price can set movers back anything from £14,000 to £62,000 on
                                                                                                                              average, depending on the Region they live in.
     We’ve used our proprietary data - Acorn, Paycheck, Ocean and StreetValue - to explore the relationship between
     average house prices and budgets and how that relationship varies geographically.                                        Using CACI’s Ocean lifestyle database, we’ve taken thousands of data points about savings and mortgages to
                                                                                                                              identify how much the average mover is able to spend – and how much a lender is likely to give them.
     We’ve found that residential builders can go beyond basic statistics about an area’s average income, and create
     a more realistic pricing strategy, taking account of detailed information about households’ savings and disposable       The next section of this report provides more insight on the nation’s savers. Suffice to say many people have no
     income too.                                                                                                              savings, or very little savings relative to the cost of a house purchase. Some mortgage lenders are willing to offer
                                                                                                                              up to 4.5 times a household’s income, which puts the average mortgage at around £179,000. But with the (mean)
     So how much can the average mover afford – and how much can house builders afford to charge?                             average house costing £296,000 according to CACI’s StreetValue, that simply won’t be enough – and that’s before
                                                                                                                              you consider the deposit. It’s therefore likely that many will be staying in the rental market for years to come.

     The Rising Cost of Buying                                                                                                Table 5: House price to income ratio

                                                                                                                                                              Average House Price to
     House prices and incomes vary wildly throughout the UK. Residential builders need to alter their pricing strategy –       Region
                                                                                                                                                              Income Ratio
     as well as their development plans – to suit each local area.
                                                                                                                               London                         14.1
     Affluent areas – where incomes and savings are higher – could prove to be more profitable for developers who are
     building properties to sell to the owner-occupier market.                                                                 South East                     8.6

     In this analysis, house price to income ratios are calculated at a Regional level.                                        East of England                7.9

     The average house costs 7.4 times the average household income in the UK. Whilst this is the case, there are some         UK Average                     7.4
     huge variations regionally. The North East is the most affordable region with the average house price to income
                                                                                                                               South West                     7.3
     ratio sitting at 4.1. At the other end of the scale the average property in London is 14 times higher than the average
     household income making the capital unaffordable for the vast majority of the population.                                 West Midlands                  6.0

     Using our “cash gap” principle, based on 3 x the average household income and average house price assuming a              East Midlands                  5.7
     10% deposit, and without taking into account equity or the possibility of a higher loan to value ratio, only 3% of the
     London
         10 population would be able to afford to buy a property in the capital.                                               North West                     5.3

     It is therefore no surprise to see rapid growth of the Private Rented Sector (PRS) and Buy To Rent (BTR)                  Wales                          5.2
     schemes. All across the country, in areas where buying is unattainable, private rental development and buy-to-let
     developments are likely to provide a more viable and profitable strategy for housing developers.                          Northern Ireland               5.0

     Of course, this is well-trodden ground for developers – it’s well known how much it costs to buy and rent. But what       Yorkshire and The Humber       4.9
     is not widely understood is how much the average likely mover really has to spend.
                                                                                                                               Scotland                       4.6

                                                                                                                               North East                     4.1

18                                                                                                                                                                                                                                                   19
THE SAVINGS MARKET
A conversation about the Wealth of the Nation wouldn’t be complete without a look at the savings market. This Figure 4: Map of % adults Figure 5: Map of % adults Figure 6: Map of % savers
is touched on in the previous section, and there is around £1,320 billion5 sitting in savings accounts across the UK – with a savings account, by with savings £100k+, by who take out savings via
that’s £47,000 for every household, or £25,000 per person if every adult in the country were to get an equal share local authority local authority a digital channel, by local
of savings pot. authority
“ But with 43% of the population not having a savings
account at all, and 16% having fewer than £500 of savings,
% Adults with
Savings Account
Lowest
% Adults with
Savings £100k+
Lowest
% Savers opening
account through
digital channels
Lowest
Average
the wealth is clearly distributed incredibly unevenly. “ Average Average
Highest
Highest Highest
First of all, let’s look at who is a typical “saver”. Geographically, savers can be found across the UK – as you might
imagine – but there are some clear regional distinctions. There are much higher concentrations in South East
England – which is where the highest value savers seem to be concentrated also. In general rural areas tend to have
higher proportions of savers than urban areas – although there are exceptions. Contains public sector information licensed under the Open Government Licence v3.0. ©2019 CACI Limited and all other applicable third party notices can be found at http://www.caci.co.uk/copyrightnotices.pdf
If we take a look at the parts of the country with the highest incidence of savers, it is perhaps no surprise to see
the affluent areas in the Home Counties dominate the top five postcode sectors. Fewer savers are found in inner
city locations, particularly in the West Midlands. And there is a similar picture with savings value – the very highest
savings wealth (£100k+) can be found in London and the South East, and the lowest in other cities – particularly in
the North.
5:
Figure reflects interest bearing cash deposits & premium bonds – Source: Bank Of England and NS&I
20 21Table 6: Top 5 and Bottom 5 Postcode Sectors by % Adults with a Savings Account
Postcode Sector Area Name % Adults with a savings account
BN20 0 East Dean, East Sussex 82.9%
KT24 5 Effingham, Surrey 82.8%
RG9 6 Henley-on-Thames, Oxfordshire 82.4%
CR3 7 Woldingham, Surrey 82.3%
KT22 0 Oxshott, Surrey 82.1%
B35 7 Castle Vale, Birmingham 21.8%
B11 1 Sparkbrook, Birmingham 21.5%
B8 1 Saltley, Birmingham 21.5%
B19 1 Lozells, Birmingham 21.4%
B66 2 Winson Green, Birmingham 20.0%
Table 7: Top 5 and Bottom 5 Postcode Sectors by % Adults with Savings £100k+
Postcode Sector Area Name % Adults with a savings £100k+
KT22 0 Oxshott, Surrey 10.3%
AL5 2 Harpenden, Hertfordshire 10.3%
SW7 1 South Kensington, London 10.1%
SW1X 8 Knightsbridge, London 9.3%
SL9 7 Gerrards Cross, Buckinghamshire 9.1%
TS3 9 North Ormesby, Middlesbrough 0.1%
L 33 9 Kirkby, Liverpool 0.1%
SK13 0 Gamesley, Glossop 0.1%
SR5 4 Downhill, Sunderland 0.1%
TS6 7 Grangetown, Middlesbrough 0.1%
22 23THE SAVINGS MARKET
The geographic patterns can be partly explained by the typical demographics of a saver, and the types of places that Traditional banks and building societies in these locations can offset falling branch sales by encouraging online
these people live. The savings market is often thought to be largely made up of older individuals, often homeowners, savings. Above the line marketing or in-branch messaging in these areas can signpost young savers to direct digital
with above-average income, and quite often empty-nesters making the most of their new-found disposable income. channels – removing the acquisition cost of aggregators and reducing the threat from peer-to-peer lenders.
CACI’s data backs up this generalisation for savers as a whole. Half are aged 55-plus, almost half own their own And what if you’re one of these digital disruptors? Well an understanding of location by target demographic can
home outright, and income is 50% higher than average (even including the retired). underpin out-of-home campaigns and return a higher return on investment (ROI). As part of a marketing mix, and
with the right messaging, there is a large slice of the new-generation savings pie to be won.
However, it is dangerous to rely on stereotypes alone when engaging with existing customers, or seeking out new
ones – and this is particularly true for the savings market. The definition of “savings” has been blurred over the The last word is saved for the 59%. This was the proportion of the population with no or very little savings. It
years. Many banks now offer market-beating rates on current account balances, and peer-to-peer lending looks is just as important that these people aren’t overlooked. Saving little and often, and creating a buffer for that
more like saving than investing with its “near-instant access” and fixed rate returns. Add in the continued rise of the “rainy day”, should be encouraged as a means of avoiding financial difficulty and expensive short-term borrowing.
aggregator (think price comparison websites and consumer forums like Money Saving Expert), and the landscape is Knowing where these non-savers are can help direct resource and advice to where it might be needed most.
very different to a few years ago.
And importantly, those engaging with these new channels are quite different to the typical saver. First of all, they
are considerably younger. The growth in those taking out savings accounts through a price comparison site or
other website is greatest amongst what CACI’s Acorn classification call “Starting Out” and “Rising Metropolitans” –
typically 18-34 year-olds, pre-children, renting or first-time buying in urban areas.
These younger savers are more likely to save regularly (24% save every month vs. 18% of all UK savers), and more
likely to save for a specific purpose (51% vs. 40%) – such as a home or a wedding. Savings providers should be using
this information in their messaging to these demographics.
Data shows they are also much less risk averse, which coupled with higher digital engagement, makes them the
perfect target market for peer-to-peer lenders. There is no need to lock money away for long periods, and less
concern that savings aren’t guaranteed by the Financial Services Compensation Scheme. So where are the hotspots
of this new generation of digitally-focussed, savvy savers?
Well there are pockets in most parts of the country, but they do seem to be concentrated in the South East.
Commuter towns feature strongly, as do large cities with an affluent young population such as Bristol, Brighton and
Oxford.
24 25SUMMARY
CACI’s Paycheck provides a detailed understanding of geographic areas according to gross income that is key for
any organisation to meet the needs of customers and communities. Accurate, granular data enables organisations to
provide appropriate services and to make sound commercial judgements and prioritise service delivery.
Looking at housing affordability, we assessed the cash gap between income and house price. Our analysis has shown
that people living in lower income areas are more likely to be able to afford homes in their local area as their cash
gap is generally a lot less when compared against people in higher income areas. That said, people living in lower
income areas could struggle to qualify for a mortgage as there is still a shortfall in their finances.
Residential builders need to take households’ savings and disposable income into consideration when defining their
pricing strategies. Affordability varies considerably across the country and therefore there shouldn’t be a one size
fits all strategy.
According to a strict interpretation of affordability, only 3% of London’s population can purchase a property in
London, which could explain the rapid growth of the Private Rental Sector (PRS) and Buy To Rent (BTR) market.
There are clearly more than 3% of Londoners who are property owners either because they have a combination of
equity and savings beyond the minimum 10%, have a higher loan to value mortgage ratio, or because they are reliant
on other sources for loans or gifts.
No one will be surprised that savers are concentrated in more affluent areas and generally more mature areas.
However we’re also seeing younger savers enter the market via new channels and these are typically 18-34
year-olds, pre-children, renting or first-time buying in urban areas. The savings market is evolving. For example
peer-to-peer lending looks more like saving than investing with its “near-instant access” and fixed rate returns. This
younger audience is much less risk averse, which coupled with higher digital engagement, makes them a perfect
target market for peer-to-peer lenders.
For more information on the findings in this report, CACI’s datasets or consultancy services please visit us at
www.caci.co.uk or get in touch directly.
Tel: 020 7605 6164
Email: seldridge@caci.co.uk
Graham Smith Stewart Eldridge
Associate Director Head of Public Sector Data Web: www.caci.co.uk
26 27APPENDIX
Unitary Authority Housing Affordability - Richmond & Blaneau Gwent County Authorities Housing Affordability – Surrey & Cumbria
Tables 8 and 9 show the cash gap by lifestage and house type for Richmond and Blaneau Gwent. Tables 10 and 11 show the cash gap by lifestage and house type for Surrey and Cumbria.
Table 8: London Borough of Richmond upon Thames – Cash Gap by Lifestage and House Type Table 10: Surrey County Council – Cash Gap by Lifestage and House Type
Average House Price by House Type (Source: CACI StreetValue) Average House Price by House Type (Source: CACI StreetValue)
Average Annual Gross Average Annual Gross
Household Income Household Income
Flat/ Semi- Flat/ Semi-
by Lifestage Terraced Detached All by Lifestage Terraced Detached All
Maisonette Detached Maisonette Detached
(Source: CACI Paycheck) £889,550 £1,661,200 £887,450 (Source: CACI Paycheck) £417,000 £898,250 £576,400
£547,900 £1,095,900 £302,250 £499,050
Singles & Couples £58,000 -£319,100 -£626,650 -£812,300 -£1,321,100 -£624,750 Singles & Couples £50,700 -£119,950 -£223,200 -£297,050 -£656,300 -£366,650
Families £66,200 -£294,450 -£602,000 -£787,700 -£1,296,450 -£600,100 Families £61,700 -£86,850 -£190,150 -£263,900 -£623,250 -£333,600
Empty Nesters £59,600 -£314,200 -£621,700 -£807,400 -£1,316,200 -£619,800 Empty Nesters £60,250 -£91,350 -£194,650 -£268,450 -£627,750 -£338,050
Retired £39,600 -£374,300 -£681,800 -£867,500 -£1,376,300 -£679,900 Retired £39,250 -£154,250 -£257,550 -£331,400 -£690,650 -£401,000
All £58,000 -£319,050 -£626,550 -£812,250 -£1,321,050 -£624,650 All £53,750 -£110,800 -£214,100 -£287,950 -£647,200 -£357,550
Table 9: Blaenau Gwent – Cash Gap by Lifestage and House Type Table 11: Cumbria County Council – Cash Gap by Lifestage and House Type
Average House Price by House Type (Source: CACI StreetValue) Average House Price by House Type (Source: CACI StreetValue)
Average Annual Gross Average Annual Gross
Household Income Household Income
Flat/ Semi- Flat/ Semi-
by Lifestage Terraced Detached All by Lifestage Terraced Detached All
Maisonette Detached Maisonette Detached
(Source: CACI Paycheck) £82,900 £198,450 £99,900 (Source: CACI Paycheck) £132,500 £321,800 £193,250
£56,089 £110,600 £113,900 £173,500
Singles & Couples £24,500 £23,050 -£1,050 -£26,000 -£105,100 -£16,400 Singles & Couples £31,800 -£7,200 -£23,900 -£60,800 -£194,250 -£78,550
Families £36,000 £57,400 £33,300 £8,350 -£70,750 £17,950 Families £43,350 £27,500 £10,750 -£26,100 -£159,550 -£43,900
Empty Nesters £34,650 £53,450 £29,350 £4,400 -£74,650 £14,000 Empty Nesters £44,350 £30,500 £13,800 -£23,100 -£156,550 -£40,850
Retired £18,050 £3,600 -£20,550 -£45,450 -£124,550 -£35,850 Retired £25,200 -£26,850 -£43,600 -£80,500 -£213,950 -£98,250
All £28,000 £33,450 £9,350 -£15,600 -£94,700 -£6,000 All £35,600 £4,250 -£12,500 -£49,400 -£182,850 -£67,150
Richmond and Blaenau Gwent are demographically two significantly different areas across the Country.
In terms of geographic coverage, Blaenau Gwent is almost double the size of Richmond. However the
The geographic area that Cumbria covers is more than four times the size of Surrey and its population
difference in population - 70,000 compared to 199,000 – is quite stark in contrast. Although Blaenau
(498,000) is less than half that of Surrey (1.2 million). The demographic make-up of both counties is also very
Gwent’s towns suggest it is an urban borough, it is actually a largely rural area with the predominant Acorn
different. Cumbria has high concentrations of Countryside Communities, Mature Money and Modest Means
demographic group – Modest Means – representing almost half of the overall population. Richmond, on the
whereas the predominant groups in Surrey are Executive Wealth, Career Climbers and Mature Money.
other hand is a leafy and wealthy suburb in West London where the demographic groups City Sophisticates,
Executive Wealth and Career Climbers unsurprisingly represent the lion’s share of the population.
28 29020 7602 6000 info@caci.co.uk
You can also read