Population effects of New Zealand sea lion mortality scenarios relating to the southern arrow squid fishery at the Auckland Islands - MPI
←
→
Page content transcription
If your browser does not render page correctly, please read the page content below
Population effects of New Zealand sea lion
mortality scenarios relating to the southern
arrow squid fishery at the Auckland Islands

New Zealand Aquatic Environment and Biodiversity Report No. 223

 J. Roberts

ISSN 1179-6480 (online)
ISBN 978-0-9951271-4-2 (online)

July 2019
Requests for further copies should be directed to:

Publications Logistics Officer
Ministry for Primary Industries
PO Box 2526
WELLINGTON 6140

Email: brand@mpi.govt.nz
Telephone: 0800 00 83 33
Facsimile: 04-894 0300

This publication is also available on the Ministry for Primary Industries websites at:
http://www.mpi.govt.nz/news-and-resources/publications
http://fs.fish.govt.nz go to Document library/Research reports

© Crown Copyright – Fisheries New Zealand
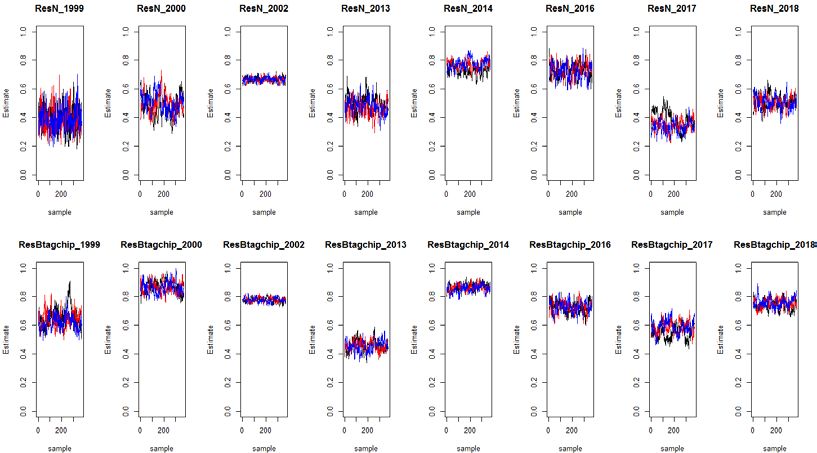
TABLE OF CONTENTS

EXECUTIVE SUMMARY 1

1. INTRODUCTION 2

2. METHODS 3
 2.1 Demographic population model 3
 2.1.1 Observations 3
 2.1.2 Model structure 4
 2.1.3 Demographic model development and parameterisation 5
 2.1.4 Historical fishery deaths 7
 2.2 Model runs 8
 2.3 MCMC methods 8
 2.4 Estimation of the population sustainability threshold (PST) 9
 2.5 Population projections 9

3. RESULTS 10
 3.1 Model diagnostics 10
 3.2 Parameter estimates 10
 3.3 Population size and PST 11
 3.4 Population projections 12

4. DISCUSSION 15
 4.1 Limitations of data and modelling approach 15
 4.2 Population Sustainability Threshold 16
 4.3 Population effects of fisheries deaths 17
 4.4 Demographic drivers of population change 17

5. CONCLUSIONS 18

6. ACKNOWLEDGMENTS 18

7. REFERENCES 19

APPENDIX 1 – OBSERVATIONS FITTED TO BY POPULATION MODELS 21

APPENDIX 2 – MAXIMUM POSTERIOR DENSITY RUN DIAGNOSTICS 23

APPENDIX 3 – MCMC RUN DIAGNOSTICS 25

APPENDIX 4 – MCMC PARAMETER ESTIMATES 31

APPENDIX 5 – POPULATION PROJECTION OUTPUTS 33

EXECUTIVE SUMMARY

Roberts, J. (2019). The population effects of New Zealand sea lion mortality scenarios relating to
the southern arrow squid fishery at the Auckland Islands.

New Zealand Aquatic Environment and Biodiversity Report No. 223. 35 p.

A new demographic population model was developed to estimate a revised Population Sustainability
Threshold (PST) for New Zealand sea lions in the commercial trawl fishery for Southern arrow squid
at the Auckland Islands (SQU 6T). This population model was then used to simulate the projected
population effects of alternative levels of future deaths relating to this fishery, including at the PST
level.

The female population model was a modification of the previous model used to estimate the PST for
this population (Roberts 2017), updated with new pup production estimates and mark resighting
observations up to the 2018/19 field season. The model was structured to estimate demographic rates
separately for periods of increasing (1990 to 1999), decreasing (1999 to 2009) and stable pup production
trajectory (2010 to 2019).

Models also incorporated estimates of southern arrow squid trawl fishery related-deaths, derived from
the outputs of separate research projects estimating historical fishery captures (Large et al. 2019) and
cryptic mortality levels relating to the use of sea lion exclusion devices (SLEDs) (Meyer 2019).

The base case model produced good fits to pup census, mark-resighting and age distribution
observations. Model estimates indicate that the change in pup production trajectory (from decreasing to
stable) was driven by increased annual survival at age groups 2–5 and 6–14 years, and a slightly
increased annual pupping rate. The model estimate of first year ‘pup’ survival for the period of stability
was virtually unchanged from the period of decline. The base model estimated a current population size
of 4293 females in 2019 (95% credible interval (95% CI) = 4120–4473), which was subsequently used
in the estimation of the PST.

A new PST criterion was defined by Fisheries New Zealand, using the Spatially-Explicit Fisheries Risk
Assessment (SEFRA) approach. A calibration coefficient ( ) of 0.1 was selected as the base case value
by Fisheries New Zealand, consistent with population recovery to (or preventing depletion below) 95%
of unimpacted levels, with future deaths at the PST level. At this level of , a female-only PST of 26
individuals was estimated. This compares with a mean of 2.8 or 5.4 female deaths in the squid fishery
from 2013 to 2017, based on the median or upper 95% CI of estimated deaths for the Auckland Islands
southern arrow squid trawl fishery.

Future mortality at the PST ( of 0.1) was estimated to result in a mature female population size in
2025 of between 95.0% (95% CI = 94.7–95.2%) and 96.1% (95% CI = 95.8–96.3%) of what would
have occurred in the absence of fishery mortality (depending on the future population growth scenario).
Under the stable population growth scenario, future deaths consistent with recent estimated levels would
result in a population size in 2025 of between 99.0% (95% CI = 99.0–99.1%) and 99.5% (95% CI =
99.5–99.5%) of unimpacted levels, depending on whether the upper 95% CI, or median of historical
deaths was assumed, respectively.

Note that this modelling framework does not account for density dependence, such that the estimates
of future population status produced here will be lower than those of comparable assessment models,
under which productivity increases as the population declines in size.

Fisheries New Zealand Population simulation Auckland Islands NZ sea lions • 1
1. INTRODUCTION

The New Zealand sea lion has an extremely concentrated breeding distribution with 97–98% of annual
pup production at either the Auckland Islands and Campbell Island, in the New Zealand Sub-Antarctic
region (Weir et al. 2019, Fyfe 2019, Chilvers 2019, DOC 2019) (Figure 1). The largest breeding
population at the Auckland Islands was estimated to have declined by about 40% between the late-
1990s and the 2008/09 field season (seasons hereafter referred to by the end year, i.e. 2009), although
annual pup production estimates appear to have stabilised since then (DOC 2019; Roberts 2017). The
apparent stabilisation of the Auckland Islands breeding population (and increasing populations
elsewhere) led to an improvement in the species’ New Zealand Threat Classification to “Nationally
Vulnerable”, the third highest domestic threat rating (Baker et al. 2019). Known threats to the Auckland
Islands population include deaths relating to commercial fisheries at the Auckland Islands—including
southern arrow squid and scampi trawl fisheries (SQU 6T and SCI 6A, respectively)—Klebsiella
pneumonia infection-related mortality of pups, and likely indications of limited prey availability and
associated nutritional stress (Augé 2010; Meyer et al. 2015; Roe et al. 2015; Roberts & Doonan 2016;
Roberts et al. 2018; Stewart-Sinclair 2013).

Figure 1: Location of New Zealand sea lion breeding populations, including the Auckland Islands
population addressed by this assessment. Grey lines represent the 200 m, 500 m and 1000 m bathymetric
contours; the Northern Box of SQU 6T, where the Auckland Islands southern arrow fishery operates, is
highlighted with a green hatched polygon.

Previous assessments have estimated mortality thresholds for New Zealand sea lions relating to
commercial squid and scampi trawl fisheries at the Auckland Islands (e.g., Abraham et al. 2017;
Fletcher 2004; Roberts 2017). Population models have also been developed for New Zealand sea lions
at the Auckland Islands to assess the population consequences of fishery-related deaths at different
levels (e.g., Breen et al. 2016; Roberts & Doonan 2016; Roberts 2017).

The latest assessment estimated population sustainability thresholds (PSTs) for New Zealand sea lions
at the Auckland Islands, using a population model fitted to demographic observations of females. The

2 • Population simulation Auckland Islands NZ sea lions Fisheries New Zealand

PST criterion was defined by the Ministry for Primary Industries (MPI) as the maximum number of
annual mortalities relating to this fishery which would result in a less than 10% probability of a 5%
depletion in the mature female population projected over 5 years, relative to that occurring in the
absence of fishery-related mortality. This resulted in a PST of 23 females (46 combined sexes) (Roberts
2017). This PST value was then adjusted to account for potential mortalities in other trawl fisheries at
the Auckland Islands including for scampi (SCI 6A) to obtain an annual mortality limit of 38 sea lions
(combined sex) in the squid trawl fishery (MPI 2017).

The research described in this report updates the demographic population model used to estimate the
PST for NZ sea lions in the Auckland Islands squid trawl fishery (SQU 6T), and to estimate the
population effects of fishery deaths at different levels. The specific project objectives were as follows:

 1. Update the demographic population model of female New Zealand sea lions at the
 Auckland Islands, incorporating: new demographic observations up to the 2019 field season
 and estimates of historical annual squid trawl fishery deaths derived from a spatial fisheries risk
 model (PRO2017-10) and assessment of cryptic mortality rates (PMM2018-09). Use these
 demographic models to estimate demographic rates driving periods of increasing, declining and
 stable pup production trajectory.

 2. Estimate the Auckland Islands female New Zealand sea lion population size in 2019 and use
 this to calculate the female New Zealand sea lion PST for the Auckland Islands population,
 consistent with the population recovery goal(s) specified by Fisheries New Zealand.

 3. Undertake simulations using demographic models of female New Zealand sea lions at the
 Auckland Islands to estimate the effects of future squid fishery deaths on sea lion
 population growth, assuming alternative scenarios of: historical fishery deaths; future
 population trajectory (i.e., increasing, decreasing or stable); and future deaths (e.g., consistent
 with the PST, or a continuation of estimated deaths for the recent period).

2. METHODS

 2.1 Demographic population model

Bayesian demographic population models were developed for female New Zealand sea lions at the
Auckland Islands, using the SeaBird demographic modelling software (e.g., Francis & Sagar 2012;
Roberts & Doonan 2016). In short, the model simulates the numbers of female sea lions of different
ages through time, and fits these numbers to the available demographic information. Population model
structures were based on the base case models developed by Roberts (2017) that were modified to
facilitate the simulation of future population trajectories consistent with historical observed periods of
population increase, decline and relative stability. Models integrated information from mark-resighting,
age distribution, and annual pup production estimates, and incorporated: new field-based observations
up to 2019; and revised estimates of historical squid trawl fishery-related annual deaths, derived from
the outputs of Large et al. (2019) and Meyer (2019).

 2.1.1 Observations

Population models were fitted to three sources of demographic information through time: mark-
resighting observations; estimates of annual pup production; and the age composition of lactating
females.

Annual pup production has been estimated for all Auckland Islands breeding rookeries since 1995,
using a consistent methodology (DOC 2019). These estimates were then multiplied by 0.5 to
approximate the number of female pups born each year (Table A1-1). A coefficient of variation (CV)

Fisheries New Zealand Population simulation Auckland Islands NZ sea lions • 3
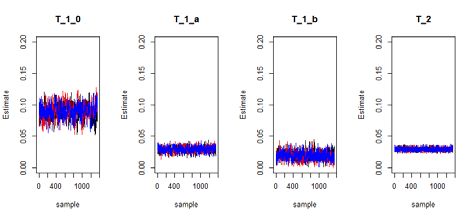
of 0.03 was assumed for all years with a normal distribution, consistent with previous modelling by
Roberts (2017).

Childerhouse et al. (2010) used tooth-based ageing to estimate the age distribution of lactating females
at Sandy Bay and Dundas at the Auckland Islands in all years from 1998–2001. Following the approach
of Roberts & Doonan (2016), a combined-rookery time series of age distribution estimates was obtained
by multiplying the estimated proportion-at-age for each of the Sandy Bay and Dundas with the estimated
pup production for each respective rookery by year (Table A1-1), summing these (to estimate the total
number of breeders by age, i.e. across both rookeries) then recalculating the combined proportions-at-
age for the years 1998–2001 (Table A1-2). A multinomial distribution was assumed when fitting to age
composition estimates with effective sample size (N) of 200 for 1998, and N = 1000 for age
compositions in 1999, 2000 and 2001 (consistent with Roberts & Doonan 2016 and Roberts 2017).

The processing of mark resighting observations exactly followed the approach used by Roberts &
Doonan (2016) and Roberts (2017). Mark resighting data were extracted from the demographic database
maintained by Dragonfly Data Science (Dragonfly 2019). Only females marked as pups were included
in the model, which were either branded, ‘chipped’ (with Passive Integrated Transponder (PIT) tags),
or flipper-tagged. A distinction was made between these in the model, because of mark-type differences
in annual resighting probability, and the inability for field scientists to distinguish between un-tagged
females and females which were flipper-tagged only as pups (i.e. not also branded or chipped), but for
which all tags had subsequently fallen off (tag loss). This was required so that tag loss rate could be
estimated, which would otherwise create a negative bias in annual survival estimates.

Also following the approach of Roberts & Doonan (2016), ‘phantom tagged’ female pups were
appended to the mark-resighting data to account for pups known to have died prior to the date of tagging.
These pups were specified as not having been seen after the year of tagging (to replicate the effect of
mortality within the first year). The method for estimating the number of phantom tags was as specified
by Roberts & Doonan (2016). The total number of pups marked each year by mark type (and phantom
tagged pups) are given in Table A1-3. Annual resights by age group are shown along with model fits
(Figure A2-3).

 2.1.2 Model structure

The set of states that any sea lion can occupy in a particular year is called the partition. The model
partitioned the population into ages 1 to 8+ years (for the 8+ partitioning), or 1 to 15+ years (for the
15+ partitioning), with the last age class being a plus group (no maximum age was specified). Each age
class was further partitioned into a number of states depending on pupping status and the number of
flipper tags. The partition, therefore, accounted for numbers of sea lions by age, pupping status and
number of flipper tags within an annual cycle, where movement between partition states was determined
by the transition parameters. Sea lions entered the partition as pups and were removed by mortality.

Two partition schemes were used (Figure 2):

 • The 8+ Partitioning considered that sea lions between ages 0 to 7 are “immature” if they
 had never pupped (individuals were assumed not to pup until age 4); a sea lion between age
 4 and 8+ became a “pupper” if she produced a pup in that year. A sea lion which did not
 produce a pup before age 8 was considered as “immature”, or a “non-pupper” if age 8+.
 With this partition scheme, the model was able to estimate the relative probability of
 pupping at age.

 • The 15+ Partitioning was as the 8+ Partitioning (above), except that the plus group was at
 age 15+. This partitioning allowed for the estimation of annual survival for the senescent
 age group (15+) (Surv15) separately from younger ages.

4 • Population simulation Auckland Islands NZ sea lions Fisheries New Zealand
Accordingly, each re-sighting observation in the mark-resighting dataset was assigned a state based on
age and pupping status, as well as the number of remaining tags. The pupping status was derived from
observations in the “behaviour” field of the mark-resighting data (Dragonfly 2019). If during a
particular year an individual was observed giving birth or nursing a pup, then a “pupper” status was
ascribed in that year. If one of the remaining females was observed three times without a pup, then a
“non-pupper” status was ascribed. If an individual was observed, but the pupping status could not be
ascribed according to these rules above, then “unknown” pupper status was ascribed to that observation
(a composite class of puppers and non-puppers; not shown in the partition diagram below). All
individuals aged 3 or less were assumed to be unable to produce a pup.

Figure 2: Model partitionings used, including: the ‘8+ model’ (top) used by the base case model
configuration ‘Yearblock8’; and: the 15+ model (bottom) ‘Yearblock15, which has convergence issues at
MCMC.

Parameter estimation was by maximum likelihood. Methods used for: parameter estimation, the
inclusion of fishery-related deaths, the likelihoods for different observation-types, and the derivation of
the objective function also all follow those described in detail by Roberts & Doonan (2016).

 2.1.3 Demographic model development and parameterisation

Model parameterisations were modified from the base models used by Roberts & Doonan (2016) and
Roberts (2017), with respect to the estimation of annual resighting probability, and the year-blocking
of year-varying demographic rates.

Based on MCMC model run estimates by Roberts & Doonan (2016), the annual resighting probabilities
of tag and chip-marked females were very similar, i.e., 0.85 (95% CI = 0.77–0.92) for pupping females
that were flipper tagged only, and 0.88 (95% CI = 0.80–0.94) for chipped females in the latest model
years. As such, the decision was made to use a combined resighting parameter (ResP_tag_chip) for both of
these mark types in order to reduce the potential for confounded model parameters.

The corresponding demographic rates driving periods of different pup production trajectories (i.e.,
increasing—from 1990 to 1999, decreasing—from 2000 to 2009, or stable—since 2010) were required

Fisheries New Zealand Population simulation Auckland Islands NZ sea lions • 5
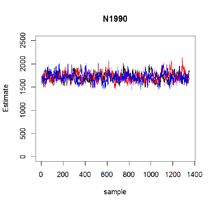
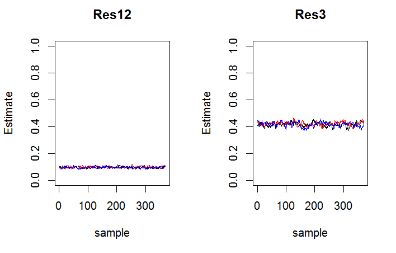
for estimating the population effects of future fishery-related death scenarios, given alternative future
population trajectories. Thus, key demographic rates were year-blocked, with the breakpoints in
survival of immature ages time-lagged to account for the time taken to reach maturity and effect changes
in pup production trajectory. The demographic rate year blocks corresponding to each pup production
phase (i.e., increasing, decreasing or stable) are given in Table 1. Survival at age 1 (Surv1) was held
constant with respect to year, because this would otherwise have been highly correlated with changes
in survival in the first year of life (Surv0). Initial model exploration of the data found no evidence for a
change in the proportion of females breeding at age 4 (Mat4) based on model likelihood, so this was
also held constant with respect to year.

A list of all parameters estimated by the two models (Yearblock8 and Yearblock15) is displayed in
Table 2, along with the year blocks used for year-varying parameters. Uniform priors were assumed for
all parameters, bounded at 0 and 1 for all except N1990 (the total estimated number of breeders in 1990)
(100, 4000), and annual survival parameters, which all used an upper bound of 0.99, consistent with
previous modelling by Roberts & Doonan (2016) and Roberts (2017).

Table 1: Year blocks specified for year-varying parameters Surv0 (annual survival to age 1), Surv2
(survival at ages 2-5), Surv6 (survival at ages 6+) and PrP (annual pupping rate), consistent with
increasing, declining, and stable pup production phases.

 Parameters and year blocks used for each pup production phase
 Phases of pup production (years) Surv0 Surv2 Surv6** PrP
 Increasing (1990–1999) 1990–1993 1990–2007* 1990–1999 1990–1998
 Decreasing (2000–2009) 1994–2005 1990–2007* 2000–2009 1999–2008
 Stable (2010–2019) 2006–2018 2008–2018 2010–2018 2009–2018
*The same year period of Surv2 was used for both the increasing and decreasing pup production phases, because the lack of
resighting effort prior to 1999 meant that potential changes in this parameter would have been confounded with survival at
other ages.
**the same year blocks were used for parameter Surv6, used by the 15+ model.

Table 2: Summary of all estimated model parameters.

 Parameter Description Year blocks (empty if
 constant with respect to
 year)
 Surv0 Annual survival age 0 1990–1993, 1994–2005,
 2006–2018
 Surv1 Annual survival age 1
 Surv2 Annual survival age 2–5 1990–2007, 2008–2018
 Surv6* Annual survival age 6+ 1990–1999, 2000–2009,
 2010–2018
 Surv6** Annual survival age 6–14 1990–1999, 2000–2009,
 2010–2018
 Surv15** Annual survival age 15+
 PrP Annual probability of pupping at age 8+ 1990–1998, 1999–2008,
 2009–2018
 Mat4 Probability of pupping at age 4 (multiplier of PrP)
 Mat5 Probability of pupping at age 5 (multiplier of PrP)
 Mat6 Probability of pupping at age 6 (multiplier of PrP)
 Mat7 Probability of pupping at age 7 (multiplier of PrP)
 Res1-2 Annual resighting probability at ages 1–2
 Res3 Annual resighting probability at age 3
 ResN Annual resighting probability of non-puppers 1999, 2000–2001, 2002–
 2012, 2013, 2014–2015,
 2016, 2017, 2018

6 • Population simulation Auckland Islands NZ sea lions Fisheries New Zealand
ResP_tag_chip Annual resighting probability of puppers that were not 1999, 2000–2001, 2002–
 branded as pups 2012, 2013, 2014–2015,
 2016, 2017, 2018
 ResP_brand Annual resighting probability of puppers branded as pups
 (forced to equal 1)
 T1_0 Annual probability of losing a single tag in the first year
 T1_a Functional form parameter that gives the probability of
 losing 1 tag in a year (1)
 T1_b Functional form parameter that gives the probability of
 losing 1 tag in a year (2)
 T2 Annual probability of losing two tags in a year
 N1990 Total number of breeders in 1990
*Parameter Surv6 (annual survival at age 6+) was estimated when using the 8+ model partition only.
**Parameters Surv6 (annual survival at age 6–14) and Surv15 (annual survival at age 15+) were estimated when using the 15+
model partition only.

 2.1.4 Historical fishery deaths

Model runs incorporated estimates of historical annual fishery-related deaths of female New Zealand
sea lions in the Auckland Islands southern arrow squid trawl fishery (SQU 6T) for years 1990 to 2019
(fishing seasons 1989/90 to 2018/19). Models incorporating historical trawl mortality produced
estimates of annual survival that would have occurred in the absence of that mortality, which can then
be used by model projections.

For the years 1993 to 2017, models either used the median or upper 95% CI of annual female capture
estimates from a spatially-explicit fisheries risk assessment (SEFRA) model of New Zealand sea lions
at the Auckland Islands (Large et al. 2019). The spatial risk model did not produce fishery capture
estimates for 2018 and 2019, so, for these years the arithmetic mean of estimates from 2013–2017 was
used. For the years 1990 to 1992, the reported squid catch tonnage by fishing season for the SQU 6T
fishery (Fisheries New Zealand, 2018, pp. 60) was used to estimate sea lion captures, by calculating the
ratio of squid catch in each year relative to 1994 (1993 was not used on the basis of anomalously low
squid catch in that year, suggesting that fishing operations were likely to be atypical), and then applying
the respective ratio to the 1994 estimate of sea lion captures to estimate sea lion captures in 1990–1992.
In order to account for cryptic mortality relating to the use of sea lion exclusion devices (SLEDs),
Fisheries New Zealand specified that a cryptic mortality multiplier of 1.5 was then applied to annual
captures since 2009 to estimate annual deaths in those years (note that this is slightly higher than the
base case cryptic mortality multiplier estimated subsequently by Meyer 2019). This multiplier was
informed by the preliminary outputs of separate research estimating mortality relating to the use of
SLEDs (Meyer 2019). These annual mortality values were applied to the 3+ age group, with equal
vulnerability assumed across these ages (Table 3).

To account for pup mortality relating the mortality of females in the squid trawl fishery, related pup
deaths were also incorporated into the model. Annual female pup deaths were calculated by multiplying
annual adult female mortality by 0.375 (assuming a 0.75 pupping rate, 50:50 sex ratio and 100%
mortality of all pups born to adult females killed) (Table 3).

Fisheries New Zealand Population simulation Auckland Islands NZ sea lions • 7
Table 3: Historical estimated annual deaths at ages 0 (pups) and 3+ used by assessment model runs, based
on the median or upper 95% CI of spatial risk model estimates.

 Median female deaths Upper 95% CI female deaths
 Year Age 3+ Pups Age 3+ Pups
 1990 48.43 18.16 67.47 25.30
 1991 25.99 9.75 36.21 13.58
 1992 26.48 9.93 36.90 13.84
 1993 10.02 3.76 13.53 5.07
 1994 84.21 31.58 117.32 44.00
 1995 75.73 28.40 105.43 39.54
 1996 85.35 32.01 115.58 43.34
 1997 52.80 19.80 75.42 28.28
 1998 28.85 10.82 38.79 14.55
 1999 5.99 2.25 9.21 3.45
 2000 19.65 7.37 27.16 10.19
 2001 8.96 3.36 12.39 4.65
 2002 24.49 9.18 33.44 12.54
 2003 23.10 8.66 32.21 12.08
 2004 32.23 12.09 45.42 17.03
 2005 37.13 13.92 53.26 19.97
 2006 32.46 12.17 50.06 18.77
 2007 16.66 6.25 23.93 8.97
 2008 17.22 6.46 24.60 9.23
 2009 6.50 2.44 13.28 4.98
 2010 5.04 1.89 7.95 2.98
 2011 5.37 2.01 9.98 3.74
 2012 2.42 0.91 6.60 2.48
 2013 3.42 1.28 6.38 2.39
 2014 1.56 0.59 3.12 1.17
 2015 1.44 0.54 3.03 1.14
 2016 3.14 1.18 6.36 2.39
 2017 4.29 1.61 8.07 3.03
 2018 2.77 1.04 5.39 2.02
 2019 2.77 1.04 5.39 2.02

 2.2 Model runs

A list of all model runs undertaken is shown in Table 4. MCMC runs were undertaken for all of these
models.

Table 4: A list of all female New Zealand sea lion population model runs undertaken by this assessment.

 Model name Model description
 Yearblock8_zero Uses the Yearblock8 model (with a plus group at age 8+) and does not incorporate
 historical squid fishery-related deaths.
 Yearblock8_median Uses the Yearblock8 model (with a plus group at age 8+) and median historical squid
 fishery-related deaths (Table 1).
 Yearblock8_upper As the Yearblock8_median run, except that the upper 95% CI of historical squid
 fishery-related deaths was used (Table 1).
 Yearblock15_zero Uses the Yearblock15 model (with a plus group at age 15+) and does not incorporate
 historical squid fishery-related deaths.
 Yearblock15_median Uses the Yearblock15 model (with a plus group at age 15+) and median historical
 squid fishery-related deaths (Table 1).
 Yearblock15_upper As the Yearblock15_median run, except that the upper 95% CI of historical squid
 fishery-related deaths was used (Table 1).

 2.3 MCMC methods

MCMC methods followed the basic approach of Roberts & Doonan (2016). Samples were taken at 100
iteration intervals along each chain. As a preliminary step to improve mixing, the covariance matrix

8 • Population simulation Auckland Islands NZ sea lions Fisheries New Zealand
used to generate the proposal distribution was iteratively recalculated from the first 200+ samples until
the degree of MCMC mixing was adequate. This process was repeated five times, with minimal
improvement obtained in mixing from the final iteration.

Three MCMC chains were then run using the optimised covariance matrix for each model run. The
chains were longer for the Yearblock8 model runs (140 000 iterations = 1400 samples) than for the
Yearblock15 model runs (42 000 iterations = 420 samples) due to an approximate 4-fold difference in
runtime. The first 50 samples were discarded from each chain to give a total combined sample size of
4050 for the Yearblock8 model and 1100 samples for the Yearblock15 model (across all three chains
for each model run).

 2.4 Estimation of the population sustainability threshold (PST)

The method for estimating the female PST for New Zealand sea lions at the Auckland Islands was
specified by Fisheries New Zealand. This used the equation adopted for SEFRA risk assessment (Sharp
2018),

 1 max
 = ,
 2

where is the estimate of total female population size (the median estimate of the Yearblock8_zero
model for the year 2019), max is the intrinsic population growth rate (a value of 0.12 was used,
consistent with the default used for stock assessment in the U.S. (Wade 1998)), and is a calibration
coefficient that can be tuned to achieve user-specified population-based management goals. For ,
Fisheries New Zealand specified a base case value of 0.1 and sensitivity values of 0.05 and 0.20. Future
fishery mortality at these values of are consistent with population recovery to 95.0%, 97.5% or 90.0%
of the unimpacted population state, respectively, under a default assumption of linear density
dependence.

 2.5 Population projections

Projection methods also followed the basic approach of Roberts & Doonan (2016) and Roberts (2017).
The operating model and the sets of parameter distribution were used to assess the effect of alternative
future fishery-related mortalities on projected mature female population size up to eleven years into the
future (i.e., up to the year 2030, which accounts for the population effects of 10 future years of
commercial fishing operations). Demographic rates used in the projections were sampled from MCMC
estimates.

Population projections were run to estimate the population consequences of alternative levels of future
deaths relating to the squid trawl fishery (SQU 6T). Future deaths could only be specified as a constant
amount with respect to future year (i.e., rather than a proportion), so that proportion killed would be
different for increasing versus declining populations. Future catch level scenarios included: zero future
fishery-related mortality (“zero”), future deaths equal to the mean of estimates for 2013–2017
(“average”), or equal to the estimated PST with alternative levels of (0.05, 0.10 or 0.20). Thus, a total
of five alternative future catch scenarios were assessed.

In addition to assuming five alternative levels of future fishery-related deaths, population projections
also used alternative:

 • Population models (Yearblock8 or Yearblock15)
 • Historical squid trawl-related mortalities (median or upper 95% CI)
 • Future population growth trajectories (assuming demographic rate year blocks consistent with
 increasing, decreasing, or stable total pup production trends) (Table 1).

Fisheries New Zealand Population simulation Auckland Islands NZ sea lions • 9
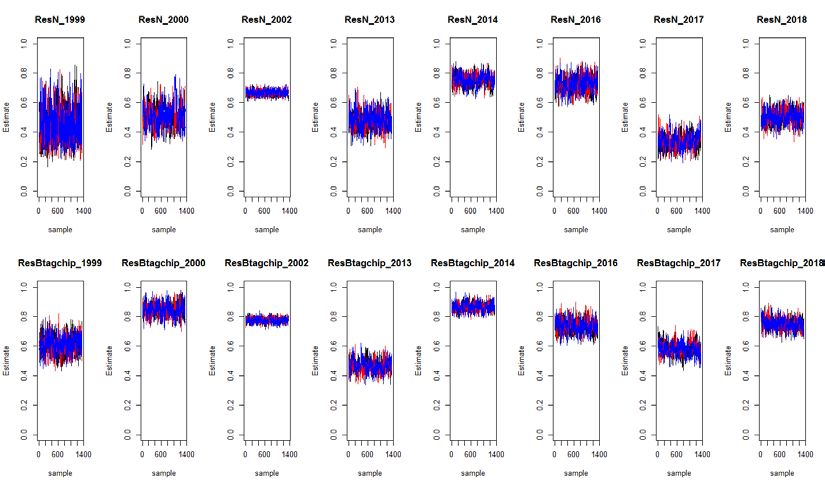
Mature female population size was derived from model estimates of population size by age and
demographic status. This was calculated as the model estimate of population size at ages 8+ (all assumed
to be mature from age 8) plus the estimated population size at ages 4–7 times the relative pupping rate
estimate at ages 4–7 (Mat4, Mat5, Mat6 and Mat7), e.g., mature female N at age 5 (Nage5) was calculated
as Nage5 × Mat5, etc.

The population effects of future fishery deaths were presented as the effect on the projected annual
population growth rate of mature females (λ), or the effect on the projected population status of mature
females relative to what was estimated in the absence of any future fishery-related mortality (N2025 %
no squid fishery deaths).

3. RESULTS

 3.1 Model diagnostics

Model fits are shown for an intermediate model run using the Yearblock8_zero model structure and
parameterisation, although without historical fishery-related deaths specified. Maximum posterior
density (MPD) model fits to annual pup production, lactating female age composition, and mark
resighting observations are shown in Appendix 2. These plots indicate a reasonable model fit to the
observations, with minimal conflict from the different sources of information.

The MCMC traces and cumulative frequency plots for demographic parameters are shown in Appendix
3. These were produced for both the Yearblock8_zero and Yearblock15_zero model runs (i.e., not
incorporating historical fishery-related deaths). These indicate that MCMC mixing was reasonable for
the Yearblock8 model, although it was poor for the Yearblock15 model (or the model run time was too
slow and the chain too short, given the degree of mixing). For this reason, the Yearblock8 model run
was used as the base case model structure, although parameter estimates and projection statistics were
also obtained for the Yearblock15 model run.

 3.2 Parameter estimates

Parameter estimates are given in Appendix 4 for all MCMC runs assuming either the median or upper
95% CI of historical fishery-related deaths. There was good agreement comparing parameter estimates
from the Yearblock8 and Yearblock15 model runs (comparing Table A4-1 and Table A4-2). As
expected, including the senescent survival age group (Surv15) in the Yearblock15 model produced lower
estimates of survival at ages 6–14 (Surv6) relative to Surv6 from the Yearblock8 model (which included
survival at older ages).

Demographic rates that will be directly affected by fishery-related deaths were bolded in Table A4-1
and Table A4-2. As expected, annual survival estimates for vulnerable ages (age 3+) increased as
historical mortality levels increased (when additional fishery mortality is incorporated, the model must
produce higher survival estimates to fit to the same observations). For the recent period of stable pup
production trajectory (2010 to 2019), survival estimates at vulnerable ages was relatively insensitive to
the incorporation of historical mortality. For example, Surv6 was 0.887 (95% CI = 0.876–0.896) for the
model not incorporating historical fishery mortality, compared with Surv6+ of 0.887 (95% CI = 0.876–
0.898) for the model incorporating the upper 95% CI of historical deaths (Table A4-1). A much greater
effect of historical fishery deaths was estimated for earlier increasing (1990 to 1999) and decreasing
(2000 to 2009) pup trajectory phases.

As a by-product, this assessment estimated the changes in demographic rates creating changes in pup
production trajectory (i.e., from increasing, to decreasing to stable). Model estimates are consistent with
the change from increasing to declining pup production trajectory being driven by:

10 • Population simulation Auckland Islands NZ sea lions Fisheries New Zealand
• A large decrease in survival to age 1 (Surv0 was 0.825 (0.715–0.960) for 1990 to 1993,
 compared with 0.389 (0.347–0.436) for 1994 to 2004; from the model using the median of
 historical fishery deaths);
 • A large decrease in survival at ages 6+ (Surv6 was 0.957 (0.936–0.977) for 1990 to 1999,
 compared with 0.857 (0.848–0.866) for 2000 to 2009); and
 • A decrease in annual pupping rate (PrP was 0.784 (0.719–0.855) for 1990 to 1998, compared
 with 0.713 (0.683–0.742) for 1999 to 2008);

The decreases in all three parameters can be consider as ‘significant’ on the basis of non-overlapping
95% credible intervals between time periods.

The more recent changes from decreasing to stable pup production trajectory was estimated to be driven
by:

 • Increased survival at ages 2–5 (Surv2 was 0.912 (0.889–0.934) for 1990 to 2007, compared with
 0.943 (0.923–0.960) for 2008 to 2018); and
 • Increased survival at ages 6+ (Surv6 was 0.857 (0.848–0.866) for 2000 to 2009, compared with
 0.887 (0.877–0.897) for 2010 to 2018); and
 • Slightly increased annual pupping rate (PrP was 0.713 (0.683–0.742) for 1999 to 2008,
 compared with 0.748 (0.718–0.777) for 2009 to 2018).

The estimate of first year survival was very similar comparing the decreasing (Surv0 was 0.389 (0.347–
0.436) for 1994 to 2004) and stable pup trajectory phases (0.378 (0.337–0.426) for 2005 to 2018). Also,
provisional modelling found no evidence for changes in pupping rate at age 4 (Mat4) between periods.

 3.3 Population size and PST

The total female population size of New Zealand sea lions at the Auckland Islands (i.e., mature and
immature) was estimated to be 4,293 individuals in 2019 (95% CI = 4,120–4,473), using the
Yearblock8_zero model (without historical fishery mortality incorporated). The equivalent estimate
from the Yearblock15_zero model was 4,314 individuals in 2019 (95% CI = 4,129–4,494). Only the
Yearblock8_zero estimate was used for the estimation of PST values (Table 5).

Given a current (2019) female population size of 4,293 individuals and the PST equation shown in
Section 2.4, female PST values of 13, 26, or 52 females were derived for ϕ values of 0.05, 0.10 and
0.20, respectively.

Fisheries New Zealand Population simulation Auckland Islands NZ sea lions • 11
Table 5: Estimated total female population size by year from the Yearblock8_zero and Yearblock15_zero
model runs. Quantiles are the median followed by the 95% credible intervals in parentheses. The 2019
estimate used to estimate the PST is bolded.

 Quantiles of estimated total female Quantiles of estimated total female
 population size population size
 Year Yearblock8 Yearblock15 Year Yearblock8 Yearblock15
 1990 5 174 (4 448–6 051) 6 047 (5 237–7 150) 2020 4 241 (4 058–4 432) 4 260 (4 068–4 452)
 1991 5 560 (4 850–6 412) 6 397 (5 607–7 438) 2021 4 189 (3 995–4 393) 4 208 (4 005–4 404)
 1992 5 980 (5 284–6 795) 6 761 (6 007–7 749) 2022 4 137 (3 934–4 352) 4 154 (3 942–4 361)
 1993 6 425 (5 753–7 204) 7 147 (6 436–8 071) 2023 4 086 (3 873–4 313) 4 098 (3 879–4 319)
 1994 6 908 (6 261–7 645) 7 549 (6 883–8 421) 2024 4 036 (3 813–4 276) 4 044 (3 820–4 276)
 1995 6 920 (6 373–7 552) 7 440 (6 860–8 174) 2025 3 987 (3 751–4 238) 3 993 (3 764–4 235)
 1996 7 027 (6 559–7 560) 7 417 (6 943–8 046) 2026 3 938 (3 691–4 201) 3 941 (3 707–4 194)
 1997 7 183 (6 793–7 622) 7 450 (7 080–7 959) 2027 3 889 (3 632–4 163) 3 890 (3 650–4 148)
 1998 7 363 (7 034–7 723) 7 492 (7 192–7 920) 2028 3 841 (3 575–4 128) 3 841 (3 591–4 109)
 1999 7 544 (7 247–7 848) 7 529 (7 273–7 904) 2029 3 793 (3 518–4 094) 3 792 (3 531–4 070)
 2000 7 591 (7 269–7 929) 7 512 (7 243–7 876) 2030 3 747 (3 460–4 059) 3 745 (3 477–4 036)
 2001 7 218 (6 925–7 515) 7 194 (6 947–7 523) 2031 3 700 (3 404–4 025) 3 698 (3 416–4 002)
 2002 6 863 (6 598–7 124) 6 872 (6 649–7 166) 2032 3 655 (3 351–3 991) 3 652 (3 358–3 967)
 2003 6 536 (6 294–6 767) 6 557 (6 358–6 822) 2033 3 611 (3 297–3 956) 3 605 (3 300–3 931)
 2004 6 233 (6 009–6 445) 6 255 (6 071–6 480) 2034 3 567 (3 243–3 922) 3 559 (3 246–3 898)
 2005 5 949 (5 740–6 146) 5 963 (5 792–6 172) 2035 3 523 (3 189–3 890) 3 514 (3 195–3 863)
 2006 5 662 (5 481–5 833) 5 684 (5 523–5 860) 2036 3 480 (3 138–3 859) 3 470 (3 144–3 828)
 2007 5 390 (5 224–5 555) 5 414 (5 252–5 573) 2037 3 437 (3 086–3 830) 3 425 (3 092–3 792)
 2008 5 129 (4 966–5 295) 5 148 (4 978–5 309) 2038 3 396 (3 036–3 799) 3 382 (3 041–3 755)
 2009 4 931 (4 769–5 101) 4 956 (4 786–5 120) 2039 3 354 (2 986–3 767) 2 992 (3 340–3 721)
 2010 4 786 (4 617–4 961) 4 841 (4 672–5 016)
 2011 4 733 (4 575–4 898) 4 771 (4 609–4 931)
 2012 4 681 (4 530–4 834) 4 707 (4 552–4 853)
 2013 4 626 (4 479–4 774) 4 647 (4 494–4 790)
 2014 4 569 (4 424–4 717) 4 588 (4 436–4 729)
 2015 4 512 (4 363–4 661) 4 530 (4 377–4 676)
 2016 4 456 (4 304–4 610) 4 476 (4 310–4 623)
 2017 4 401 (4 242–4 561) 4 420 (4 251–4 577)
 2018 4 346 (4 181–4 517) 4 365 (4 191–4 535)
 2019 4 293 (4 120–4 473) 4 314 (4 129–4 494)

 3.4 Population projections

Female population projections were undertaken for the scenarios described in Section 2.5, and applying
future squid fishery-related death scenarios shown in Table 6.

Table 6: Future constant annual fishery deaths at ages 0 (pups) and 3+ used for model projections.

 Median historical Upper 95% CI
 deaths historical deaths

 Scenario Pups Age 3+ Pups Age 3+
 Zero 0 0 0 0
 Average 1.04 2.77 2.02 5.39
 Equal to PST (ϕ = 0.05) 5 13 5 13
 Equal to PST (ϕ = 0.10) 10 26 10 26
 Equal to PST (ϕ = 0.20) 20 52 20 52

As expected, increasing future fishery-related deaths resulted in progressively lower future population
size (from left to right in Figure 3), relative to what was estimated in the absence of future squid fishery-
related mortality (comparing black and grey lines in Figure 3). The population effects of alternative

12 • Population simulation Auckland Islands NZ sea lions Fisheries New Zealand
future squid fishery mortality levels were larger in the declining future population growth scenario (top
row compared with middle and lower rows of Figure 3).

The effect of alternative future squid fishery deaths scenarios on the annual population growth rate of
mature females in 2030 (λ2030) was estimated (Table A5-1). Assuming stable future population growth,
median historical fishery squid fishery deaths and future squid fishery deaths equal to the base case PST
(ϕ = 0.10), the estimated value of λ2030 was 0.978 (0.973–0.983), compared with 0.989 (0.985–0.993)
in the absence of future squid fishery deaths. The scenario using the upper 95% CI of historical deaths,
estimated very similar values of λ2030 (comparing the top and bottom half of Table A5-1).

Yearblock15 model estimates of λ2030 were virtually the same as those of the Yearblock8 model for the
declining and stable population growth scenarios (comparing Table A5-1 and Table A5-2). The
Yearblock15 model estimated a lower growth rate for the increasing period, relative to the Yearblock8
model, although the population effects of alternative future deaths were comparable across the two
models.

Plots of projected mature female population status given alternative future fishery death scenarios
(relative to that estimated in the absence of future fishery deaths) are shown in Figure 4. Table A5-3
summarises the mature female population status in 2025 for all projection scenarios. For the model run
assuming median historical fishery squid fishery deaths, stable future population growth, and future
squid fishery deaths equal to the base case PST (ϕ = 0.10), the estimated mature female population size
in 2025 was 95.4% (95% CI = 95.1%–95.6%) of that estimated in the absence of future fishery deaths.
Comparable estimates were obtained when assuming population decrease or increase in the future
(median population status ranged from 95.0% to 96.1% of unimpacted levels). A sensitivity run with
future deaths equal to the PST with ϕ = 0.05 resulted in a mature female population size in 2025 of
97.7% of the unimpacted level (95% CI = 97.6%–97.8%), i.e., halving future mortalities produced a
proportional improvement in future population status.

When future squid fishery deaths were equal to the average across the most recent estimated period, the
mature female population status in 2025 was 99.5% of that estimated in the absence of future squid
fishery mortality (95% CI = 99.5%–99.5%). This status was relatively insensitive to the future
population growth scenario (Table A5-3).

Fisheries New Zealand Population simulation Auckland Islands NZ sea lions • 13
Figure 3: Female New Zealand sea lions population projections with alternative scenarios of: population
growth (i.e., decreasing (top row), stable (middle row) or increasing (bottom row)); and future squid
fishery-related deaths (i.e., zero future deaths (grey, shown in all plots for reference), the average of the last
five years’ estimated deaths, or equal to the population sustainability threshold (PST) assuming alternative
values of ϕ (“phi”) (all black)). Simulations were obtained using the ‘Yearblock8’ population model.

14 • Population simulation Auckland Islands NZ sea lions Fisheries New Zealand
Figure 4: Projected population size of female New Zealand sea lions at the Auckland Islands expressed as
a percentage of projected population size under the zero future squid fishery (SQU 6T) related
deaths scenario (N2025 % no squid fishery deaths), with alternative scenarios of: population growth (i.e.,
decreasing (left), stable (middle) or increasing (right)); historical deaths relating to the (median (top row)
or upper 95% of spatial risk model estimates (bottom row)); and future deaths relating to this fishery (i.e.,
the average of the last five years’ estimated deaths (black), or equal to the population sustainability
threshold (PST) assuming ϕ = 0.05 (blue), ϕ = 0.10 (purple), or ϕ = 0.20 (red). Simulations were obtained
using the ‘Yearblock8’ population model.

4. DISCUSSION

 4.1 Limitations of data and modelling approach

The assessment models were fitted to demographic data collected at the Auckland Islands since 1990,
including annual pup production estimates (all Auckland Islands rookeries), age composition of
reproductive females and mark-resighting observations (both Sandy Bay only). Apart from annual pup
production, all demographic information came from the Sandy Bay population. However, this rookery
only supports 19% of the total Auckland Islands pup production, with the much larger Dundas Island
population contributing 77% of the total (based on 2019 estimates) (DOC 2019). A large number of
female pups have now been tagged at Dundas Island since the early 1980s, although resighting effort is
typically deemed too low to obtain robust estimates of key demographic rates. A single year of
concerted resighting effort at Dundas Island would provide key information about relative cohort
strength, which could be used to assess the representativeness of Sandy Bay demographics. Note that
an initial exploration by Roberts et al. (2014) indicated some similarities in first year survival comparing
the Sandy Bay and Dundas Island rookeries. Multiple years of resighting effort at Dundas would provide
the data requirements for including Dundas Island mark resighting observations in future population
assessments.

Fisheries New Zealand Population simulation Auckland Islands NZ sea lions • 15
All population models were developed using NIWA’s SeaBird demographic modelling program (e.g.
Francis & Sagar 2012). This program offers considerable flexibility with respect to specifying
alternative parameterisations and the specification of different life history processes, although it cannot
currently be configured to represent density dependent changes in demographic rates. SeaBird can,
however, simulate the population effects of assuming alternative future catch scenarios (point values of
number of deaths by year), which will be complementary to other assessments including density
dependence. Note that the method used here to estimate the PST assumes density dependent population
growth rate, which changes with population status relative to carrying capacity (K) (Sharp 2018).

The large number of demographic states required to represent tag loss, maturation (and senescence for
the Yearblock15 model) (Figure 2) meant that model transition matrices were large. This meant that
MCMC chains were slow to run. In addition, SeaBird uses the Metropolis–Hastings MCMC algorithm,
which can result in poor mixing when there are correlated parameters (as there often are in demographic
assessment models). A workaround was found to deal with this issue (iterative recalculation of the
covariance matrix from initial MCMC samples), although future assessments should potentially
consider alternative MCMC algorithms that improve MCMC mixing (e.g., Hamiltonian Monte Carlo).

The Yearblock8 model used half as many states as the Yearblock15 model (Figure 2) but produced very
similar estimates of population status (comparing Table A5-3 and Table A5-4), and MCMC mixing was
much improved (see Appendix 3). Future assessment models may not need to use the Yearblock15
model structure.

 4.2 Population Sustainability Threshold

Fisheries New Zealand specified a revised criterion for estimating the PST for New Zealand sea lions
at the Auckland Islands. Previously this was based on the mortality level which would not reduce the
mature female population status by more than 5% over 5 years. A PST of 23 females (46 combined sex)
was estimated using this criterion (Roberts 2017). The updated PST criterion used the SEFRA approach
with a base case ϕ of 0.10, which would result in recovery to 95% of population size at equilibrium (if
future deaths were equal to the PST). The female PST value using this method was 26 females (52
combined sex, assuming equal sex ratio)—close to the previous estimate.

A point estimate of the PST was required for estimating future catch limits, rather than a distribution,
as is typically used for estimating risk using the SEFRA method (e.g. Abraham et al. 2017; Roberts et
al. 2019). In addition to ϕ, the PST calculation required input values of max and total female population
size (N). The value of N used to derive the PST was the median total female population size estimate in
2019 (4293 individuals). The credible interval around this estimate was narrow (4129–4494 individuals)
such that using the lower 95% CI value would have resulted in a PST of 24 females, close to the base
case PST value of 26. The high precision of this estimate will mainly be driven by mark resighting
observations confirming individual pupping status. Mark resighting observations inform the estimation
of annual pupping rate, for obtaining the breeding population size, given annual pup production. This
highlights the need for consistent mark resighting field methods through time with good numbers of
breeding status confirmations each year.

In lieu of any robust estimates of max for New Zealand sea lions, this assessment used the default value
of 0.12 used for pinnipeds in U.S. stock assessments (Wade 1998). Rapid population growth has been
observed in New Zealand sea lion populations at Campbell Island, the NZ mainland and potentially also
Stewart Island, which could be used to estimate minimum values of max . However, life history
invariant approaches (e.g., Dillingham et al. 2016) may be preferable for estimating max given the rich
demographic information available for adopting this approach, including from both growing and
declining populations (e.g., Roberts & Doonan 2016).

16 • Population simulation Auckland Islands NZ sea lions Fisheries New Zealand
4.3 Population effects of fisheries deaths

For the period of standardised SLED use (since 2009), annual deaths of female New Zealand sea lions
in the Auckland Islands were estimated by applying a cryptic morality multiplier of 1.5 to the spatial
risk model estimate of annual captures (as directed by Fisheries New Zealand). The cryptic mortality
multiplier of 1.5 was informed by preliminary outputs of Bayesian simulations by separate research
(Meyer 2019). This resulted in an average of 2.77 female deaths annually from 2013 to 2017, or 5.39
females using the upper 95% CI of spatial risk model captures. These estimates are, respectively, around
a tenth and a fifth of the estimated annual PST of 26 females (using the base case ϕ of 0.10). Future
deaths at these levels were, respectively, estimated to result in a mature female population size in 2025
of 99.5% or 99.0% of what was estimated in the absence of future fishing mortality, with narrow
credible intervals (see Table A5-3).

Subsequently to this analysis, a SEFRA model accounting for cryptic mortality relating to SLED-use
estimated 2.33 annual deaths in the squid trawl fishery (upper 95% CI = 5.00) from 2014/15 to 2016/17
(Large et al. 2019). These values are marginally lower than those used in the population models
developed for this assessment and, so, using them instead would have had a very small effect on model
outputs.

This research only assessed the population effects of estimated deaths in the southern arrow squid trawl
fishery, i.e., it did not consider other commercial trawl targets around the Auckland Islands, including:
scampi, hoki, and other targets. Of these, only the Auckland Islands scampi fishery had comparable
estimates of annual New Zealand sea lion deaths to the squid fishery, and is likely to have exceeded
squid fishery captures of females in recent years (Large et al. 2019). The annual PST estimated by this
research (26 females, using the base case ϕ of 0.10) could ultimately be applied to all Auckland Islands
fisheries (and potentially include other anthropogenic causes of death).

The spatial risk assessment by Large et al. (2019) also found evidence for a strong female bias in
captures by the scampi fishery. New Zealand sea lions are polygamous, and population productivity
will be much more responsive to changes in female population size than of males. Accordingly, nearly
all of the foraging information collected from Auckland Islands sea lions to date was from females
(Large et al. 2019), and the most recent demographic models and risk assessments for this population
are female only (Large et al. 2019; Roberts 2017). This supports the current approach of estimating a
female PST in the first instance, and then modifying this estimate to include males as well (e.g.,
doubling the female PST, under the assumption of an equal sex ratio).

 4.4 Demographic drivers of population change

As a by-product, the assessment model estimated the demographic causes of observed changes in pup
production trajectory. With respect to the change from increasing to decreasing trajectory after the late
1990s (see Table A1-1), this assessment re-iterated the findings of Roberts & Doonan (2016), who
identified multiple demographic drivers including large reductions in pup and adult survival as well as
annual pupping rate.

The current assessment was the first to assess the demographic causes of the change from declining to
stable trajectory and found that this was primarily driven by increased survival of both sub-adults (age
2–5) and adults (age 6+). Estimated pup survival (to age 1) was estimated to have remained below 40%
since 2005 (Surv0 = 0.378 (95% CI = 0.337–0.426)), far below the estimate for years 1990–1993 (Surv0
= 0.825 (95% CI = 0.715–0.960)).

Demographic scenarios by Roberts & Doonan (2016) indicate that pup survival rate can be highly
influential for the mature female population trajectory, and this may need to improve in order to achieve
population growth. The demographic scenarios by Roberts & Doonan (2016) also indicated that an
increasing trajectory may also be achieved by improvements to adult female survival. However, the
population assessment reported here strongly suggests that the required increase in adult survival could

Fisheries New Zealand Population simulation Auckland Islands NZ sea lions • 17
not be achieved through the alleviation of squid fishery mortality alone (see the left-hand column of
Figure 3).

5. CONCLUSIONS

The primary conclusions of this research were as follows:

 • A Bayesian demographic population model was developed for female New Zealand sea lions
 at the Auckland Islands, integrating demographic information from estimates of age
 composition, annual pup production, and mark resighting data up to the 2019 field season.
 • Population models incorporated estimates of historical annual deaths of New Zealand sea lions
 in the Auckland Islands squid trawl fishery (SQU 6T), which were derived by applying a cryptic
 mortality rate of 1.5 times annual captures (based on the provisional outputs of separate
 research).
 • The revised population model of female New Zealand sea lions at the Auckland Islands
 estimated a current population size of 4293 females in 2019 (95% CI = 4120–4473).
 • This population estimate was used to derive an annual female PST of 26 females (using the
 base case ϕ of 0.10). Assuming this value of ϕ, future fishery mortality equal to the PST would
 be consistent with population recovery to at least 95% of the unimpacted population state, under
 a default assumption of linear density dependence.
 • Future squid trawl fishery mortalities equal to the base case PST (ϕ of 0.10) were estimated to
 result in a mature female population size in 2025 of between 95.0% (95% CI = 94.7–95.2%)
 and 96.1% (95% CI = 95.8–96.3%) of what would have occurred in the absence of incidental
 mortality from the squid fishery (depending on the future population growth scenario).
 This compares with future squid trawl fishery deaths equal to recent estimated levels which
 were estimated to result in a mature female population size in 2025 of 99.5% of that estimated
 in the absence of future squid fishery mortality (95% CI = 99.5%–99.5%). Specifying future
 deaths at the upper 95% of recent estimate squid fishery deaths resulted in a slightly less
 optimistic status in 2025 of 99.0% of unimpacted levels (95% CI = 99.0%–99.1%).
 • In lieu of a male, or combined sex population model, female PSTs may be doubled to estimate
 a combined sex annual PST of 52 individuals.
 • The primary demographic driver of the recent change in pup production trajectory after 2009,
 from decreasing to stable, appears to be increased survival at ages 2 and older, but the pupping
 rate may have increased slightly also. Estimates of pup survival (up to age 1) were very similar
 across these two periods.

6. ACKNOWLEDGMENTS

I thank the Department of Conservation and Auckland Island sea lion field teams for collecting and
providing the data used by this assessment; Simon Childerhouse for providing age composition
estimates; Fisheries New Zealand working groups and SQOPTAG for their detailed review and advice
on earlier stages of this assessment modelling; Samik Datta and Ian Tuck (both NIWA) for reviewing
earlier drafts of this report. This study was funded by Fisheries New Zealand funding under project
PMM2018-11.

18 • Population simulation Auckland Islands NZ sea lions Fisheries New Zealand
You can also read