MASSACHUSETTS DEPARTMENT OF CORRECTION - PRISON POPULATION TRENDS 2013 478 - May 2014 - CORE
←
→
Page content transcription
If your browser does not render page correctly, please read the page content below

478

 MASSACHUSETTS
 DEPARTMENT OF
  CORRECTION

PRISON POPULATION
    TRENDS 2013

             May 2014
Commonwealth of Massachusetts

                                               Deval L. Patrick, Governor

                      Executive Office of Public Safety and Security
                                               Andrea J. Cabral, Secretary

                             Sandra M. McCroom, Undersecretary of Criminal Justice

                          Massachusetts Department of Correction
                                            Luis S. Spencer, Commissioner

                    Rhiana Kohl, Ph.D., Executive Director of Strategic Planning & Research

                          Author: Research and Planning Division

         Nicholas Cannata                         Amanda Longton                           Gina Papagiorgakis
         Daniel Feagans                           Hollie Matthews                          Eva Yutkins-Kennedy
         Eric Lockmer                             Susan McDonald                           Amanda Zaniewski

                                            Acknowledgements
The publication of this report would not be possible without the assistance of the following Divisions within the
                                   Massachusetts Department of Correction:

                                          Institutional and Central Records
                                   Office of Technology and Information Services
                                           Performance Measures Division

Special recognition is given to Nicholas Cannata for his role as editor along with Gina Papagiorgakis as co-editor,
        and special assistance from Linda Griffin, Diane Silva, Susan McDonald, and Amanda Zaniewski.

             For questions regarding this report, please contact the Research and Planning Division:

                                             Research & Planning Division
                                             MCI-Concord/SFU Building
                                                     PO BOX 9125
                                                 Concord, MA 01742
                                                    (978) 405-6677
                                              Research@doc.state.ma.us

This and other Massachusetts Department of Correction publications can be accessed on
                 the internet under the Research & Statistics tab at:
                                               http://www.mass.gov/doc
                              Publication No. 14-132-DOC-01 71 pgs. 150 cps.         May 9, 2014
                            Authorized by Gary Lambert, Assistant Secretary for Operational Services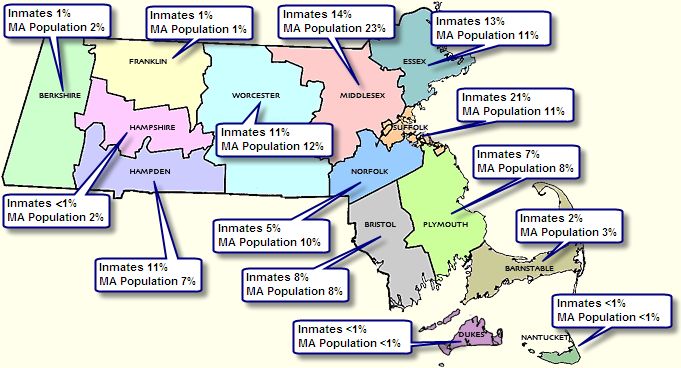
Massachusetts Department of Correction Population Trends 2013
Executive Summary
Population statistics for the Massachusetts
Department of Correction (MA DOC) in 2013 were
impacted by the Crime Bill that was enacted in
August 2012 and the aftermath of the irregularities stemming from the Hinton Drug Lab. After
three years of growth, the average daily population (ADP) for 2013 for both custody (n=10,877)
and jurisdiction (n=11,233) was less than in the prior three years. MA DOC inmate statistics are
driven primarily by the criminally sentenced male population, comprising 84% of the total
population. Thus, a rise and fall in the total is likely attributed to criminally sentenced male
admissions and longer sentence lengths. However, due to the nature of other populations, often
with shorter lengths of stays and turnover in admissions, a significantly larger number of intakes
are conducted among sub-populations such as those for females of all commitment types, pre-
trial detainees, county sentenced and civil commitments (for mental illness, alcohol and
substance abuse or sexually dangerous). Many of these special populations have experienced
changes in their incarceration rates and counts.
Over the last decade (2005-2014), the total prison population (MA Jurisdiction) increased by
nine percent (9%), based on a snapshot of the first of January of each year. During this time
frame, snapshots of the MA DOC custody population slowly grew from 9,824 on January 1,
2005 to 11,173 on January 1, 2009, leveled off through 2011, and peaked in 2012 (n=11,467). A
steady decline from January 2012 to January 2014 reflects a seven percent decrease in the
custody population. The female inmate population did not follow this same trajectory. The
number of female inmates in January 2014 (n=792) was second to the highest first of the year
count in 2007 (n=843). Beginning in 2012, county sentenced female offenders from Worcester
County and west have been housed at a regional correction center in Hampden County. Had
these offenders been housed at the MA DOC as they had prior to 2012, the female custody
counts would be even higher.
From 2005 to 2014, pre-trial inmates in MA DOC custody increased 23%. While the
criminally sentenced population saw a decline from 2012 to 2014, the area of greatest growth
was among pre-trial detainees. January 1st counts in each of these 3 years exceeded 600,
representing over 6% of MA DOC’s custody population, whereas previous years the percent was
in the 4-5% range. Pre-trial females have been significantly increasing, from 144 in 2010 with a
steady annual increase up to 278 on January 1, 2014. Comparisons of commitment types reflect
interesting trends among the female Jurisdiction population in the MA DOC on January 1st of the
last four years:
The proportion of state criminally sentenced females remained at 41% for 2011 to 2012,
then decreased to 38% (2013) to 35% (2014).
Pre-trial females increased from 21% (2011) to 26% (2012) to 33% (2013) to 34%
(2014).
The percent of county criminally sentenced females in MA DOC was 35% in 2011,
decreasing to 28% in 2012 & 2014, dropping to 24% in between (2013). The decrease in
proportion would be expected considering county sentenced females from Worcester
County and west have been housed elsewhere since 2012.
In terms of demographics and other characteristics, the average age of males was 40 years
old, 36 years for females. White was the largest racial/ethnic group among all commitment
types, particularly civil commitments (64%). The second largest racial/ethnic group in every
iiMassachusetts Department of Correction Population Trends 2013
commitment category was Blacks (highest among pre-trial at 33%), consistently
disproportionately higher than the general population. While 68% of male criminally sentenced
inmates were committed on a violent governing offense, 47% of females were for violent crimes.
Within the custody population as of January 1, 2014, 25% of males and 63% of females were
open mental health cases with 19% of males and 55% of females on psychotropic medications.
The pattern of releases by type of criminal justice supervision shifted from 2012 to 2013.
Whereas releases among parolees had declined significantly in 2011-2012, there was an increase
in 2013. This combined with an increase among inmates with probation terms to serve brought
the overall total proportion of individuals released with supervision back over 60% in 2013
where it had been in 2010 and many years prior. During 2013, male offenders were more likely
than female offenders to be released to the street under probation supervision only, 36% of males
compared to 27% of females. Conversely, female offenders were more likely to be released with
no supervision, 45% of females compared to 37% of males. Male and female offenders
supervised in the community by means of parole had more similar percentages at 27% and 28%
respectively.
While a more detailed report on MA DOC recidivism among 2009 releases will be issued
separately, the three year post-release recidivism rate of 41% reflected an increase from the 39%
rate among 2008 releases. Much of this increase can be associated with 2009 having the highest
parole release cohort (39% of releases to the street) since the mid 1990’s. One year recidivism
rates among females decreased from 22% among 2008 releases to 21% for the 2009 female
release cohort. Conversely, the one year rate among males increased from 22% for 2008 releases
to 24% for the 2009 cohort, with the first year post-release being the time when those on parole
are most likely to be violated on parole conditions.
The goal of this report is to present overarching trends among Massachusetts Department of
Correction inmates. Compared to most states, it is unusual for there to be as many (any) pre-
trial, county sentenced and civilly committed in the custody of a state DOC. While these
populations are represented herein, we continuously expand our specialized Research reports to
include a more detailed analysis of sub-populations, such as females, the mentally ill, drug
offenders and pre-trial detainees, as well as other important topics at hand. We strive to inform
our research colleagues, policy makers and the general public to better understand the multitude
of challenges and issues faced in our prisons and criminal justice system. In this manner we
hope to provide factually based information for data driven decision-making and always
welcome input in that endeavor. Our reports are available on the DOC website at
www.mass.gov/doc.
Sincerely,
Rhiana Kohl, Ph.D.,
Executive Director of Strategic Planning & Research
Massachusetts Department of Correction
iiiMassachusetts Department of Correction Population Trends 2013
Report Populations
This report, Massachusetts Department of Correction Population Trends 2013, covers many
different aspects of the Massachusetts Department of Correction (DOC) prison population.
For the purposes of this report, populations include:
Jurisdiction Population
An individual is considered to be under Massachusetts DOC jurisdiction when the
Commonwealth has legal authority over the individual regardless of where the inmate is being
held including those incarcerated in Massachusetts DOC facilities as well as those housed in
correctional facilities outside of the Massachusetts DOC (Massachusetts Houses of Correction,
other state’s correctional facilities, and the Federal Bureau of Prisons).
Custody Population
An individual is considered to be in Massachusetts DOC custody when they are being held in a
Massachusetts DOC facility.
Commitment type includes:
Criminally Sentenced or “Sentenced”:
An individual who has been found guilty of a criminal offense through legal means and is
required to be incarcerated.
Civil Commitment or “Civil”:
The involuntary commitment of an individual via legal means to incarcerate an individual
against their will.
Pre-Trial or “Detainee”:
An individual who is detained prior to trial, but not yet convicted of a crime to include male and
female county detainees, male county detainees transferred to state facilities under Massachusetts
General Law Chapter 276, section 52A, and federal detainees (both male and female).
A complete list of report definitions is located in the ‘Caveats and Definitions’ section at the end
of this report.
ivMassachusetts Department of Correction Population Trends 2013
Table of Contents
Acknowledgements ........................................................................................................................ i
Executive Summary...................................................................................................................... ii
Report Populations ...................................................................................................................... iv
Institution Overview ..................................................................................................................... 1
Institution Capacity ...................................................................................................................... 8
Population Trends......................................................................................................................... 9
Inmate Characteristics ............................................................................................................... 16
Gender ....................................................................................................................................................................17
Race/Ethnicity and Gender....................................................................................................................................18
Age and Age at Time of Incarceration ..................................................................................................................19
Age, Age at Time of Incarceration, and Release ..................................................................................................20
Offense Types.........................................................................................................................................................21
Sentence Lengths ...................................................................................................................................................22
Admissions and Releases ............................................................................................................ 24
Releases by Release Type.......................................................................................................................................30
Criminal, Civil, and Pre-Trial Admissions and Releases .....................................................................................31
Admissions by New Court Commitments................................................................................. 32
Releases to the Street .................................................................................................................. 36
Supervision Type....................................................................................................................................................37
Security Level.........................................................................................................................................................39
Release Address by County ....................................................................................................................................41
Release Address by Top Ten Cities........................................................................................................................42
Average Institutional Length of Stay ........................................................................................ 43
Recidivism Trends ...................................................................................................................... 45
Population Projections ............................................................................................................... 52
Caveats and Definitions.............................................................................................................. 57
vMassachusetts Department of Correction Population Trends 2013
Massachusetts DOC 2013
Institution Overview
1Massachusetts Department of Correction Population Trends 2013
Institution Overview
Bay State Correctional Center (BSCC) Norfolk, MA
Security Level: Medium Average Daily Population (ADP): 308
Initial ACA Accreditation: 1993 Design Capacity: 266
Opened: 1977 - Renovated: 1987 (New ADP % Design Occupancy: 116%
Building) - Expanded: 1990, 1995 & 2006 Operational Capacity: 332
Annual Cost per Offender (FY 2013): $45,053
January 1, 2014 Facility Population: 271
BSCC is a facility housing criminally sentenced males. A mission change
in 1991 converted the facility from a minimum security to a medium
security institution. BSCC is the smallest medium security institution and
is wheelchair accessible.
Boston Pre-Release Center (BPRC) Roslindale, MA
Security Level: Minimum & Pre-Release Average Daily Population (ADP): 173
Initial ACA Accreditation: 2000 Design Capacity: 150
Opened: 1972 - Renovated: 2003 ADP % Design Occupancy: 115%
(New Building) Operational Capacity: 200
Annual Cost per Offender (FY 2013): $41,394 Minimum: 45 & Pre-release: 155
January 1, 2014 Facility Population: 162
BPRC is a facility housing criminally sentenced males. It was the first pre-
release institution in Massachusetts and is now a structured program focused on
reintegration. Close public transportation increases opportunities for
employment, access to community support agencies and other approved
programming. On January 1, 2014, the majority of inmates were pre-release
(125) with 37 minimum security inmates.
Bridgewater State Hospital (BSH) Bridgewater, MA
Security Level: Medium Average Daily Population (ADP): 346
Initial ACA Accreditation: 1998 Design Capacity: 227
Opened: 1974 ADP % Design Occupancy: 152%
Annual Cost per Offender (FY 2013): $114,110 Operational Capacity: 392
January 1, 2014 Facility Population: 336 Civil Commitments: 339
Work Unit (Cadre Inmates): 53
BSH is a facility housing male offenders in several categories: civil
commitments without criminal sentences, civil commitments with criminal
sentences, criminally sentenced inmate workers, and, on occasion, pre-trial
detainees. Each individual civilly admitted to this facility is subject to a
court-ordered evaluation under an applicable section of Massachusetts
General Law (M.G.L.) Chapter 123. Patients may be committed to this facility following the
observation period in increments of six months to a year as ordered by the court if they are found
to be in need of additional treatment and evaluation.
2Massachusetts Department of Correction Population Trends 2013
Institution Overview
Lemuel Shattuck Hospital Correctional Unit (LSH) Jamaica Plain, MA
Security Level: Medium Average Daily Population (ADP): 23
Opened: 1974 - Expanded: 1982, 1987 Design Capacity: 24
Annual Cost per Offender (FY 2013): $259,855 ADP % Design Occupancy: 96%
January 1, 2014 Facility Population: 19 Operational Capacity: 29
The Massachusetts DOC, in partnership with the Department of Public
Health, operates a correctional unit within the Lemuel Shattuck Hospital
providing secure inpatient and outpatient medical care to male and female
inmates from both the state and county. It is a transient facility with few
long term patients. On January 1, 2014, the population consisted of 13
criminally sentenced state inmates, 5 pre-trial detainees and 1 temporary civil commitment. The
average age of inmates housed on this date was 51 years old.
Massachusetts Alcohol and Substance Abuse Center (MASAC) Bridgewater, MA
Security Level: Minimum Average Daily Population (ADP): 153
Initial ACA Accreditation: 1993 Design Capacity: 236
Opened: 1992 - Mission Change: 2002 ADP % Design Occupancy: 65%
Annual Cost per Offender (FY 2013):$64,055 Operational Capacity: 170
January 1, 2014 Facility Population: 106 Sentenced: 70 & Civil Commitments: 100
MASAC is a facility separately housing both criminally sentenced male
inmates, as an overcrowding relief measure, while the institutional focus is to
provide services to males civilly committed under MGL 123, Section 35
participating in a detoxification program for up to 30 days (as of July 2012 it
is 90 days). On January 1, 2014, the two populations were about equal with
56 criminally sentenced inmates and 50 civil commitments. The facility underwent a mission change
in 2002 after the closing of Southeastern Correctional Center (SECC) when all detoxification
services and programs for civilly committed males formerly housed at SECC were moved to this
facility and it was renamed the Massachusetts Alcohol and Substance Abuse Center.
Massachusetts Treatment Center (MTC) Bridgewater, MA
Security Level: Medium Average Daily Population (ADP): 580
Initial ACA Accreditation: 1997 Design Capacity: 561
Opened: 1986 - Expanded: 1997 ADP % Design Occupancy: 103%
Annual Cost per Offender (FY 2013): $50,769 Operational Capacity: 673
January 1, 2014 Facility Population: 565 Sentenced: 312 & Civil Commitments: 361
The MTC is a medium security facility separately housing criminally
sentenced male inmates identified as sex offenders and those who have
been civilly committed as sexually dangerous persons (SDPs) as defined
by M.G.L. Chapter 123A resulting in a day to life commitment. In July
2013, the operational capacity decreased by 2 beds for civil
commitments. The facility offers a comprehensive sexual offender treatment program intended to
reduce the risks associated with reoffending. On January 1, 2014, there were 300 criminally
sentenced inmates, 225 SDPs, and 40 temporary civil commitments.
3Massachusetts Department of Correction Population Trends 2013
Institution Overview
MCI-Cedar Junction (MCI-CJ) South Walpole, MA
Security Level: Maximum Reception & Average Daily Population (ADP): 779
Diagnostic Center w/ Medium Component Maximum: 706 & Medium: 73
Initial ACA Accreditation: 2002 Design Capacity: Maximum: 555 & Medium: 78
Opened: 1956 - Expanded: 1991 ADP % Design Occupancy: 123%
Modular Unit, DDU Maximum: 127% & Medium: 94%
Annual Cost per Offender (FY 2013): $60,207 Operational Capacity: 646
January 1, 2014 Facility Population: 750 Maximum: 568 & Medium: 78
In 2009, the mission of MCI-CJ shifted from a maximum security institution
to the Department’s Reception and Diagnostic Center for male offenders
with a focus on the completion of assessments to determine an inmate’s
initial classification designation and the development of individualized
program plans. The Department Disciplinary Unit (DDU) for the
Department’s most serious discipline issues is also located here. On January 1, 2014, MCI-CJ
housed 713 criminally sentenced inmates and 37 federal or out of state pre-trial detainees. There
were 688 offenders housed in maximum security (124 of those in DDU) and 62 in medium security.
MCI-Concord (MCI-C) Concord, MA
Security Level: Medium Average Daily Population (ADP): 1,253
Initial ACA Accreditation: 2001 Design Capacity: 614
Opened: 1878 - Renovations: 1999, ADP % Design Occupancy: 204%
2005 Special Management Unit Operational Capacity: 1,384
Annual Cost per Offender (FY 2013): $41,703 January 1, 2014 Facility Population: 1,205
MCI-C, the former Reception and Diagnostic Center for the Department,
shifted to a medium security facility for male offenders when MCI-CJ took
over the reception role in 2009. MCI-C admits most court ordered pre-trial
detainees pursuant to MGL Ch 276 sec 52A. On January 1, 2014, MCI-C
housed 993 criminally sentenced inmates and 212 pre-trial detainees.
MCI-Framingham (MCI-F) & Awaiting Trial Unit (ATU) Framingham, MA
Security Level: Medium Average Daily Population (ADP): 649
Initial ACA Accreditation: 1995 Medium: 368 & ATU: 281
Opened: 1877 - Expanded: 1965 4 Cottages & Design Capacity: Medium: 388 & ATU: 64
Health Services Unit Bldg., 1983 Modular Unit, ADP % Design Occupancy: 144%
1989 Modular Unit, 1991 Betty Cole Smith Bldg. Medium: 95% & ATU: 439%
Annual Cost per Offender (FY 2013): $57,526 Operational Capacity: 588
January 1, 2014 Facility Population: 672
MCI-F is the Department’s Reception and Diagnostic Center for female
offenders providing a comprehensive network of gender responsive, trauma
informed programming for women who are civilly committed, pre-trial
detainees or serving county and state criminal sentences. It is the oldest
operating female prison in the country. In July 2013 the operational capacity
decreased by 40 in the modular unit. On January 1, 2014, this medium security facility housed 390
criminally sentenced inmates, 277 pre-trial detainees, and 5 civil commitments.
4Massachusetts Department of Correction Population Trends 2013
Institution Overview
MCI-Norfolk (MCI-N) Norfolk, MA
Security Level: Medium Average Daily Population (ADP): 1,442
Initial ACA Accreditation: 2003 Design Capacity: 1,084
Opened: 1931 ADP % Design Occupancy: 133%
Annual Cost per Offender (FY 2013): $36,534 Operational Capacity: 1,478
January 1, 2014 Facility Population: 1,449
MCI-N is a facility housing male inmates with the distinction of being the
largest medium security institution in the Massachusetts DOC. It was the
first community based prison in the United States, created to be more
spacious with a campus-like atmosphere and architecture. Inmate housing
consists of eighteen dormitory-style living units and two modular units
divided by a large central grass quadrangle.
MCI-Plymouth (MCI-P) Plymouth, MA
Security Level: Minimum & Pre-Release Average Daily Population (ADP): 163
Initial ACA Accreditation: 1994 Design Capacity: 151
Opened: 1952 ADP % Design Occupancy: 108%
Annual Cost per Offender (FY 2013): $42,619 Operational Capacity: 227
January 1, 2014 Facility Population: 176 Minimum: 212 & Pre-Release: 15
MCI-P originated as a Prison Camp in the 1950s on the grounds of the
Myles Standish State Forest. The facility houses criminally sentenced
males, partnering with and providing inmate community work crews and
services to neighboring towns enhancing inmate re-entry and reparation.
In 2012, MCI-P opened a pre-release component in response to one of the
many re-entry initiatives outlined in the Massachusetts Corrections Master Plan. On October
2013, MCI-P increased its pre-release capacity to 15 beds and decreased minimum to 212 beds.
On January 1, 2014 there were 164 minimum and 12 pre-release security inmates.
MCI-Shirley (MCI-S) Shirley, MA
Security Level: Medium & Minimum Average Daily Population (ADP): 1,388
Initial ACA Accreditation: 1995 Medium: 1,150 & Minimum: 238
Opened: Minimum in 1972, Medium in 1991 Design Capacity: Medium: 720 & Minimum: 299
Annual Cost per Offender (FY 2013): $36,997 ADP % Design Occupancy: 136%
January 1, 2014 Facility Population: 1,341 Medium: 160% & Minimum: 80%
Operational Capacity: 1,458
Medium: 1,130 & Minimum: 328
MCI-S encompasses two facilities housing both medium and minimum
custody level inmates. The majority of inmates on January 1, 2014 were in
medium security housing units (1,139) with 202 housed in minimum security.
The two security levels were considered separate institutions
until July 2002, when they were combined as one, operating under one administration. Along with an
Infirmary, MCI-S operates an Assisted Daily Living Unit for medium inmates. The Shirley complex
is also the site of the Department’s Regional Training Center.
5Massachusetts Department of Correction Population Trends 2013
Institution Overview
North Central Correctional Institution (NCCI) Gardner, MA
Security Level: Medium & Minimum Average Daily Population (ADP): 969
Initial ACA Accreditation: 1989 Medium: 945 & Minimum: 24
Opened: 1981 - Renovations: 1982, 1993 Design Capacity: Medium: 568 & Minimum: 30
Annual Cost per Offender (FY 2013): $42,868 ADP % Design Occupancy: 162%
January 1, 2014 Facility Population: 934 Medium: 166% & Minimum: 80%
Operational Capacity: 1,022
Medium: 992 & Minimum: 30
NCCI is a facility housing criminally sentenced males. The majority of
inmates on January 1, 2014 were in medium security housing units (908)
with 26 housed in minimum security. The institution is located on the
land formerly occupied by the Gardner State Hospital which was open
from 1902 until its doors were closed in 1976.
Northeastern Correctional Center (NECC) Concord, MA
Security Level: Minimum & Pre-Release Average Daily Population (ADP): 245
Initial ACA Accreditation:1982 Design Capacity: 150
Opened: 1932 ADP % Design Occupancy: 163%
Annual Cost per Offender (FY 2013): $39,267 Operational Capacity: 274
January 1, 2014 Facility Population: 250 Minimum: 210 & Pre-Release: 64
NECC is a facility, operating under the administration of MCI-Concord,
housing criminally sentenced males. The majority of inmates on January
1, 2014 were in minimum security housing units (193) with 57 housed in
pre-release. The facility was originally the supporting farm for MCI-
Concord. Currently, the programming is designed to enable a smooth
transition from confinement to the community. Community work crews provide cost effective
labor to surrounding communities.
Old Colony Correctional Center (OCCC) Bridgewater, MA
Security Level: Medium & Minimum Average Daily Population (ADP): 901
Initial ACA Accreditation: 1989 Medium: 783 & Minimum: 119
Opened: 1987 - Expanded: 1990 Modular Unit Design Capacity: Medium: 480 & Minimum: 100
Annual Cost per Offender (FY 2013): $45,112 ADP % Design Occupancy: 155%
January 1, 2014 Facility Population: 882 Medium: 163% & Minimum: 119%
Operational Capacity: 908
Medium: 748 & Minimum: 160
A mission change was facilitated in 2010 at OCCC shifting their medium
security operation to a mental health focused facility with the objective of
providing needed mental health services more efficiently while at the
same time promoting rehabilitation and re-entry. The majority of inmates
on January 1, 2014 were housed in a medium security unit (773) with
109 housed in minimum security.
6Massachusetts Department of Correction Population Trends 2013
Institution Overview
Pondville Correctional Center (PCC) Norfolk, MA
Security Level: Minimum & Pre-Release Average Daily Population (ADP):182
Initial ACA Accreditation: 1994 Design Capacity: 100
Opened: 1990 ADP % Design Occupancy: 182%
Annual Cost per Offender (FY 2013): $36,845 Operational Capacity: 200
January 1, 2014 Facility Population: 188 Minimum: 145 & Pre-Release: 55
PCC is a facility for criminally sentenced males housing 136 minimum
and 52 pre-release inmates on January 1, 2014. The original name of the
facility was Norfolk Pre-Release Center (NPRC). The facility was
constructed in 1975. In 1990, following significant renovations, the
facility then became known as Pondville Correctional Center housing
both minimum and pre-release inmates.
South Middlesex Correctional Center (SMCC) Framingham, MA
Security Level: Minimum & Pre-Release Average Daily Population (ADP):121
Initial ACA Accreditation: 1983 Design Capacity: 125
Opened: 1976 ADP % Design Occupancy: 97%
Mission Change: 2002 all Female Operational Capacity: 185
Annual Cost per Offender (FY 2013): $41,724 Minimum: 140 & Pre-Release: 45
January 1, 2014 Facility Population: 117
SMCC is a facility for criminally state and county sentenced females
housing 99 minimum and 18 pre-release inmates on January 1, 2014.
The facility began as a male facility and became a female facility on July
1, 2002 after a mission change. The community based environment
encourages ongoing utilization of skills and resources necessary for
successful re-entry into the community while ensuring public safety.
Souza Baranowski Correctional Center (SBCC) Shirley, MA
Security Level: Maximum Average Daily Population (ADP): 1,189
Initial ACA Accreditation: 2001 Design Capacity: 1,024
Opened: 1998 ADP % Design Occupancy: 116%
Annual Cost per Offender (FY 2013): $50,680 Operational Capacity: 1,410
January 1, 2014 Facility Population: 1,190
SBCC is the one exclusively maximum security male facility in
Massachusetts. SBCC is currently the newest state correctional facility
in Massachusetts, opened on September 30, 1998. At the time, it was
built with the highest degree of technological integration of any prison
in the country, including a keyless security system and one of the
largest camera matrix systems nationwide.
7Massachusetts Department of Correction Population Trends 2013
Institution Capacity
Massachusetts DOC 2013 Average Daily Custody Population vs. Capacities
8,000
7,000
6,000
5,000
4,000
3,000
2,000
1,000
0
Maximum Medium Min/Pre-Release
Design Capacity 1,579 5,074 1,376
Operational Capacity 2013 1,978 7,824 1,774
Avg Daily Population for 2013 1,895 7,550 1,432
Total Massachusetts Department of Correction 2013
Design Capacity = 8,029
Operational Capacity = 11,576
Average Daily Population for 2013 (Custody Population) = 10,877
Average Daily Population for 2013 (Jurisdiction Population) = 11,233
Design Capacity is the number of inmates that planners or architects intended to house in a
facility.
Operational Capacity is the number of beds authorized for safe and efficient operation of
the facility. It does not include beds reserved for discipline, investigations, infirmary or other
temporary holds because these beds are used for temporary or special purposes.
The numbers utilized in this report associated with design and operational capacities are from
January 1, 2014.
All design capacity and average daily population figures include the contract facilities
Brooke House and Spectrum Women and Children’s Program with the exception of
operational capacity.
8Massachusetts Department of Correction Population Trends 2013
Massachusetts DOC 2013
Population Trends
9Massachusetts Department of Correction Population Trends 2013
Population Trends
Massachusetts DOC Jurisdiction Population:
January 1, 2005 to 2014
12,500
12,000 11,723
Number of Offenders
11,438 11,361 11,409 11,403
11,500 11,364
11,034
11,000 11,045
10,138 10,699
10,500
10,000
9,500
9,000
2005 2006 2007 2008 2009 2010 2011 2012 2013 2014
Calendar Year
Massachusetts
The Massachusetts DOC’s total prison population increased by 9% between 2005 and 2014.
The population rose almost 3% between 2011 and 2012 and reached the highest total in a
decade; this was followed by a decrease of 6% between 2012 and 2014.
National
The national imprisonment rate at yearend 20121 was 480 sentenced inmates per 100,000
U.S. residents. “Declining for the third consecutive year, falling to an estimated 1,571,013 at
yearend 2012. This was down 27,770 prisoners (1.7%) from yearend 2011.”2
“In 2012, the overall state prison population decreased 2.1% (down 20,223 inmates), while
the federal prison population grew 0.7% (up 1,453).”3
“The total imprisonment rate for prisoners sentenced to more than 1 year in state or federal
prison decreased 2.4% from 492 per 100,000 U.S. residents in 2011 to 480 in 2012.”4
1
Yearend 2012 statistics were the most recent national statistics available at the time.
2
Bureau of Justice Statistics (July 2013). Prisoners in 2012-Advanced Counts (NCJ 242467). Washington, D.C.:
U.S. Department of Justice.
3
Ibid.
4
Ibid.
10Massachusetts Department of Correction Population Trends 2013
Population Trends
Comparison of Prison Population Growth Trends 1992 - 2012
National vs. Massachusetts DOC Jurisdiction
1,800,000 18,000
National Prison Population
Massachusetts DOC Prison
1,600,000 16,000
1,400,000 14,000
1,200,000 12,000
Population
1,000,000 10,000
800,000 8,000
600,000 6,000
400,000 4,000
200,000 2,000
0 0
1992
1993
1994
1995
1996
1997
1998
1999
2000
2001
2002
2003
2004
2005
2006
2007
2008
2009
2010
2011
2012
Year
United States Massachusetts
Comparison of Prison Population Growth Trends 1992 – 2012:
National vs. Massachusetts DOC Jurisdiction
National Massachusetts
Year
Jurisdiction Population Jurisdiction Population
Population
Percent of
Population
Percent of The Massachusetts jurisdiction prison
Change Change
population increased by 5% from 10,894
1992 882,500 6.9 10,894 10.9
in 1992 to 11,403 in 2012.
1993 970,444 10.0 11,422 4.8
1994 1,054,702 8.7 11,492 0.6
1995 1,125,874 6.7 11,462 -0.3 Between 1998 and 2005, the
1996 1,183,368 5.1 11,242 -1.9 Massachusetts prison population
1997 1,242,153 5.0 11,794 4.9 experienced a 14% decrease followed by
1998 1,302,019 4.8 11,807 0.1 a 13% increase between 2005 and 2012.
1999 1,363,701 4.7 11,792 -0.1
2000 1,394,231 2.2 11,377 -3.5 The national prison population
2001 1,404,032 0.7 10,919 -4.0 experienced annual increases starting in
2002 1,440,144 2.6 10,534 -3.5 1992 before declining in 2010. The
2003 1,468,601 2.0 10,354 -1.7 largest decrease was in 2012, with the
2004 1,497,100 1.9 10,242 -1.1 population declining by 2%.
2005 1,525,910 1.9 10,138 -1.0
2006 1,568,674 2.8 10,699 5.5 The national prison population increased
2007 1,596,835 1.8 11,045 3.2 by 78% from 882,500 in 1992 to
2008 1,608,282 0.7 11,364 2.9 1,571,013 in 2012. (2013 National data
2009 1,615,487 0.4 11,361 0.0 was not available)
2010 1,613,803 -0.1 11,409 0.4
2011 1,598,780 -0.9 11,723 2.8
2012 1,571,013 -1.7 11,403 -2.7
11Massachusetts Department of Correction Population Trends 2013
Population Trends
Massachusetts DOC Custody Population by Gender:
January 1, 2005 to 2014
14,000
11,467
12,000 11,053 11,173 11,156 11,162 11,127
10,389 10,791 10,622
9,824
Number of Inmates
10,000
10,687
10,439
10,423
10,397
10,381
10,266
9,948
9,830
9,604
9,083
8,000
6,000
4,000
2,000
741 785 843 787 750 717 765 780 746 792
0
2005 2006 2007 2008 2009 2010 2011 2012 2013 2014
Calendar Year
Male Female Total
The Massachusetts DOC custody population showed an increase of 8% between January
1, 2005 and January 1, 2014. There was a steady increase of 17% from 2005 to 2012. The
population remained relatively constant between 2008 and 2011 before spiking in 2012 to
11,467 inmates. Following the increase there was then a decrease in population of 7%
from 2012 to 2014.
Male inmates increased 18% between 2005 and 2012 which has driven the increase in
total custody population over the trend period. In the past two years however, the male
custody population dropped from 10,687 in 2012 to 9,830 in 2014 which resulted in an
8% decrease.
The female population experienced more fluctuation than their male counterparts during
this time frame, most notably a 14% increase between 2005 and 2007 and a 15% decline
between 2007 and 2010. Females then experienced a 2% increase between 2011 and 2012
similar to the 3% increase in the male population. However, between 2012 and 2014,
females experienced a 2% increase compared to males who experienced an 8% decrease
in their custody populations.
From November 2011 to February 2012, 51 county sentenced female inmates in DOC
custody were transferred to a regional correctional center in Hampden County.
Beginning in November 2011, county sentenced females including those from Worcester
county and west, will be held in the custody of this regional center and no longer at the
MA DOC.
12Massachusetts Department of Correction Population Trends 2013
Population Trends
Massachusetts DOC Custody Population by Commitment Type:
January 1, 2005 to 2014
12,000
Number of Inmates 10,000
8,000
6,000
4,000
2,000
0
2005 2006 2007 2008 2009 2010 2011 2012 2013 2014
Criminally Sentenced 8,620 9,072 9,524 9,930 10,094 10,056 9,985 10,251 9,877 9,453
Pre-Trial 527 590 533 467 461 477 557 609 690 646
Civil Commitments 677 727 734 656 618 623 620 607 560 523
Total 9,824 10,389 10,791 11,053 11,173 11,156 11,162 11,467 11,127 10,622
Calendar Year
The Massachusetts DOC saw an increase in criminally sentenced and pre-trial commitment
populations between January 1, 2005 and January 1, 2014, with the largest percent increase seen
in the pre-trial population (23%). Between 2013 and 2014, criminally sentenced, pre-trial, and
civil commitments populations all experienced a decrease, 4%, 6%, and 7% respectively.
Massachusetts DOC Custody Population January 1, 2005 to 2014:
Criminally Sentenced Inmates
12,000
9,930 10,094 10,056 9,985 10,251 9,877
9,072 9,524 9,453
10,000 8,620
Number of Inmates
9,691
9,403
9,507
9,489
9,387
9,328
8,000
8,900
8,944
8,482
8,042
6,000
4,000
2,000
578 590 624 602 587 598 560 474 509
567
0
2005 2006 2007 2008 2009 2010 2011 2012 2013 2014
Calendar Year
Male Female Total
Criminally sentenced inmates compose 89% of the Massachusetts DOC custody
population.
From 2005 through 2014, males experienced an 11% increase whereas females decreased
by 12%. The total criminally sentenced population experienced a 10% increase over the
same time period (2005 to 2014) but in the past 2 years saw a decrease of 8% (2012 to
2014).
13Massachusetts Department of Correction Population Trends 2013
Population Trends
Massachusetts DOC Custody Population January 1, 2005 to 2014:
Pre-Trial Detainees
800
690
700 609 646
590 557
Number of Inmates
600 527 533
461 477
500 467
400
433
416
402
397
378
368
300 257 278
333
329
301
204 207
290
200 149 174 177 160 144 160
100
0
2005 2006 2007 2008 2009 2010 2011 2012 2013 2014
Calendar Year
Male Female Total
The pre-trial population had an increase of 23% between 2005 and 2014.
In 2005, males made up 72% of the pre-trial population compared to 57% in 2014. While
the total population increased since 2005, the proportion of males and females made a
noticeable shift during this period.
Massachusetts DOC Custody Population January 1, 2005 to 2014:
Civil Commitments
800
727 734
700 677 623
656 618
719
620 607
706
Number of Inmates
663
648
600 560 523
617
615
613
594
545
500
400 518
300
200
100 14 21 13 15
15 8 3 6 7 5
0
2005 2006 2007 2008 2009 2010 2011 2012 2013 2014
Calendar Year
Male Female Total
The total civilly committed population and male civilly committed population
experienced a decrease, 23% and 22% respectively, from 2005 to 2014.
Averaging 11 inmates a year over the trend period, female civilly committed inmates
represent the smallest population with a low of 3 in 2009 and a high of 21 in 2006.
14Massachusetts Department of Correction Population Trends 2013
Population Trends
Massachusetts DOC Total Jurisdiction Population:
Males by Type of Sentence on January 1, 2014
County State Criminal
Criminal Commitments
Commitments 87%Massachusetts Department of Correction Population Trends 2013
Massachusetts DOC 2013
Inmate Characteristics
16Massachusetts Department of Correction Population Trends 2013
Inmate Characteristics by Gender
Male Jurisdiction Population on Females Jurisdiction Population on
January 1, 2014 January 1, 2014
10,227 total males in the jurisdiction 807 total females in the jurisdiction
population: 9,284 criminally sentenced, population: 524 criminally sentenced,
425 pre-trial detainees, and 518 civil 278 pre-trial detainees, and 5 civil
commitments commitments
Average age was 40 years old Average age was 36 years old
96% were serving a sentence of more 53% were serving a sentence of more
than three years than three years
68% had a violent governing offense 47% had a violent governing offense
1,019 were serving a governing 43 were serving a governing mandatory
mandatory drug sentence drug sentence
45% entered the Massachusetts DOC 37% entered the Massachusetts DOC
with less than a 9th grade reading level with less than a 9th grade reading level
35% entered the Massachusetts DOC 39% entered the Massachusetts DOC with
with less than a 6th grade math level less than a 6th grade math level
The 2009 three year recidivism rate was The 2009 three year recidivism rate was
43% for the total male population 35% for the total female population
25% were open mental health cases with 63% were open mental health cases with
19% on psychotropic medication 55% on psychotropic medication
(Custody Population as of 1/1/2014) (Custody Population as of 1/1/2014)
17Massachusetts Department of Correction Population Trends 2013
Inmate Characteristics by Race/Ethnicity and Gender
Massachusetts DOC Jurisdiction Population:
Race/Ethnicity* by Commitment Type on January 1, 2014
1% 1%Massachusetts Department of Correction Population Trends 2013
Inmate Characteristics by Age and Age at Time of Incarceration
Massachusetts DOC Jurisdiction Population by Age in Years and
Commitment Type on January 1, 2014
Massachusetts DOC Jurisdiction Population by Age and
Commitment Type on January 1, 2014
7% 3% 7%
100% Age Criminally Civil Pre-
17% 13% Total
15% 15% (Years) Sentenced Commitments Trial
80% Over 60 695 91 19 805
24% 26% 30% 50 - 59 1,483 135 92 1,710
24%
60% 40 - 49 2,334 113 211 2,658
22% 30 - 39 2,932 99 200 3,231
30% 28% 29%
40% 20 - 29 2,326 84 171 2,581
0% 19% 1% 0% Under 20
0% 38 1 10 49
20% 24% 24% 23%
16% Total 9,808 523 703 11,034
0%
Criminally Civil Pre-Trial Total
Sentenced
Under 20 20 - 29 30 - 39 40 - 49 50 - 59 Over 60
As of January 1, 2014, the oldest inmates in the jurisdiction population relative to sentence type
were civil commitments with 339 age 40 years or older (65%), differing from civil
commitments’ age at incarceration in which 386 were between ages 20-49 (74%).
Massachusetts DOC Jurisdiction Population by Age at Time of
Incarceration and Commitment Type in on January 1, 2014
2% 6% 3% 2% Massachusetts DOC Jurisdiction Population by Age at Time of
100% 7% 8%
12% Incarceration and Commitment Type on January 1, 2014
18% 18% Age Criminally Civil Pre-
19% Total
80% (Years) Sentenced Commitments Trial
29%
25% Over 60 159 30 18 207
60% 29% 29% 50 - 59 677 96 81 854
29% 40 - 49 1,772 132 205 2,109
40% 27%
30 - 39 2,846 141 202 3,189
40% 38% 20 - 29 3,902 113 184 4,199
20% 22% 26%
Under 20 452 11 13 476
5% 2% 2% 4% Total 9,808 523 703 11,034
0%
Criminally Civil Pre-Trial Total
Sentenced
Under 20 20 - 29 30 - 39 40 - 49 50 - 59 Over 60
At the time of incarceration, 6,748 inmates in the criminally sentenced population were
between ages 20-39 (69%) with 3,902 between ages 20-29 (40%).
Criminally sentenced inmates comprised most of the jurisdiction population with 8,520
between 20-49 years old (87%) at the time of incarceration.
Seven hundred and three inmates in the jurisdiction population on January 1, 2014, were
pre-trial detainees (6%). The age distribution of pre-trial detainees was similar at both
the time of incarceration and on January 1, 2014, suggesting a more transitional
population with shorter institutional stays.
19Massachusetts Department of Correction Population Trends 2013
Inmate Characteristics by Age, Age at Time of Incarceration, and Release
Massachusetts DOC Jurisdiction Population Age
Averages and Ranges by Commitment Type on
January 1, 2014
Civil Pre-
Sentenced Total
Commitments Trial
Male
Mean 40 Years 46 Years 41 Years 40 Years
Median 38 Years 47 Years 42 Years 39 Years
Youngest 17 Years 19 Years 21 Years 17 Years
Oldest 90 Years 82 Years 70 Years 90 Years
Female
Mean 37 Years 31 Years 33 Years 36 Years
Median 35 Years 29 Years 32 Years 34 Years
Youngest 19 Years 20 Years 17 Years 17 Years
Oldest 69 Years 41 Years 69 Years 69 Years
Total
Mean 40 Years 46 Years 38 Years 40 Years
Median 38 Years 47 Years 38 Years 38 Years
Youngest 17 Years 19 Years 17 Years 17 Years
Oldest 90 Years 82 Years 70 Years 90 Years
On January 1, 2014, the oldest inmates in the jurisdiction population were civil commitments
with an average age of 46 years old. This average is largely driven by the male civil
commitment population which significantly outnumbers the female civil commitment
population. Criminally sentenced males and females have the closest average age at 40 for males
and 37 for females.
Massachusetts DOC Jurisdiction Population Age Massachusetts DOC 2013 Jurisdiction Population Age
Averages and Ranges by Commitment Type at Averages and Ranges by Commitment Type at
Time of Incarceration on January 1, 2014 Time of Release
Civil Civil Pre-
Sentenced Pre-Trial Total Sentenced Total
Commitments Commitments Trial
Male Male
Mean 33 Years 40 Years 41 Years 34 Years Mean 38 Years 37 Years 42 Years 38 Years
Median 31 Years 39 Years 40 Years 32 Years Median 36 Years 33 Years 42 Years 37 Years
Youngest 15 Years 17 Years 21 Years 15 Years Youngest 18 Years 17 Years 19 Years 17 Years
Oldest 82 Years 79 Years 69 Years 82 Years Oldest 86 Years 86 Years 81 Years 86 Years
Female Female
Mean 34 Years 31 Years 33 Years 34 Years Mean 36 Years 33 Years 33 Years 34 Years
Median 33 Years 29 Years 31 Years 32 Years Median 33 Years 30 Years 31 Years 31 Years
Youngest 18 Years 20 Years 17 Years 17 Years Youngest 18 Years 18 Years 17 Years 17 Years
Oldest 67 Years 41 Years 68 Years 68 Years Oldest 68 Years 68 Years 73 Years 73 Years
Total Total
Mean 33 Years 40 Years 38 Years 34 Years Mean 37 Years 36 Years 36 Years 36 Years
Median 31 Years 39 Years 37 Years 32 Years Median 35 Years 33 Years 34 Years 34 Years
Youngest 15 Years 17 Years 17 Years 15 Years Youngest 18 Years 17 Years 17 Years 17 Years
Oldest 82 Years 79 Years 69 Years 82 Years Oldest 86 Years 86 Years 81 Years 86 Years
20Massachusetts Department of Correction Population Trends 2013
Inmate Characteristics by Offense Types
Massachusetts DOC Criminally Sentenced Jurisdiction
Population by Governing Offense and Gender on January 1, 2014
Massachusetts DOC Criminally Sentenced
Jurisdiction Population by Governing Offense and
Gender on January 1, 2014
100% 8% 13% 9% Governing
8% 9% Male Female Total
Offense
16% 22% 16%
Offenses
80%
Violent
Person 4,941 233 5,174
14% 2% 14%
60% 19% Sex 1,331 11 1,342
Non-Violent
Drug 1,467 97 1,564
40%
Offenses
53% 53%
44% Property 780 113 893
20%
Other 765 70 835
0%
Male Female Total Total 9,284 524 9,808
Person Sex Drug Property Other
Sixty-eight percent of male offenders in the criminally sentenced population committed a
violent governing offense with person offenses comprising 53%.
Drug offenses represented the second largest category for male offenders and comprised
16% of the male criminally sentenced population.
Similar to males, the most common governing offense for females were person offenses
(44%) followed by property (22%) and drug offenses (19%).
In contrast to male offenders, the majority of female offenders were committed for a non-
violent governing offense (53%).
Massachusetts DOC Criminally Sentenced Jurisdiction Population by
Violent/Non-Violent Offense and Gender on January 1, 2014
100%
47%
80%
68% 66%
60%
40%
53%
32% 34%
20%
0%
Male Female Total
Non-Violent Violent
21Massachusetts Department of Correction Population Trends 2013
Inmate Characteristics by Sentence Lengths
Massachusetts DOC Male Criminally Sentenced 2013 New Court
Commitments vs. January 1, 2014 Snapshot Population: Massachusetts DOC Male Criminally Sentenced
Sentence Length 2013 New Court Commitments vs. January 1,
2014 Snapshot Population:
1% Sentence Length
Percentage of Male Inmates
2%
2% 11% 2013 New 1/1/2014
100% 9% Sentence
Court Snapshot
90% 10% Length
Commitments Population
80% 9%
34% < 1 Year 25 3
70%
21% 1 to < 3 Years 345 352
60%
3 to < 5 Years 663 1,485
50%
33% 30% 5 to < 10 Years 672 2,750
40%Massachusetts Department of Correction Population Trends 2013
Inmate Characteristics by Sentence Lengths
In 2013, 90% of female new court commitments were serving a sentence less than three years,
whereas only 47% of females in the January 1, 2014 snapshot population were serving a sentence
less than three years. Comparatively, 86% of male new court commitments were serving a sentence
not greater than 10 years, while only 49% of the males in the January 1, 2014 snapshot population
were serving a sentence not greater than 10 years. As mentioned previously in this report, the MA
DOC houses females who are pre-trial and those who are criminally sentenced from numerous
counties; thus, many women are serving county sentences with the DOC which are shorter terms
than state sentences.
Between January 1, 2013 and January 1, 2014, the percentage of state criminally sentenced female
inmates in the MA DOC jurisdiction decreased 1%, while the percentage of county criminally
sentenced female inmates increased 23%. Among the criminally sentenced females in MA DOC
jurisdiction on January 1, 2014:
56% (N=294) were state sentenced
43% (N=226) were county sentenced
1% (N=4) were out of state/federally sentenced
Naturally, sentence lengths vary by offense type. The following table reflects maximum sentence
lengths less than 3 years and equal to or greater than 3 years by governing offense type and gender.
The maximum sentence lengths are based on the total maximum number of days an inmate can serve
on their commitment, which is the sum of their consecutive sentences. Sixty-six percent of criminally
sentenced males were serving a maximum sentence length of 3 years or more on a violent governing
offense. In comparison, 35% of criminally sentenced females were serving a maximum sentence
length of 3 years or more on a violent governing offense and 36% of criminally sentenced females
were serving a maximum sentence length less than 3 years on a non-violent governing offense.
Criminally Sentenced Jurisdiction Population on January 1, 2014:
Governing Offense by Sentence Length and Gender
Governing Offense Males Females Total
< 3 Years > 3 Years < 3 Years > 3 Years < 3 Years > 3 Years
Offenses
Non-Violent Violent
PERSON 125 4,816 58 175 183 4,991
SEX 12 1,319 1 10 13 1,329
DRUG 97 1,370 40 57 137 1,427
Offenses
PROPERTY 70 710 90 23 160 733
OTHER 51 714 56 14 107 728
355 8,929 245 279 600 9,208
TOTALS
9,284 524 9,808
Following person offenses, drug offenses represented the second highest governing offense type for
males compared to property offenses for females. A majority of drug offenders were serving
sentences associated with a mandatory minimum term. There were a total of 1,062 inmates sentenced
for a mandatory drug governing offense: 1,019 males and 43 females.
23Massachusetts Department of Correction Population Trends 2013
Massachusetts DOC 2013
Admissions and Releases
24Massachusetts Department of Correction Population Trends 2013
Admissions and Releases
Massachusetts DOC 2013 Criminally Sentenced Jurisdiction Population:
Monthly Admissions and Releases
400 11,000
10,148 10,118 10,087 10,105 10,024 9,971 9,947 9,892 9,822 9,864 9,868 9,818
Criminal Admissions and Releases
350
Criminal Jurisdiction Population
9,000
335
300
314
304
298
296
294
297
290
290
290
286
7,000
287
275
265
250
266
274
263
264
247
240
234
241
232
220
200 5,000
150
3,000
100
-24 -52 -38 -118 -167 1,000
-191 -247 -317 -274 -272 -315 -324
50
0 -1,000
Jan Feb Mar Apr May Jun Jul Aug Sep Oct Nov Dec
Month
Criminal Admissions Criminal Releases Criminal Jurisdiction Population Cumulative Difference
Note: Monthly jurisdiction population is based on the end of the month count of the criminally sentenced
jurisdiction population and will not reflect the cumulative difference in admissions and releases.
Throughout most of 2013 there were more criminal releases than admissions; the
exceptions to this were in March, September, and October.
The number of releases may be partially attributed to changes resulting from to the
2012 Crime Bill and releases due to the crime lab situation6.
The cumulative difference between admissions and releases resulted in a cumulative
decrease of 324 in the criminally sentenced population by year’s end.
The criminally sentenced population at the end of 2013 was 9,818, a 3% decrease
from the population at the end of January, at 10,148. This rate decrease was similar to
the one seen in 2012.
6
See Caveats and Definitions for Crime Bill and Crime Lab Situation
25Massachusetts Department of Correction Population Trends 2013
Admissions and Releases
Massachusetts DOC Criminally Sentenced Jurisdiction Population:
Admissions and Releases 2007- 2013
5,000
Number of Inmates
4,000
3,000
2,000
1,000
0
2007 2008 2009 2010 2011 2012 2013
Admissions 4,085 4,050 3,717 3,863 3,598 3,220 3,139
Releases 3,662 3,808 3,818 3,901 3,315 3,552 3,463
Year
During the past seven years criminal admissions and releases have both exhibited negative
trends, with criminal admissions exhibiting a greater decline than criminal releases. Admissions
saw a lessening over the trend period with an average decrease of 4% each year; 2012 and 2009
had the biggest declines of 11% and 8%, respectively. Releases only saw two years of decrease
from the prior year, in 2011 and 2013; 2011 saw a large enough decrease, 15%, that the average
yearly decline was less than 1%.
Massachusetts DOC Criminally Sentenced Jurisdiction Population:
Snapshot January 1, 2006 to 2014
11,000
10,342 10,491 10,148
10,132 10,259 10,222
9,808
10,000 9,720
9,352
Number of Inmates
9,000
8,000
7,000
6,000
5,000
2006 2007 2008 2009 2010 2011 2012 2013 2014
Year
The criminally sentenced population saw a general increase of 12% from 2006 to 2012; however,
there were declines of less than 1% for both 2010 and 2011. For 2013 and 2014 a decrease of
about 3% was seen for each year resulting in a net difference between 2006 and 2014 of only
5%, despite the growth earlier in the trend period.
26Massachusetts Department of Correction Population Trends 2013
Admissions and Releases
2013 Criminally Sentenced Admissions to the Massachusetts DOC:
Admission Type by Month
Criminally Sentenced Admissions
350
304 290 298
300 286
263 266 265 262
234 241
250 240 232
271 220 258 259
237 242
200 223 213 224 226
207 202
150 194 183
100
50 23 25 30 25 21 25 24 21
18 13 16 16 13
0
Mon.
Jan Feb Mar Apr May Jun Jul Aug Sept Oct Nov Dec
Avg.
New Court Commitment 223 237 271 213 242 194 207 183 258 259 202 224 226
Parole Violation /Detainer 18 13 23 16 25 30 16 25 21 25 13 24 21
Transfer from Other Jurisdiction 14 9 8 2 11 10 11 8 6 2 9 11 8
Probation Violation 3 4 1 1 3 3 2 3 3 4 2 2 3
Re-Admit from Court Release 5 2 1 2 3 3 5 0 2 8 6 4 3
Escapee Returns 0 1 0 0 2 0 0 1 0 0 0 0 0
Total Admissions 263 266 304 234 286 240 241 220 290 298 232 265 262
Total criminal admissions for 2013 were driven by new court commitments to the MA
DOC, as evidenced by the parallel yearly trends.
New court commitments ranged from 183 to 271 with a monthly average of 226, the same
as 2012. Total criminal admissions ranged from 220 to 304 for a monthly average of 262.
2013 Crim inally Sente nce d Juris diction Rele ase s from the Massachusetts DOC:
Rele ase Type by Month
400
Criminally Sentenced Releases
350 335
314
287 294 290 297 290 296 289
300 264 275 274
247
250
200 175 169 164
146 154 159 149 157 150 152
145
150 130 128
100 73 60
58 64 61 62 64 62 62 59
51 45 57
50
31 11
15 13 11 14 9 9 7 7 7 7 6
0
Jan Feb Mar Apr May Jun Jul Aug Sep Oct Nov Dec Avg
Expiration of Sentence to Street 130 146 154 159 175 145 149 157 128 169 164 150 152
Parole to Street/Release f rom Parole 58 64 51 73 61 45 62 64 62 62 59 57 60
Detainer
Parole-Exp of Sentence to Other 37 48 49 52 56 46 55 42 33 40 31 42 44
Non-DOC* Release to Other Jurisd 27 20 18 15 22 17 20 15 14 18 12 17 18
Court/Crime Lab Release 31 15 13 11 14 9 9 7 7 7 7 6 11
Other 4 1 5 4 7 2 2 5 3 0 2 2 3
Total 287 294 290 314 335 264 297 290 247 296 275 274 289
*Non-DOC refers to inmates from county, federal, or another state’s jurisdiction.
Total criminal jurisdiction releases for 2013 ranged between 247 and 335 for a given month and
averaged 289. Releases due to paroles to the street or release from parole detainer remained
relatively steady throughout the year, while the total releases had a negative trend. This resulted
in an average of 21% of the criminal jurisdiction releases in 2013; compared to 16% in 2012.
27You can also read


