GRADE 12 GEOGRAPHY LEARNER NOTES - SENIOR SECONDARY IMPROVEMENT PROGRAMME 2013 - The SSIP is supported by
←
→
Page content transcription
If your browser does not render page correctly, please read the page content below
SENIOR SECONDARY IMPROVEMENT PROGRAMME 2013

                     GRADE 12

                 GEOGRAPHY

             LEARNER NOTES

                           The SSIP is supported by
                                                         1
             (c) Gauteng Department of Education, 2013
TABLE OF CONTENTS

                         LEARNER NOTES

SESSION                          TOPIC                             PAGE
   8      1. Geomorphology consolidation                            3

  9       1. Climatology, Geomorphology and Mapwork -
                                                                   15
             consolidation exercises

  10      Climatology, Geomorphology and GIS: Consolidation         33
          Exercises
  11      Climatology, Geomorphology and Mapwork: Consolidation    47
          Exercises

                                                                         2
                       (c) Gauteng Department of Education, 2013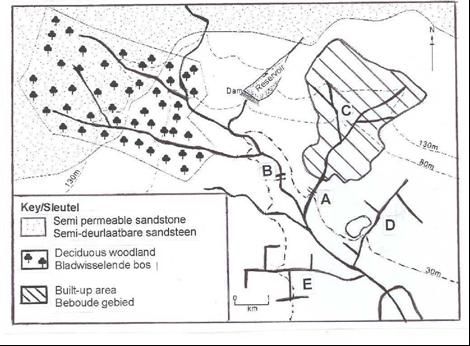
GAUTENG DEPARTMENT OF EDUCATION                  SENIOR SECONDARY INTERVENTION PROGRAMME

GEOGRAPHY                   GRADE 12                       SESSION 8              (LEARNER NOTES)

SESSION 8
TOPIC: GEOMORPHOLOGY CONSOLIDATION
Learner Note: In the prelim and final papers the geomorphology section is equally mixed
with climatology in the first two questions in Section A. You really need to know your work
well to get good marks for section A in the final exam. You must also be able to apply your
knowledge as there are some interpretation questions where you also need to understand
the processes involved in geomorphology and climatology. You must put in a lot of effort to
get to know this part of the work well. You must know the facts as you will not get marks for
vague answers.

SECTION A: TYPICAL EXAM QUESTIONS

QUESTION 1:         30 minutes               50 marks             (Source: Focus exam bank adapted.)
1.1     Various possible answers are provided for each question. Write the letter only of
        the correct answer next to the corresponding number.
1.1.1   A watershed is …
        A a large amount of rainwater flowing over the surface as overland flow or
           sheetflow.
        B   the upper level of the zone of groundwater saturation in permeable rocks.
        C   the high ground separating one drainage basin from another.
        D   a pass or valley through a mountain that is followed by a river

1.1.2   A trellis drainage pattern develops on …
        A rocks of uniform or homogeneous resistance and in an area of uniform gradient.
        B   inclined strata which are unequally resistant to erosion or in areas where there
            are parallel fold mountains.
        C   igneous rocks that have joints and cracks indicating lines of weakness.
        D   domes where streams flow outwards and downhill.

1.1.3   A hydrograph for an urban area has a shorter lag time and higher flood peak
        because,
        A there is more run off and less infiltration in urban areas.
        B   there is less run off and more infiltration in urban areas.
        C   drainage basins in urban areas are usually pear shaped.
        D   there are higher stream orders in urban areas.

1.1.4   River capture can be caused by …
        A a knickpoint on a concave river profile.
        B   a windgap that rejuvenates river flow.
        C   river terraces that join at the elbow of capture.
        D   increased headward erosion due to steeper gradient and/or larger volume.

                                                                                              3
                                (c) Gauteng Department of Education, 2013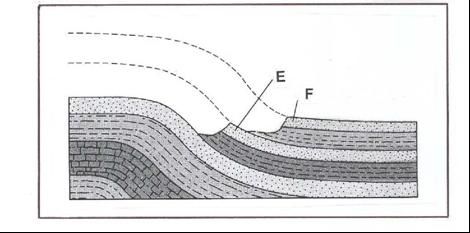
GAUTENG DEPARTMENT OF EDUCATION                   SENIOR SECONDARY INTERVENTION PROGRAMME

GEOGRAPHY                    GRADE 12                       SESSION 8         (LEARNER NOTES)

1.1.5    A river has a graded profile when …
         A laminar flow causes erosion.
         B turbulent flow causes rapids and waterfalls.
         C equilibrium has been achieved due to a balance between erosion, transportation
              and deposition.
         D erosion is greater than deposition because of rejuvenation.        (5 x 2) (10)

1.2      Carefully study the following flow chart model of fluvial runoff which follows:
1.2.1    Define these fluvial terms:
         a) Infiltration
         b) Stream discharge
         c) Baseflow                                                                  (3 x 2)(6)

1.2.2    Explain how widespread soil erosion in the catchment area of this river
         system would influence surface runoff.                                       (2 x 2)(4)

1.2.3    During drought periods with water restrictions, many residents sink boreholes
         to obtain water. Predict the long-term impact of boreholes on baseflow and
         ultimately stream discharge.                                             (2 x 2) (4)

        Source: Adapted from: Knighton, David. 1998 Fluvial Forms and Processes .Arnold
        Publishers.

                                                                                           4
                                 (c) Gauteng Department of Education, 2013
GAUTENG DEPARTMENT OF EDUCATION SENIOR SECONDARY INTERVENTION PROGRAMME
GEOGRAPHY GRADE 12 SESSION 8 (LEARNER NOTES)
Carefully study the following diagram showing ‘before’ and ‘after’ models of
landscape development before answering the questions below.
1.2.4 Identify landforms labelled A, B and C. (3 x 1) (3)
1.2.5 Use the diagram as a guide and discuss how this landscape developed. (4 x 2) (8)
1.2.6 Study the diagram on the following page that shows river capture of the
Tano River by the Volta River in Ghana. The point of capture was north
of Wenchi. Answer the questions that follow:
5
(c) Gauteng Department of Education, 2013GAUTENG DEPARTMENT OF EDUCATION SENIOR SECONDARY INTERVENTION PROGRAMME
GEOGRAPHY GRADE 12 SESSION 8 (LEARNER NOTES)
1.2.6 Identify the components of river capture labelled D, E, F and G. (4 x 2) (8)
1.2.7 List THREE factors that could have lead to the Volta River ‘capturing’ the
waters of the Tano River. (3 x 2) (6)
1.2.8 Which of the two rivers (Volta or Tano) would have the greater discharge
as they flow into the sea? (1)
[50]
HINTS: Remember that the sketches are very important. You must be able to apply work
you have done in class to a new sketch or map. Read the introductory paragraphs to
questions carefully – they often contain some direction to what is expected in the answers.
6
(c) Gauteng Department of Education, 2013GAUTENG DEPARTMENT OF EDUCATION SENIOR SECONDARY INTERVENTION PROGRAMME
GEOGRAPHY GRADE 12 SESSION 8 (LEARNER NOTES)
QUESTION 2: 64 minutes 63 marks (Source: combination of different text
books and past papers.)
2.1. The following statements are all related to physical geography. Indicate whether the
following statements are TRUE of FALSE. Write only ‘true’ or ‘false’ next to the
question numbers.
2.1.1. The misfit river is the river that loses water after river capture/piracy has occurred.
(1 x 2) (2)
2.1.2. A waterfall may develop at the elbow of capture after river capture/piracy has
occurred. (1 x 2) (2)
2.1.3. In between parallel lying, homoclinal ridges a trellis drainage pattern is most
likely to develop. (1 x 2) (2)
2.1.4. The tributaries of the main stream in a dendritic drainage pattern are all short.
(1 x 2) (2)
2.1.5. A watershed separates drainage basins. (1 x 2) (2)
2.2. North-east of Port Elizabeth one finds the settlement of Seymore that is surrounded
by a landscape similar to the one illustrated in Figure 2.1 below.
Figure 2.1
2.2.1. Is the landscape illustrated in figure 2.1 associated with inclined or horizontal strata?
(1)
2.2.2. Identify landform Y. (1)
2.2.3. Identify slopes P and Q associated with landform Y. (2 x 2) (4)
2.2.4. Explain how the underlying rock structure resulted in the development of
landform Y. (3 x 2) (6)
2.2.5. a) Which slope, P or Q, is more suitable for human settlement? (1 x 2) (2)
b) Give one reason for your answer in Question 2.2.5.(a) (1 x 2) (2)
2.2.6. Explain why the landscape illustrated in Figure 2.1. is suitable for agricultural
activities. (2 x 2) (4)
7
(c) Gauteng Department of Education, 2013GAUTENG DEPARTMENT OF EDUCATION SENIOR SECONDARY INTERVENTION PROGRAMME
GEOGRAPHY GRADE 12 SESSION 8 (LEARNER NOTES)
2.3. The nature of the landscape illustrated in Figure 2.1 lends itself to the process of river
capture/piracy. Figure 2.2 below shows a landscape before and after river
capture/piracy.
Figure 2.2
2.3.1. Identify the features of river capture/piracy labelled A, B, D and E. (2 x 2) (4)
2.3.2. Explain the process of river capture/piracy with reference to Figure 2.2. (3 x 2) (6)
2.3.3. Explain why flooding will occur more often in river B after river capture/piracy
has taken place. (2 x 2) (4)
2.3.4. Indicate how river capture/piracy will change the ability of river B to erode the
landscape. (1 x 2) (2)
2.4. Surrounding the South-Western Cape to the north and east are the parallel lying
Cape Fold Mountains. These mountain ranges develop a typical drainage pattern
with their own unique microclimate.
2.4.1 Refer to Figure 1.1A on the following page showing the drainage pattern in the
Cape Fold Mountains.
8
(c) Gauteng Department of Education, 2013GAUTENG DEPARTMENT OF EDUCATION SENIOR SECONDARY INTERVENTION PROGRAMME
GEOGRAPHY GRADE 12 SESSION 8 (LEARNER NOTES)
a) Identify the drainage pattern illustrated in Figure 1.1A. (1)
b) Give ONE reason for your answer in Question 2.5.1.(a) (1 x 2) (2)
c) Explain why this drainage pattern is characteristic of the Cape Fold
Mountains. (2 x 2) (4)
d) Excluding a trellis and dendritic drainage pattern, name any other pattern
that you have studied. (1 x 2) (2)
e) Explain why a high run-off and low infiltration will occur in the illustrated
landscape. (2 x 2) (4)
f) Name and describe any other factors that will result in a high run-off and
low infiltration. (2 x 2) (4)
[63]
SECTION B: ADDITIONAL CONTENT NOTES
No additional notes
SECTION C: HOMEWORK
QUESTION 1: 30 minutes 40 marks (Source: SBA 2010)
The hydrograph on the next page depicts the Tugela River during a storm. Refer to the
hydrograph to answer the questions below.
1.1. Define the following terms:
(a) Discharge (1 x 2) (2)
(b) A flood (1 x 2) (2)
(c) Flood Peak (1 x 2) (2)
(d) Hydrograph (1 x 2) (2)
(e) Velocity (1 x 2) (2)
9
(c) Gauteng Department of Education, 2013GAUTENG DEPARTMENT OF EDUCATION SENIOR SECONDARY INTERVENTION PROGRAMME
GEOGRAPHY GRADE 12 SESSION 8 (LEARNER NOTES)
1.2 Provide labels for A, B, D and E respectively. (4 x 2) (8)
(Choose from the following: Lag time/Rising limb/Peak discharge/Base flow)
1.3 Describe the relationship between discharge and rainfall illustrated in the flow
hydrograph. (2 x 2) (4)
1.4 List THREE factors that will affect the velocity (speed) of a river. (3 x 2) (6)
1.5 Predict what would happen to the volume of water in the river after a storm
has stopped. (1 x 2) (2)
1.6 When the lag time is long and the peak flow is low, on a hydrograph, this
indicates high infiltration. Discuss the factors that result in high infiltration in a
short paragraph (12 lines). (5 x 2) (10)
[40]
QUESTION 2: 30 minutes 50 marks (Source: Focus Exam bank)
2.1 Various possible answers are provided for each question. Write the
letter only of the correct answer next to the corresponding number.
2.1.1 Which factor will not affect the balance between erosion and deposition
in a river with a graded profile?
A A change in stream load
B A change in climate
C River capture
D A drop in sea level
10
(c) Gauteng Department of Education, 2013GAUTENG DEPARTMENT OF EDUCATION SENIOR SECONDARY INTERVENTION PROGRAMME
GEOGRAPHY GRADE 12 SESSION 8 (LEARNER NOTES)
2.1.2 The main factors determining to which extent a river is able to deepen
its course is:
(i) Gradient
(ii) Flow
(iii) Load
(iv) Stream channel characteristics
Select the correct option.
A (i) and (ii)
B (iii) and (iv)
C (i) and (iv)
D (i), (ii), (iii) and (iv)
2.1.3 An antecedent river valley …
A is older than the geological structure through which it carves its
route.
B has a superimposed drainage system.
C had to carve into the underlying structure because the river valley
was too deeply carved.
D stretches across a resistant rock layer which is older than the river
valley itself.
2.1.4 Features that can form as a result of rejuvenation are …
(i) incised meanders.
(ii) valleys within valleys.
(iii) knickpoint waterfall.
(iv) river terraces.
Select the correct combination
A (i), (ii) and (iv)
B (ii), (iii) and (iv)
C (i), (ii) (iii) and (iv)
D (i), (ii) and (iii)
2.1.5.The most dominant process in the youth stage of a river is:
A Deposition
B Downward erosion
C Lateral erosion
D Weathering
(5 x 2) [10]
11
(c) Gauteng Department of Education, 2013GAUTENG DEPARTMENT OF EDUCATION SENIOR SECONDARY INTERVENTION PROGRAMME
GEOGRAPHY GRADE 12 SESSION 8 (LEARNER NOTES)
2.2 Study the following longitudinal river profile along the Congo River in
Africa.
2.2.1 Copy the river profile onto your answer book and on it indicate:
a) One temporary base level (1 x 2) (2)
b) One knick point (1 x 2) (2)
c) Permanent base level (1 x 2) (2)
2.2.2 Copy and complete the following table to compare the characteristics of
the Congo River at point X and Y:
Fluvial characteristics Point X Point Y
Stream width
Stream load
Stream volume
Stream velocity
Type of stream flow
(10 x 1) (10)
2.2.3 Does the longitudinal river profile of the Congo River show a graded river
profile? Support your answer with evidence from the longitudinal river profile.
(3 x 2) (6)
2.2.4 River braiding occurs at point Z. Using an annotated sketch (drawing with
labels), demonstrate how such features form. (4 x 2)(8)
12
(c) Gauteng Department of Education, 2013GAUTENG DEPARTMENT OF EDUCATION SENIOR SECONDARY INTERVENTION PROGRAMME
GEOGRAPHY GRADE 12 SESSION 8 (LEARNER NOTES)
2.2.5 A dam is being constructed across the Congo River at point D. Write a
report for the Minister of Water Affairs in which you:
Outline the fluvial changes in the river both upstream and downstream of
the dam wall, and list the benefits of the dam. (5 x 2)(10)
[50]
SECTION D: SOLUTIONS AND HINTS TO SECTION A
QUESTION 1
1.1.1 C (2)
1.1.2 B (2)
1.1.3 A (2)
1.1.4 D (2)
1.1.5 C (2)
[10]
1.2.1 a) Infiltration: movement of water through soil into the ground
b) Stream discharge: quantity of water flowing in a river
c) Baseflow: the flow of water entering stream channels from groundwater
(3 x 2) (6)
1.2.2 Widespread soil erosion would increase surface runoff; there would be
less vegetation (which aids infiltration) and ground would be bare favoring runoff
(which in turn would increase soil erosion). There would also be more silt
in the runoff. (2 x 2) (4)
1.2.3 Bore holes pump water up from underground. If this removal of water
increased, there would be less baseflow and ultimately less stream
discharge. (2 x 2) (4)
1.2.4 A: mesa
B: butte
C: pediplain; plain; pediment (3 x 1) (3)
13
(c) Gauteng Department of Education, 2013GAUTENG DEPARTMENT OF EDUCATION SENIOR SECONDARY INTERVENTION PROGRAMME
GEOGRAPHY GRADE 12 SESSION 8 (LEARNER NOTES)
1.2.5 This landscape is an example of a landscape influenced by horizontal rock strata.
Horizontal layers of resistant cap rock (e.g. dolerite, quartzite, basalt) protected the
softer layers below (e.g. sandstone);
These rock layers also caused landforms (e.g. mesas, buttes) to have flat tops.
The landscape evolved over millions of years by rivers wearing the landscape down
(and back).
Eventually the landscape will be eroded away with perhaps only a few small
remnants remaining. (4 x 2) (8)
1.2.6 D: beheaded river, misfit stream
E: wind gap/river gravels/dry gap
F: elbow of capture
G: capturing river, pirate stream, captor (4 x 2) (8)
1.2.7 Any three of the following:
Softer/ less resistant rock,
Geological weakness (e.g. crack, joint, fault),
Increased precipitation,
Increased discharge,
Increased gradient,
Rejuvenation (3 x 2) (6)
1.2.8 Volta (1)
[40]
[50]
QUESTION 2
2.1.1 True
2.1.2. True
2.1.3. True
2.1.4. False
2.1.5. True (5 x 2) (10)
2.2.1. Inclined (1)
2.2.2. Homoclinal ridge (1)
2.2.3. P – Dip slope
Q – Scarp slope (2 x 2) (4)
2.2.4. Inclined sedimentary rock
With hard and soft rock which is exposed to the surface,
The soft rock is eroded and the hard rock remains as a low ridge called a
dip slope,
The steeper slope is called the scarp slope. (3 x 2) (6)
2.2.5. a) P (2)
b) P is more gradual (2)
2.2.6. Vineyards and agriculture on the gentle slopes/
Contour ploughing/
Steep slopes forests. (2 x 2) (4)
14
(c) Gauteng Department of Education, 2013GAUTENG DEPARTMENT OF EDUCATION SENIOR SECONDARY INTERVENTION PROGRAMME
GEOGRAPHY GRADE 12 SESSION 9 (LEARNER NOTES)
2.3.1. A – captive / captured river / Pirated stream
B – Captor river / Pirate stream
D – Elbow of capture
E – Misfit river (4)
2.3.2. The energetic fist order stream erodes back into the mountain,
It may be weaker rock / more rain / more water in river
Headward erosion cuts through watershed,
Stream lengthens itself and catching hold of the older river on a higher
slope. (3 x 2) (6)
2.3.3. It has more water in it,
Increased its hydrological drainage basin (2 x 2) (4)
2.3.4. It will increase as there is more water in it / increased volume. (1 x 2) (2)
2.4.1. a) Trellis (1)
b) Parallel streams with short tributaries (1 x 2) (2)
c) Formed in sedimentary rocks with band of resistant and weak rocks.
Main river forms in valleys, short tributaries join from the mountains.
(2 x 2)
(4)
d) Rectangular, angular, deranged, radial, barbed etc. (1 x 2) (2)
e) Impermeable rock at the surface does not allow water to infiltrate
and, therefore, increases the runoff. (2 x 3) (6)
f) Sparse vegetation– infiltration does not take place etc
Steep slopes - water runs down to fast to allow for infiltration
Saturated soils - water cannot infiltrate wet soil
[Any ONE with reason] (1 x 2) (2)
[61]
15
(c) Gauteng Department of Education, 2013GAUTENG DEPARTMENT OF EDUCATION SENIOR SECONDARY INTERVENTION PROGRAMME
GEOGRAPHY GRADE 12 SESSION 9 (LEARNER NOTES)
SESSION 10
TOPIC: CLIMATOLOGY, GEOMORPHOLOGY AND MAPWORK CONSOLIDATION
EXERCISES
SECTION A: TYPICAL EXAM QUESTIONS
QUESTION 1: 30 minutes 50 marks (Various class notes and past
papers)
1.1 Various possible answers are provided for each question. Write the letter only of
the correct answer next to the corresponding number .
1.1.1 The movement of air towards a low pressure is called:
A Divergence
B Adiabatic
C Anabatic
D Convergence
1.1.2 The atmospheric cell found on either side of the equator is the:
A Ferrel Cell
B Mid-latitude Cell
C Tropical cyclone
D Hadley Cell
1.1.3 The ITCZ is the convergence of:
A Polar Easterlies
B Westerlies
C Tropical Westerlies
D Tropical Easterlies
1.1.4 Winds that converge at the polar front are:
A Westerlies and tropical easterlies
B Polar easterlies and westerlies
C Polar westerlies
D Polar easterlies and tropical westerlies
1.1.5 The anticlockwise change in direction of wind with the passing of a
mid-latitude cyclone over Cape Town is called:
A Backing
B Veering
C Converging
D Rotating (5 x 2) (10)
16
(c) Gauteng Department of Education, 2013GAUTENG DEPARTMENT OF EDUCATION SENIOR SECONDARY INTERVENTION PROGRAMME
GEOGRAPHY GRADE 12 SESSION 9 (LEARNER NOTES)
1.2 Study the accompanying synoptic weather map and answer the questions that
follow:
1.2.1 Suggest the season giving two reasons for your answer. (3 x 2) (6)
1.2.2 Estimate the pressure over Cape Town. (1 x 2) (2)
1.2.3 Describe the wind over Cape Town and give a full account or
explanation. (4 x 2) (8)
1.2.4 How will the weather over Cape Town change in the next 12 hours? (3 x 2) (6)
1.2.5 To the west of South Africa are a series of cold fronts. What do we
call a series of frontal depressions? (1 x 2) (2)
17
(c) Gauteng Department of Education, 2013GAUTENG DEPARTMENT OF EDUCATION SENIOR SECONDARY INTERVENTION PROGRAMME
GEOGRAPHY GRADE 12 SESSION 9 (LEARNER NOTES)
1.3 The following diagram shows the passage of a hurricane in the Carribean Sea.
1.3.1 In which hemisphere can this hurricane be found? (1 x 2) (2)
1.3.2 What is the difference between a tropical storm and a tropical
cyclone? (1 x 2) (2)
1.3.3 Describe and account for the path taken by the hurricane. (4 x 2) (8)
1.3.4 Predict, giving reasons, the course the hurricane will probably take
over the next few days. (2 x 2) (4)
[50]
18
(c) Gauteng Department of Education, 2013GAUTENG DEPARTMENT OF EDUCATION SENIOR SECONDARY INTERVENTION PROGRAMME
GEOGRAPHY GRADE 12 SESSION 9 (LEARNER NOTES)
QUESTION 2: 40 minutes 50 marks (Various class notes and past papers)
2.1 Choose a description from COLUMN B that matches an item in COLUMN A.
Write only the letter (A-L) next to the question number (2.1.1 – 2.1.5).
COLUMN A COLUMN B
2.1.1 Abstraction A the cold front merges with the warm front
2.1.2 Captured river and the warm sector is lifted off the ground
2.1.3 Scarp retreat B the erosion of a slope at a constant angle
2.1.4 Soil creep C air that moves up a slope during the day
2.1.5 Base level of erosion D the very slow downward movement of soil
under the influence of gravity
E the lowest level to which a river will erode
F the lengthening of a river course by the
river cutting backwards towards its source
G the inward horizontal flow of air towards its
source
H the tendency of air moving across the
rotating surface of the earth to be
deflected
I warm, dry winds that flow down the
escarpment
J a river that is diverted and loses water
K a watershed is cut back and lowered by
highly erosive rivers
L air that is warmer than its environment will
continue to rise
(5 x 2) (10)
2.2 Figure A below shows the longitudinal profile of a stream before rejuvenation has
taken place. Figure B shows the longitudinal profile of the same stream after
rejuvenation has taken place.
19
(c) Gauteng Department of Education, 2013GAUTENG DEPARTMENT OF EDUCATION SENIOR SECONDARY INTERVENTION PROGRAMME
GEOGRAPHY GRADE 12 SESSION 9 (LEARNER NOTES)
2.2.1. The longitudinal profile illustrated in Figure A is that of a graded stream.
What is meant by a graded stream? (1 x 2) (2)
2.2.2 With reference to figure A, give ONE piece of evidence to support the
Statement that the longitudinal profile of a graded stream is being
illustrated. (1 x 2) (2)
2.2.3 Explain why a graded stream develops a concave longitudinal profile. (2 x 2) (4)
2.2.4 What is meant by the term rejuvenation? (1 x 2) (2)
2.2.5 What feature in figure B indicates that rejuvenation has taken place? (1 x 2) (2)
2.2.6 Give TWO reasons why a stream can rejuvenate itself. (2 x 2) (4)
2.2.7 Is the knick point waterfall shown in figure B an example of a permanent
or a temporary base level of erosion? (1 x 2) (2)
2.2.8 Give a reason for your answer to Question 2.2.7. (1 x 2) (2)
2.3 Study the following sketch map of the Zambezi River Basin. Answer all the
questions that follow.
20
(c) Gauteng Department of Education, 2013GAUTENG DEPARTMENT OF EDUCATION SENIOR SECONDARY INTERVENTION PROGRAMME
GEOGRAPHY GRADE 12 SESSION 9 (LEARNER NOTES)
2.3.1 What is the probable underlying geology of this area? (1 x 2) (2)
2.3.2 Name TWO different types of temporary base levels found on this map. (2 x 2) (4)
2.3.3 Draw labelled sketch cross profiles to contrast the shape of the valley:
(a) Upstream of the Victoria Falls (1 x 2) (2)
(b) Downstream of the Victoria Falls (1 x 2) (2)
2.3.4 What is the stream order up to the point marked 1. (1 x 2) (2)
2.3.5 Name the features at numbers 2, 3, 4 and 5 that are characteristic of
stream capture. (4 x 2) (8)
[50]
QUESTION 3: 20 minutes 17 marks (Various class notes and past papers)
Carefully study the 1:50 000 topographical map extract 2829AC Harrismith and the
accompanying 1:10 000 othophoto extract 2829AC 3 Harrismith
3.1 What is the latitude of spot height •2281 in H2? (1)
3.2 State if it is possible (under normal conditions), for a person standing at
spot height •1747 (E3) to see the cemetery on Wessdoll farm (C4). Give a
reason for your answer. (2)
3.3 What is the approximate area of the outlined part of the orthophoto map
Marked B? (in square meters). (1)
3.4 A person walks in a straight line from spot height •1786 (G4) to
trigonometrical station (trig beacon) Δ298 (H3).
3.4.1 Along what type of slope is the person walking? (1)
3.4.2 What is the bearing a person would follow when walking in a straight line
from spot height •1786 (G4) to trigonometrical station Δ298 (H3)? (1)
3.4.3 What is the gradient of the person’s walk? (3)
3.4.4 If a person walks in a straight line (from •1786 to Δ298) at an average
speed of 2km per hour, approximately how long will the walk take? (1)
3.5 Study the unnamed river that rises on Platberg at D (H1) to where it leaves
the map. Also study the Nuwejaarspruit from E (A4) to F (A2). Compare
the fluvial characteristics of these rivers and the valleys in which they flow.
Tabulate your answer. (4)
3.6 Which map projection is usually associated with large-scale topographical
maps? (1)
3.7 What makes spatial data different from other data? Elaborate. (2)
[17]
21
(c) Gauteng Department of Education, 2013GAUTENG DEPARTMENT OF EDUCATION SENIOR SECONDARY INTERVENTION PROGRAMME
GEOGRAPHY GRADE 12 SESSION 9 (LEARNER NOTES)
22
(c) Gauteng Department of Education, 2013GAUTENG DEPARTMENT OF EDUCATION SENIOR SECONDARY INTERVENTION PROGRAMME
GEOGRAPHY GRADE 12 SESSION 9 (LEARNER NOTES)
23
(c) Gauteng Department of Education, 2013GAUTENG DEPARTMENT OF EDUCATION SENIOR SECONDARY INTERVENTION PROGRAMME
GEOGRAPHY GRADE 12 SESSION 9 (LEARNER NOTES)
SECTION B: HOMEWORK
QUESTION 1: 30 minutes 40 marks (Source: Previous NCS papers adapted)
1.1 Study the maps of the pressure systems in July and January below before
answering the questions that follow.
1.1.1 Name pressure belts A, B and C respectively. (3 x 1) (3)
1.1.2 What can be noticed with regard to the position of pressure belt A in
July and its position in January? (1 x 2) (2)
1.1.3 Why does this pressure belt take up these positions? (1 x 2) (2)
24
(c) Gauteng Department of Education, 2013GAUTENG DEPARTMENT OF EDUCATION SENIOR SECONDARY INTERVENTION PROGRAMME
GEOGRAPHY GRADE 12 SESSION 9 (LEARNER NOTES)
1.1.4 Why does this pressure belt extend particularly far north over North America
and Asia in July? (1 x 2) (2)
1.1.5 What has replaced this pressure belt in Asia in January? (1)
1.1.6 Why does this occur? (1 x 2) (2)
1.1.7 Why does pressure B consist of three cells over the ocean in the southern
hemisphere in January? (1 x 2) (2)
1.1.8 What name is given to the latitudes influenced by pressure belt B? (1)
[15]
1.2 Look at the satellite image below and then answer the questions that follow.
1.2.1 How many hurricanes had occurred prior to Hurricane Katrina in this hurricane
season? Motivate your answer. (2 x 1) (2)
1.2.2 How does this satellite image show that New Orleans is in the Northern
Hemisphere? (1 x 2) (2)
1.2.3 Describe and give reasons for the weather conditions in the eye of the
hurricane. (4 x 1) (4)
1.2.4 State the direction from which the hurricane came, and predict the direction
in which it will move within the next 12 hours. (2 x 1) (2)
1.2.5 Explain why the hurricane will dissipate as it moves over the land. (5)
[15]
25
(c) Gauteng Department of Education, 2013GAUTENG DEPARTMENT OF EDUCATION SENIOR SECONDARY INTERVENTION PROGRAMME
GEOGRAPHY GRADE 12 SESSION 9 (LEARNER NOTES)
1.3 Study the contour sketch and illustrations below and answer the questions
that follow.
1.3.1 How many major drainage basins are present on the map? (1 x 2) (2)
1.3.2 Briefly explain how you would determine the drainage density of one
of the drainage basins. (1 x 2) (2)
1.3.3 Which one of the cross-profiles, F1 and F2, would you expect to find at
B? Give two reasons for your answer. (1+1 x 2) (3)
1.3.4 What type of drainage pattern would you expect to find at C?
Give one reason for your answer. (1+1 x 2) (3)
[10]
QUESTION 2: 30 minutes 50 marks (Source: Previous NCS papers adapted)
2.1 The diagram below is a cross-section through the ITCZ in June at Kano in
West Africa
26
(c) Gauteng Department of Education, 2013GAUTENG DEPARTMENT OF EDUCATION SENIOR SECONDARY INTERVENTION PROGRAMME
GEOGRAPHY GRADE 12 SESSION 9 (LEARNER NOTES)
2.1.1 What does ITCZ stand for? (1)
2.1.2 Why is the rising of air so strong at the ITCZ? (1 x 2) (2)
2.1.3 Identify the winds at A. (1)
2.1.4 Identify the type of clouds at B. (1)
2.1.5 Which three-dimensional primary cell is found at C? (1)
2.1.6 Does Kano lie in the northern or southern hemisphere?
Motivate your answer. (2 x 1) (2)
2.1.7 Why is there ‘little rain’at D? (1 x 2) (2)
[10]
2.2 Study the synoptic chart below and then answer the questions that follow.
2.2.1 Give the correct synoptic terms for the features labelled A to H respectively.
(8 x ½) (4)
2.2.2 Name the two high-pressure cells labelled X and Y respectively. (2 x 1) (2)
2.2.3 To which pressure belt do X and Y belong? (1)
2.2.4 Describe all air movement and weather associated with the cells of pressure
named in the previous question. 2 x 2) (4)
2.2.5 Use the station model to describe the weather at station Z. (6 x ½) (3)
2.2.6 What two factors shown on this synoptic chart indicate that this is a summer
chart? (2 x 1) (2)
2.2.7 C, D and E are part of a larger synoptic feature. Identify this feature and, giving
a reason, predict the direction in which it will move. (3)
2.2.8 Draw a sketch cross-section from P to Q to show the weather that is associated
with feature D. (5)
[24]
27
(c) Gauteng Department of Education, 2013GAUTENG DEPARTMENT OF EDUCATION SENIOR SECONDARY INTERVENTION PROGRAMME
GEOGRAPHY GRADE 12 SESSION 9 (LEARNER NOTES)
2.3 Study the longitudinal profile from west to south-east of the Congo River, found
below. The Congo River is a perennial river. Answer the questions that follow.
2.3.1 With reference to the profile, define (a) longitudinal profile and (b) local base
level. (2 x 1) (2)
2.3.2 Compare and contrast the type of river flow that you would expect at A and
B along the profile. (2 x 2) (4)
2.3.3 The Inga Rapids are the site of a planned hydroelectric power scheme.
Give two advantages of this site for such a scheme. (2 x 1) (2)
2.3.4 Imagine a drop in sea level by 200 meters. Draw the new longitudinal river
profile of the Congo River to show this, and clearly label the features that
would probably result. (4)
[12]
2.4 The illustration below shows a cross-section through a structural landscape.
Study it and then answer the questions that follow.
28
(c) Gauteng Department of Education, 2013GAUTENG DEPARTMENT OF EDUCATION SENIOR SECONDARY INTERVENTION PROGRAMME
GEOGRAPHY GRADE 12 SESSION 9 (LEARNER NOTES)
2.4.1 Identify the landforms indicated by P and Q respectively. (2 x 1) (2)
2.4.2 List the four slope forms labelled W, X, Y and Z respectively. (4 x ½) (2)
[4]
SECTION C: SOLUTIONS AND HINTS TO SECTION A
QUESTION 1
1
1.1.1 D√√
1.1.2 D√√
1.1.3 D√√
1.1.4 B√√
1.1.5 A√√ (5 x 2) (10)
1.2
1.2.1 Winter √√
Date√√
Cold front far north√√
OR
(Low temperatures√√) (Any 2 reasons) (3 x 2) (6)
1.2.2 1010mb/hPa√√ (1 x 2) (2)
1.2.3 NW√√
15 knots√√
Clockwise rotation around LP√√
Geostrophic wind√√ (4 x 2) (8)
1.2.4 Winds will veer to South West√√
Rain will occur√√
Temperature will drop√√ (3 x 2) (6)
1.2.5 Family(ies) √√ (1 x 2) (2)
1.3
1.3.1 Northern hemisphere√√ (1 x 2) (2)
1.3.2 A storm is mild and can lead to the development of a
cyclone√√ (1 x 2) (2)
1.3.3 It moved from east to west √√and away from the equator√√
Tropical easterlies drove it√√
Centrifugal force pushed it away from the equator√√ (4 x 2) (8)
1.3.4 It will move northwards and if it reaches the westerlies√√ it will move
eastwards causing it to dissipate√√ (2 x 2) (4)
[50]
QUESTION 2
2.1
2.1.1 K√√
2.1.2 J√√
2.1.3 B√√
2.1.4 D√√
2.1.5 E√√ (5 x 2) (10)
29
(c) Gauteng Department of Education, 2013GAUTENG DEPARTMENT OF EDUCATION SENIOR SECONDARY INTERVENTION PROGRAMME
GEOGRAPHY GRADE 12 SESSION 9 (LEARNER NOTES)
2.2
2.2.1 When an equilibrium / balance has been reached between erosion
and deposition in the stream√√ (1 x 2) (2)
2.2.2 Smooth, concave longitudinal profile√√
OR
Longitudinal profile steep in upper reaches and gradual in lower reaches
(Any ONE) (1 x 2) (2)
2.2.3 Needs more energy to overcome high friction index in upper reaches
and to transport large stream load particles√√
Needs less energy to overcome low friction index in lower reaches and
to transport small stream load particles√√ (2 x 2) (4)
2.2.4 Stream gains energy and starts to erode downwards into the
landscape (concept) √√ (1 x 2) (2)
2.2.5 Knickpoint waterfall√√ (1 x 2) (2)
2.2.6 (Any TWO)
Increased precipitation√√
Increase in volume of water√√
Stream capture√√
Reduction in vegetation increases run-off√√
Drop in sea-level√√
Isostic uplift of land√√ (2 x 2) (4)
2.2.7 Temporary√√ (1 x 2) (2)
2.2.8 In time the waterfall will be eroded away√√ (1 x 2) (2)
2.3
2.3.1 Uniformly resistant rock probably horizontal sedimentary rock√√ (1 x 2) (2)
2.3.2 (Any TWO)
Lake Kariba√√ , Victoria Falls√√, or dam (2 x 2) (4)
2.3.3 (a)
Open V √√ (1 x 2) (2)
(b)
Closed V √√ (1 x 2) (2)
2.3.4 3√√ (1 x 2) (2)
2.3.5 2 = captured stream√√
3 = elbow of capture√√
4 = Misfit stream√√
5 = river gravels or wind gap√√ (4 x 2) (8)
[50]
30
(c) Gauteng Department of Education, 2013GAUTENG DEPARTMENT OF EDUCATION SENIOR SECONDARY INTERVENTION PROGRAMME
GEOGRAPHY GRADE 12 SESSION 9 (LEARNER NOTES)
QUESTION 3
3.1 28º16’40”S √ (1)
3.2 No √ Intervening high ground (Queens Hill) √ (2)
3.3 5,1 cm x 3,1 cm
(5,1 x 100) x (3,1 x 100)
510m x 310m
158 100m²√ (1)
3.4
3.4.1 Concave slope√ (1)
3.4.2 41º√ (1)
3.4.3 Gradient = VI
HE
= 2365,5 - 1786
4,6cm √
= 579,5
4,6 x 500
= 579,5
2300
= 579,5 ÷579,5
2300 ‚ 579,5 √
= 1
3,968
= 1: 3,968 √ (3)
3.4.4 2 hours 15 minutes √ (1)
(4,6cm x500
2300m
Walks at 2km per hour
2000m an hour
300m ÷ 2000 takes 15 minutes
2 hr 15 min)
3.5 (Any FOUR) √√√√ (4)
Unnamed river Nuwejaarspruit
Concave longitudinal profile Flat longitudinal profile
Flows down steep gradient Flows down gentle gradient
Upper course Lower/middle course
No flood plain Wide flood plain
Has no ox-bow lakes Has ox-bow lakes
Slower flowing Faster flowing
Turbulent flow Laminar flow
31
(c) Gauteng Department of Education, 2013GAUTENG DEPARTMENT OF EDUCATION SENIOR SECONDARY INTERVENTION PROGRAMME
GEOGRAPHY GRADE 12 SESSION 9 (LEARNER NOTES)
3.6 Transverse Mercator projection√ (1)
3.7 They store location in some way√
(Any ONE)
As coordinates√
As addresses√
As place names√ (2)
[17]
The SSIP is supported by
32
(c) Gauteng Department of Education, 2013GAUTENG DEPARTMENT OF EDUCATION SENIOR SECONDARY INTERVENTION PROGRAMME
GEOGRAPHY GRADE 12 SESSION 10 (LEARNER NOTES)
SESSION 10
TOPIC: CLIMATOLOGY, GEOMORPHOLOGY AND GIS CONSOLIDATION EXERCISES
Learner Note: In the prelim and final papers the geomorphology section is equally mixed
with climatology in the first two questions in Section A. You need to know your work really
well to get good marks for section A in the final exam. You must also be able to apply your
knowledge as there are some interpretation questions where you need to understand the
processes involved in geomorphology and climatology. These applications also apply to the
map work interpretation. You must put in a lot of effort to get to know this part of the work
well. You must know the facts as you will not get marks for vague answers.
For session 12 you will be assessed on the above mentioned topics in various ways in order
to prepare you for various question styles during the June examination.
SECTION A: TYPICAL EXAM QUESTIONS
QUESTION 1: 40 minutes 60 marks (Source: NCS Feb/March 2010)
1.1 Refer to FIGURE 1.1 showing a weather system that often occurs along the
east coast of Southern Africa.
Figure 1.1
Various options are given as possible answers to the questions that follow.
Choose the answer and write only the letter (A – D) next to the question
number (1.1.1 – 1.1.5) for example 1.1.6 A.
33GAUTENG DEPARTMENT OF EDUCATION SENIOR SECONDARY INTERVENTION PROGRAMME
GEOGRAPHY GRADE 12 SESSION 10 (LEARNER NOTES)
1.1.1 The diagram illustrates a …
A mid-latitude cyclone.
B coastal low pressure.
C line thunderstorm.
D tropical cyclone.
1.1.2 The following air movements are associated with the illustrated
weather system along the coast of Southern Africa:
A Subsidence, convergence, clockwise rotation, uplift
B Uplift, divergence, anticlockwise rotation, subsidence
C Uplift, divergence, clockwise rotation, subsidence
D Subsidence, divergence, anticlockwise rotation, uplift
1.1.3 The main cloud types associated with this weather system are …
clouds.
A cumulonimbus
B cumulus
C cirrus
D nimbostratus
1.1.4 The following conditions will exist at A:
A Cloudless, low pressure, windless
B Cloudless, high pressure, windless
C Cloudy, low pressure, light rain
D Cloudy, high pressure, heavy rain
1.1.5 The weather system is in the … stage of development.
A initial/formative
B immature
C mature
D decaying/dissipating (5 x 2) [10]
1.2 FIGURE 1.2 shows a berg wind that often occurs along the south coast of
South Africa. Use your knowledge of berg winds and also refer to FIGURE
1.2 to answer the questions below.
34GAUTENG DEPARTMENT OF EDUCATION SENIOR SECONDARY INTERVENTION PROGRAMME
GEOGRAPHY GRADE 12 SESSION 10 (LEARNER NOTES)
Figure 1.2
1.2.1 In the diagram name the cell which is having the biggest impact on
weather conditions? (1 x 2) (2)
1.2.2 Explain and account for the impact it is having on temperatures.
(You should make use of a diagram to help explain your answer). (4 x 2) (8)
[10]
1.3 Refer to Figure 1.3 on the following page, which shows a typical South African city.
35GAUTENG DEPARTMENT OF EDUCATION SENIOR SECONDARY INTERVENTION PROGRAMME
GEOGRAPHY GRADE 12 SESSION 10 (LEARNER NOTES)
FIGURE 1.3
1.3.1 What do we call this type of weather phenomena? (1 x 2) (2)
1.3.2 What is the sketch trying to depict by means of the large arrows?
(1 x 2) (2)
1.3.3 What factors are responsible for higher temperature over the CBD?
(3 x 2) (6)
1.3.4 Explain the air circulatory pattern experienced during the day. (2 x 2) (4)
1.3.5 Why is pollution over this city worse in winter than in summer?
(3 x 2) (6)
[20]
1.4
1.4.1 What is the Kyoto protocol? (2 x 2) (4)
1.4.2 How can third world nations reduce climate change? (3 x 2) (6)
[10]
1.5 Provide suitable explanations for the following terms:
1.5.1 Hadley cell
1.5.2 ITCZ
1.5.3 Adiabatic heating
1.5.4 Latent heat
1.5.5 Aspect (5 x 2) [10]
[60]
36GAUTENG DEPARTMENT OF EDUCATION SENIOR SECONDARY INTERVENTION PROGRAMME
GEOGRAPHY GRADE 12 SESSION 10 (LEARNER NOTES)
QUESTION 2: 30 minutes 40 marks
(Source NCS Feb/March 2010 and various previous papers)
2.1 Indicate whether the following statements are TRUE or FALSE. Choose the
answer and write only „true‟ or „false‟ next to the question number
2.1.1 An aquifer is a rock that is impermeable and does not allow water to move
through it.
2.1.2 A flow hydrograph records how much water passes a given point in a
given period of time.
2.1.3 A periodic river is a river that only flows in the rainy season when it
receives ground water.
2.1.4 Rocks that are uniformly resistant and exposed to the same type of
weathering will weather at different rates.
2.1.5 Core stones are rounded stones that are exposed after erosion to
make up a tor. (5 x 2) (10)
2.2 Define the following terms:
2.2.1 Drainage basin (1 x 2) (2)
2.2.2 River system (1 x 2) (2)
[4]
2.3 The following hydrograph depicts the Zambezi River shortly before it enters
the Indian Ocean
2.3.1 Supply labels B, A and D. (3 x 2) (6)
2.3.2 At what approximate time did the maximum rainfall occur? (1 x 2) (2)
2.3.3 Account for the difference in shape between lines C and E. (2 x 2) (4)
37GAUTENG DEPARTMENT OF EDUCATION SENIOR SECONDARY INTERVENTION PROGRAMME
GEOGRAPHY GRADE 12 SESSION 10 (LEARNER NOTES)
2.3.4 Supply the correct name of the place where two tributaries
join each other. (1 x 2) (2)
2.3.5 List the factors that will influence how quickly line D increases. (5 x 2) (10)
2.3.6 Define what is meant by a flood. (1 x 2) (2)
[26]
[40]
QUESTION 3: 20 minutes 20 marks (Source: NCS Feb/March 2010)
GEOGRAPHICAL INFORMATION SYSTEMS (GIS)
3.1 Name any TWO components of GIS. (2 x 2) (4)
3.2 Identify any example of a polygon feature, a line feature and a point feature
respectively, on any topographical map. (3 x 2) (6)
3.3 Explain what is meant by data integration. (1 x 2) (2)
3.4 Name ONE problem that was experienced with data integration prior to
the introduction of GIS. (1 x 2) (2)
3.5 Of what importance is data integration to a geographer? (1 x 2) (2)
3.6 What is a database? (1 x 2) (2)
3.7 Why is it sometimes necessary to manipulate data in a database? (1 x 2) (2)
[20]
SECTION B: HOMEWORK
QUESTION 1: 30 minutes 50 marks (Source: X-Kit Geography Gr. 12 FET Phase)
1.1 Study the field sketch below and then explain, from a local climate point of view,
each of the following:
38GAUTENG DEPARTMENT OF EDUCATION SENIOR SECONDARY INTERVENTION PROGRAMME
GEOGRAPHY GRADE 12 SESSION 10 (LEARNER NOTES)
1.1.1 Why are citrus orchards, which are damaged by frost, grown on the slopes
of this valley? (1 x 2) (2)
1.1.2 Why does a blanket of fog and smog cover this valley on some winter
mornings? (2 x 2) (4)
1.1.3 What is the reason for the residential areas of Hartswater being affected
by industrial pollution in the afternoon? (2 x 2) (4)
1.1.4 Why are the residential sites on the hill popular for settlement? (1 x 2) (2)
1.1.5 What are the reasons for temperatures in Hartswater being a little
warmer than the surrounding farmlands? (Any THREE) (3 x 2) (6)
[18]
1.2 Study the diagram below and answer the questions that follow.
1.2.1 Name the feature shown by •••••• (1 x 2) (2)
1.2.2 Name the pressure at A. (1 x 2) (2)
1.2.3 Name the pressure belt at B. (1 x 2) (2)
1.2.4 Why has this belt split into three cells? (2 x 2) (4)
[10]
39GAUTENG DEPARTMENT OF EDUCATION SENIOR SECONDARY INTERVENTION PROGRAMME
GEOGRAPHY GRADE 12 SESSION 10 (LEARNER NOTES)
1.3 The figure below illustrates a cross-section through the mature stage
of a mid-latitude cyclone
1.3.1 Which letter marks the cold front? (1 x 2) (2)
1.3.2 In a table, draw up a comparison of the warm and cold fronts of a
mid-latitude cyclone in its mature stage. Include the following aspects:
Steepness of front
Associated cloud types
Type of rainfall (3 x 2) (6)
1.3.3 What is the sector called at D? (1 x 2) (2)
1.3.4 What is the sector called at E? (1 x 2) (2)
1.3.5 How does the weather experienced at position E differ from that
experienced at position D? (3 x 2) (6)
1.3.6 The diagram illustrates a mid-latitude cyclone in the mature stage.
What is the next stage and what processes have taken place? (1 + 3) (4)
[22]
[50]
QUESTION 2: 30 minutes 50 marks (Source: X-Kit Geography Gr. 12 FET Phase)
2.1 Study the diagram on the following page and answer the questions that follow.
40GAUTENG DEPARTMENT OF EDUCATION SENIOR SECONDARY INTERVENTION PROGRAMME
GEOGRAPHY GRADE 12 SESSION 10 (LEARNER NOTES)
2.1.1 With reference to the diagram explain the terms „temporary base level‟
and „stream braiding‟. (2 x 2) (4)
2.1.2
(a) Draw a simple longitudinal profile of this river from A to B, and label the
waterfall. (4)
(b) Does the longitudinal profile from A to B show a graded profile?
Explain your answer. (2 x 2) (4)
2.1.3 The river terraces at C are evidence that this river has been rejuvenated.
(a) Explain the term rejuvenation. (1 x 2) (2)
(b) Using an annotated sketch, describe how the process of rejuvenation
led to the formation of these river terraces. (3 x 2) (6)
[20]
41GAUTENG DEPARTMENT OF EDUCATION SENIOR SECONDARY INTERVENTION PROGRAMME
GEOGRAPHY GRADE 12 SESSION 10 (LEARNER NOTES)
2.2 Look at the figure below and answer the following questions:
2.2.1 When did the maximum rain occur? (1 x 2) (2)
2.2.2 What was the discharge of the river before the storm occurred? (1 x 2) (2)
2.2.3 What was the height of the flood peak? (1 x 2) (2)
2.2.4 What is the lag time? (1 x 2) (2)
2.2.5 How long did it take for the river discharge to drop from the flood peak
to what it was before the storm took place? (1 x 2) (2)
[10]
2.3 Look at the illustration below and answer the questions that follow
2.3.1 Explain in what way and why the energy characteristics of the river will change
between A and B. (2 x 2) (4)
2.3.2 Explain, with motivation, the reason for the great amount of silt in the river
at C. (2 x 2) (4)
2.3.3 How and why will the volume of the river change downstream of D? (2 x 2) (4)
2.3.4 In what way and why will the energy change if deforestation takes place
at X? (1 x 2) (2)
[14]
42GAUTENG DEPARTMENT OF EDUCATION SENIOR SECONDARY INTERVENTION PROGRAMME
GEOGRAPHY GRADE 12 SESSION 10 (LEARNER NOTES)
2.4 Look at the illustration below and answer the questions that follow.
2.4.1 What term is given to the pattern of the river? (1 x 2) (2)
2.4.2 Study the pattern made by the river current at X in the illustration. What
do you notice about the position of the current and the river bank that it
is related to? (2 x 2) (4)
[6]
[50]
SECTION C: SOLUTIONS AND HINTS TO SECTION A
QUESTION 1
1.1.1 D √√
1.1.2 A √√
1.1.3 A √√
1.1.4 A √√
1.1.5 C √√ (5 x 2) [10]
1.2.1 Coastal low pressure √√ (1 x 2) (2)
1.2.2 Air descends the plateau √√
Warms adiabatically √√
Subsiding air does not allow for condensation to take place √√
It is dry since it is an offshore wind √√
It decreases atmospheric humidity √√
[Any FOUR. Must refer to temperature and humidity, and use
a diagram] (4 x 2) (8)
[10]
43GAUTENG DEPARTMENT OF EDUCATION SENIOR SECONDARY INTERVENTION PROGRAMME
GEOGRAPHY GRADE 12 SESSION 10 (LEARNER NOTES)
1.3.1 Heat Island√√ (1 x 2) (2)
1.3.2 The angle of the sun‟s rays (aspect) (1 x 2) (2)
1.3.3 Artificial materials like to absorb heat√√
Metals and glass reflect heat√√
Combustion processes√√
Pollution traps long wave radiation√√ (Any THREE) (3 x 2) (6)
1.3.4 During the day the heat dome rises in altitude√√ which allows fresh
clean fresh air to be fed into the city. √√ (2 x 2) (4)
1.3.5 In winter the inversion layer is lower√√ causing pollution to be concentrated√√
close to the ground. In winter more pollution is emitted by the burning of wood
and fossil fuels. √√ (3 x 2) (6)
[20]
1.4
1.4.1 An international convention held in 1997√√ where it was agreed to reduce
greenhouse emissions. 137 countries signed it. √√ (2 x 2) (4)
1.4.2 Reduce the burning of wood and fossil fuels√√
Look at using cleaner fuels such as gas, solar wind power√√
Protect natural environment, especially deforestation√√ (3 x 2) (6)
[10]
1.5
1.5.1 Air that rises near the equator and descends at ±30º from the equator√√
1.5.2 Inter-tropical convergence zone is an area of intense solar heating that moves
north and south with the seasons. √√
1.5.3 Air that warms up as it is compressed√√
1.5.4 When water vapour condenses it releases heat into the atmosphere which
is called latent heat√√
1.5.5 The relationship between the ground and the angle of the sun‟s rays√√
(5 x 2) [10]
[60]
QUESTION 2
2.1
2.1.1 False√√
2.1.2 True√√
2.1.3 True√√
2.1.4 False√√
2.1.5 True√√ (5 x 2) [10]
2.2
2.2.1 The total area drained by the river system √√ [Concept] (1 x 2) (2)
2.2.2 The main river and all its tributaries √√ [Concept] (2 x 1) (2)
[4]
2.3
2.3.1 B – lag time√√
A – peak flow / run-off√√
D – base flow√√ (3 x 2) (6)
2.3.2 Just before 4h00√√ (1 x 2) (2)
2.3.3 Shape of drainage basin caused rising limb to be steep. C is
the rising limb and is increasing rapidly because of the shape
of the drainage basin. √√ D is the falling limb and indicates a
gradual decrease in volume√√ (2 x 2) (4)
44GAUTENG DEPARTMENT OF EDUCATION SENIOR SECONDARY INTERVENTION PROGRAMME
GEOGRAPHY GRADE 12 SESSION 10 (LEARNER NOTES)
2.3.4 Confluence√√ (1 x 2) (2)
2.3.5 Gradient√√
Amount of vegetation√√
Intensity of rainfall√√
Height of water table√√
Rock type√√ (5 x 2) (10)
2.3.6 Situation that develops when a river overflows its banks
and covers areas with water that is usually not covered
by water√√ [Concept] (1 x 2) (2)
[26]
[40]
QUESTION 3
3.1
Hardware √√
Software √√
Data √√
People √√
Procedures √√
Network √√ [Any TWO] (2 x 2) (4)
3.2 Polygon feature:
cultivated land √√
woodland √√
sewage disposal works √√
cemetery √√
slimes dam √√
mine dump √√
Line feature:
built-up area √√
non-perennial river √√
other road √√
national route √√
track/hiking trail √√
Point feature:
railway line √√
fountain √√
trees √√ [Any ONE for each type of feature] (3 x 2) (6)
45GAUTENG DEPARTMENT OF EDUCATION SENIOR SECONDARY INTERVENTION PROGRAMME
GEOGRAPHY GRADE 12 SESSION 10 (LEARNER NOTES)
3.3
3.3.1 The integration of data from different maps into one map which
summarises the overlaying process √√ [Concept] (1 x 2) (2)
3.3.2 Maps have different scales √√
Different map projections are used on maps √√
Different geo-referenced maps are used √√
[Any ONE] (1 x 2) (2)
3.3.3 A summary of integrated data is produced which makes it easier to
analyse data √√ (1 x 2) (2)
3.4 A storage system with linked tables √√
OR
Data is stored in tables which are linked to other tables √√
[Concept] (1 x 2) (2)
3.5
Correct distortions √√
Sharpen definition √√
Ensure colour consistency√√
Correct latitude and longitude registration √√
Makes data more manageable √√ [Any TWO] (1 x 2) (2)
[20]
46GAUTENG DEPARTMENT OF EDUCATION ENIOR SECONDARY INTERVENTION PROGRAMME
GEOGRAPHY GRADE 12 SESSION 11 (LEARNER NOTES)
SESSION 11
TOPICS: CLIMATOLOGY, GEOMORPHOLOGY AND MAPWORK CONSOLIDATION
Learner Note: In the prelim and final papers, the geomorphology section is equally mixed
with climatology in the first two questions in Section A. You really need to know your work
well to get good marks for section A in the final exam. You must also be able to apply
your knowledge as there are some interpretation questions where you also need to
understand the processes involved in geomorphology and climatology. These applications
also apply to the mapwork interpretation. You must put in a lot of effort to get to know this
part of the work well. You must know the facts and you will not get marks for vague
answers. Question 3 is specifically directed at testing your calculation skills.
SECTION A: TYPICAL EXAM QUESTIONS
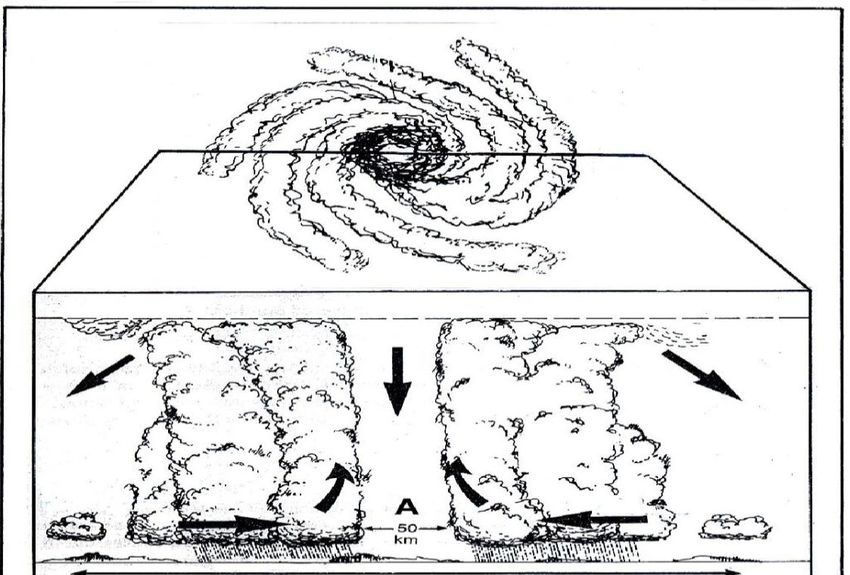
QUESTION 1: 40 minutes 60 marks
(Source: NCS Feb/March 2009 and other past papers)
1.2 Indicate whether the following statements are TRUE or FALSE. Choose
the answer and write only 'true' or 'false' next to the question number
(1.1.1 – 1.1.5).
1.1.1 The anabatic winds blow during the daytime.
1.1.2 The katabatic winds are also known as mountain winds.
1.1.3 The downward flow of wind in a valley is known as anabatic air
flow.
1.1.4 These katabatic winds only occur during cloudy nights.
1.1.5 The heat loss from the earth‟s surface is as a result of terrestrial radiation
(5 x 2) (10)
1.2 Study the synoptic weather chart on the following page (Figure 1.2).
Answer the questions that follow.
47GAUTENG DEPARTMENT OF EDUCATION ENIOR SECONDARY INTERVENTION PROGRAMME
GEOGRAPHY GRADE 12 SESSION 11 (LEARNER NOTES)
Figure 1.2
1.2.1 Describe and account for the wind at the weather station marked A. (5 x 2) (10)
1.2.2 What is the dominant weather system depicted on this synoptic
chart? (1 x 2) (2)
1.2.3 Compare the weather stations at Port Elizabeth and East London.
What are the differences between the two stations? (6 x 1) (6)
1.3 Figure 1.3 depicts a typical South African weather patterns.
Figure 1.3
48GAUTENG DEPARTMENT OF EDUCATION ENIOR SECONDARY INTERVENTION PROGRAMME
GEOGRAPHY GRADE 12 SESSION 11 (LEARNER NOTES)
1.3.1 Name the weather phenomena shown in Figure 1.3. (1 x 2) (2)
1.3.2 During which season do you expect to experience this pattern? (1 x 2) (2)
1.3.3 Explain how this feature is formed. (3 x 2) (6)
1.3.4 What name is given to the band of low pressure that extends across
the South African interior along which line thunderstorms develop? (1 x 2) (2)
1.3.5 Do line thunderstorms develop on the eastern or western side of
the band of low pressure mentioned in QUESTION 1.3.4? (1 x 2) (2)
1.4 The table below indicates the smoke concentration at several South
African cities. Answer the following questions:
URBAN AREA MONTHLY POLLUTION mg/m³
SUMMER WINTER
Johannesburg (central) 0,08 0,195
Johannesburg (suburbs) 0,02 0,08
Pretoria 0,05 0,165
Durban 0,05 0,14
Cape Town 0,035 0,125
East London 0,05 0,125
1.4.1 In which urban area in the RSA does one find:
(a) the highest smoke concentration? (1 x 2) (2)
(b) the lowest smoke concentration? (1 x 2) (2)
1.4.2 Explain the differences in smoke concentration in your answer to
1.4.1(a) and (b) by referring to the relationship between smoke
concentration and the occurrence of a heat island. (3 x 2) (6)
1.4.3 Explain the following statement:
“There is a marked difference between the smoke concentration of all
urban areas in the RSA during the summer and winter months.” (4 x 2) (8)
[60]
QUESTION 2: 30 minutes 52 marks (Source: NCS Feb/March 2009 and various
previous papers)
2.1 Provide suitable definitions for the following:
2.1.1 Abstraction
2.1.2 Incised river
2.1.3 Talus
2.1.4 Soil creep
2.1.5 Slip-off slope (5 x 2) (10)
49GAUTENG DEPARTMENT OF EDUCATION ENIOR SECONDARY INTERVENTION PROGRAMME
GEOGRAPHY GRADE 12 SESSION 11 (LEARNER NOTES)
2.2 Study the diagrams below and answer the questions that follow:
Figure 2.2
2.2.1 With what type of underlying geological structure and rock are A, B and C
associated? (2 x 2) (4)
2.2.2 Identify the three landforms indicated by A, B and C respectively. (3 x 2) (6)
2.2.3 Identify ONE factor that influences the infiltration of water. (1 x 2) (2)
2.3 Study FIGURE 2.3 based on fluvial processes and drainage basins.
After heavy rainfall in this drainage basin, the river will not reach its
discharge peak immediately. This difference in time between the
rainfall peak and the discharge peak is known as the lag time.
Figure 2.3
50GAUTENG DEPARTMENT OF EDUCATION ENIOR SECONDARY INTERVENTION PROGRAMME
GEOGRAPHY GRADE 12 SESSION 11 (LEARNER NOTES)
2.3.1 Identify the drainage patterns at D and E respectively. (2 x 2) (4)
2.3.2 Give ONE example of a natural feature that will restrict the river‟s
discharge. (1 x 2) (2)
2.3.3 Give ONE example of a man-made feature that will restrict the
river's discharge. (1 x 2) (2)
2.3.4 Suggest TWO positive effects that the deciduous woodland (forest)
is likely to have on the catchment area. (2 x 2) (4)
2.3.5 Explain why there is a lag time between peak rainfall and peak
discharge. (2 x 2) (4)
2.3.6 Where, at station A or station B, will the lag time be longer? (1 x 2) (2)
2.3.7 Explain your answer to QUESTION 2.3.6. (1 x 2) (2)
2.4 Rocks have different types of strata which give rise to unique landforms.
Use FIGURE 2.4 to observe some of these landforms and answer the
questions that follow.
2.4.1 Identify the features (landforms) labelled E and F. (2 x 2) (4)
2.4.2 Give ONE difference between feature (landform) E and F. (1 x 2) (2)
2.4.3 Of what value is this landscape to man? Give TWO reasons.
(2 x 2) (4)
[52]
Figure 2.4
51GAUTENG DEPARTMENT OF EDUCATION ENIOR SECONDARY INTERVENTION PROGRAMME
GEOGRAPHY GRADE 12 SESSION 11 (LEARNER NOTES)
QUESTION 3 20 minutes 20 marks
(Source: Adapted exercise Senior Geography Grade 12)
This question is aimed at testing your calculation capabilities in mapwork. Most learners
lose the majority of their marks in the calculation section of the mapwork paper (Paper 2).
Refer to the 1: 50 000 topographical map of Harrismith, and answer the questions that
follow:
MN TN The mean magnetic declination is 22º48‟W of true north
(July 2002)
Mean annual change 12‟E
3.1 Calculate the straight line distance from A (D2) to Δ299 (D3), in km. (2)
3.2 Determine the bearing from E (A4) to •1747(E3). (2)
3.3. Determine the current magnetic bearing from E (A4) to •1747 (E3). Show all
calculations. (8)
3.4 Calculate the area of the map, in km². Show all calculations. (5)
3.5 What is the gradient from •1721(B4) to Δ299 (D3). (3)
[20]
52GAUTENG DEPARTMENT OF EDUCATION ENIOR SECONDARY INTERVENTION PROGRAMME
GEOGRAPHY GRADE 12 SESSION 11 (LEARNER NOTES)
53GAUTENG DEPARTMENT OF EDUCATION ENIOR SECONDARY INTERVENTION PROGRAMME
GEOGRAPHY GRADE 12 SESSION 11 (LEARNER NOTES)
SECTION B: HOMEWORK
QUESTION 1: 30 minutes 40 marks (Source: NCS grade 12 November 2010 and
other previous papers)
1.1 Choose the correct alternative. Write only the question number and letter:
1.1.1 The movement of air towards a low pressure is called:
A divergence
B adiabatic
C anabatic
D convergence
1.1.2 The atmospheric cell found on either side of the equator is the:
A Ferrel cell
B mid-latitude cell
C tropical cyclone
D Hadley cell
1.1.3 The ITCZ is the convergence of:
A polar easterlies
B westerlies
C tropical westerlies
D tropical easterlies
1.1.4 Winds that converge at the polar front are:
A westerlies and tropical easterlies
B polar easterlies and westerlies
C polar westerlies and easterlies
D polar easterlies and tropical westerlies
1.1.5 The anticlockwise change in direction of wind with the passing of a mid-
latitude cyclone over Cape Town is called:
A backing
B veering
C converging
D rotating (5 x 2) (10)
54You can also read