The Covid-19 pandemic in Africa - Putting South Africa into African perspective (as on 16 June 2020)
←
→
Page content transcription
If your browser does not render page correctly, please read the page content below

The Covid-19
   pandemic in Africa
Putting South Africa into African perspective
           (as on 16 June 2020)

          © Prof Bärbel B Haldenwang
                  June 2020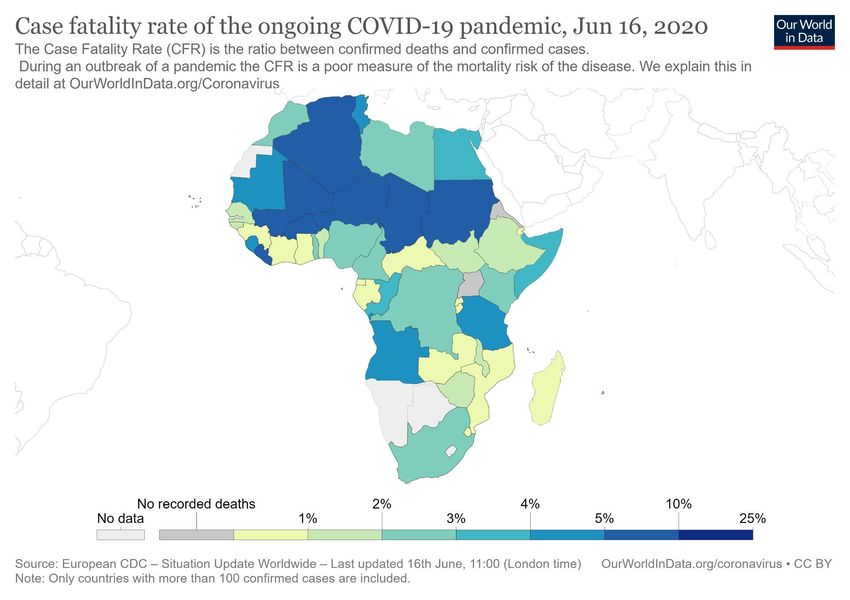
Introduction
This is an update of the presentations published on 24 Apr 2020 and 22 May 2020. In
addition to South Africa, Egypt, Nigeria, Algeria, Ghana and Morocco, Cameroon is
included in this analysis because it now ranks amongst the 7 hardest hit countries on
the continent.

In addition, provincial data for South Africa is updated as far as data is available.
Please note that detailed Covid-19 data is currently only published on a daily basis by
the Western Cape. Some Covid-19 models and projections for South Africa are also
included.
Outline
• Covid-19 pandemic in Africa as on 16 June 2020
• Covid-19 epidemic in South Africa as on 16 June 2020
• How does the Covid-19 epidemic in South Africa compare to those in other African countries, such Egypt,
  Nigeria, Ghana, Algeria, Cameroon and Morocco?
• Comparison of Covid-19 pandemic indicators between South Africa and the most severely hit African
  countries (16 June 2020)
• Comparison of Covid-19 pandemic development over time between South Africa and the most severely hit
  African countries
• What would happen to the Covid-19 pandemic in Africa under various doubling time estimates?
• What would happen to the Covid-19 epidemic in South Africa under various doubling time estimates?
• Where are the critical areas (hotspots) in South Africa?
• Covid-19 models and projections for South Africa
• Concluding remarks
Covid-19 pandemic
     in Africa
    as on 16 June 2020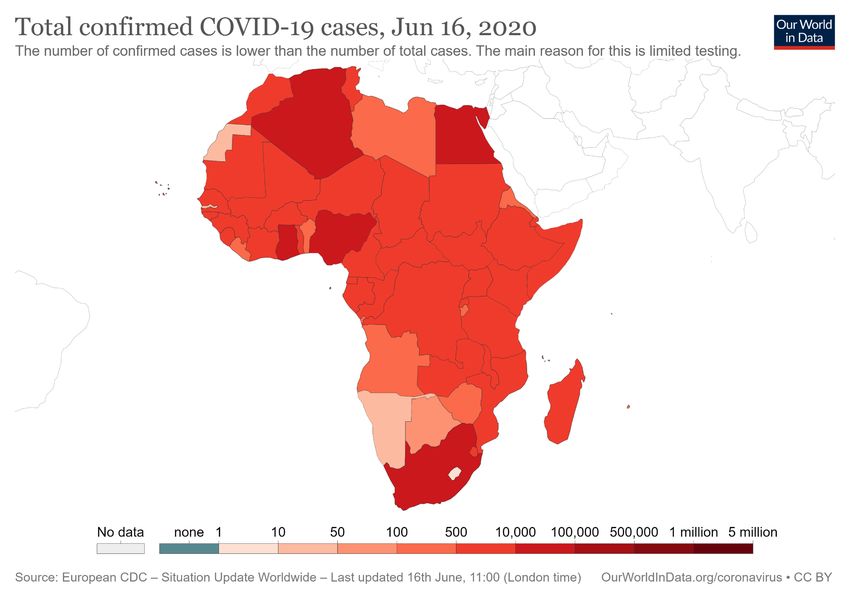
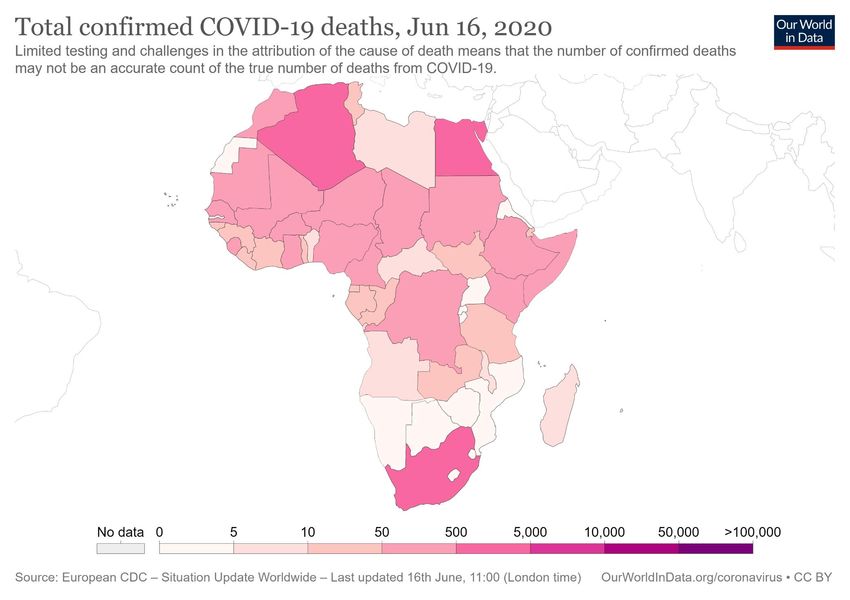
Covid-19 pandemic in Africa
                                 Number of deaths as on 16 June 2020: 6 760

Source: Compiled from Our World in Data, 2020.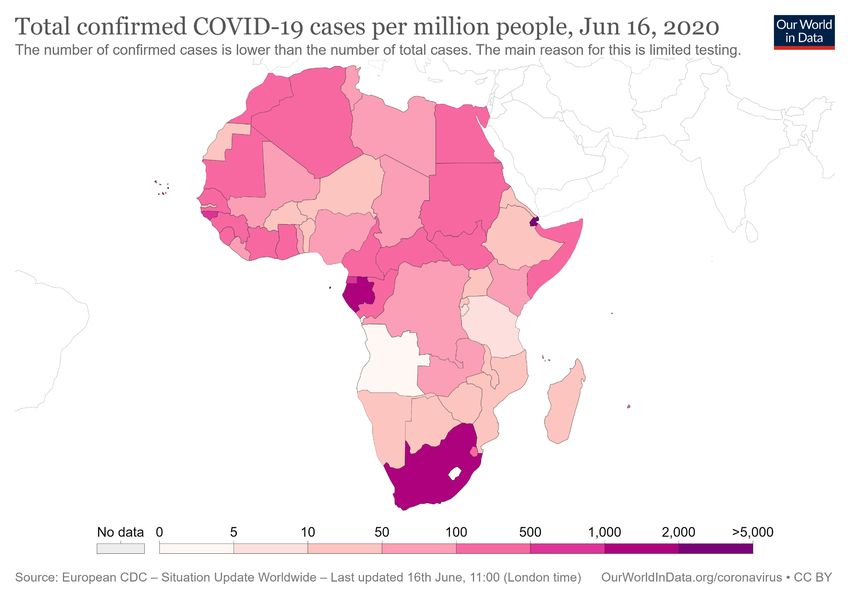
Africa Covid-19 pandemic
       situation as on 16.6.2020
   •   First Covid-19 case detected: 15 Feb 2020, about 2
       months after it was first detected in China
   •   Cumulative number of infected people: 251 277
       (3.1% of world infected total vs 17.2% of world
       population)
   •   Covid-19 infection rate: 0.187 per 1000 population
   •   Total number of deaths: 6 760 or 2.7% of infected
       people (1.5% of world total)
   •   Covid-19 crude death rate: 0.005 deaths per 1000
       population
   •   Influenza/pneumonia death rate: n/a
   •   Overall crude death rate: 8.2 deaths per 1000
       population
   •   Number of people recovered from Covid-19: n/a
   •   Number of tests done: n/a
   •   The infection curve is still rising rather rapidly
   •   The death curve continues to rise steadily

Sources: Compiled from Our World in Data 2020; UN, 2019 (World Population Prospects, 2019 Revision); WHO, 2018 Mortality Database.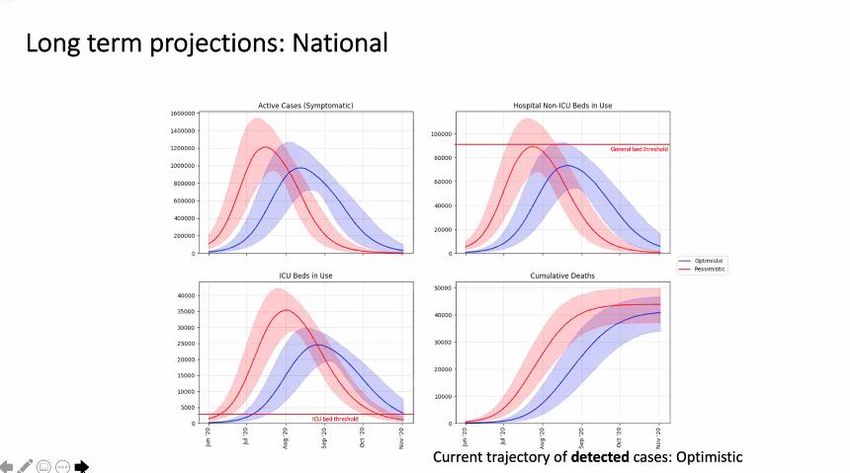
Covid-19 epidemic
 in South Africa
  as on 16 June 2020
• The first case of Covid-19 in SA was reported
  on 5 March 2020
• Since then the number of daily confirmed
  cases of Covid-19 increased steadily, reaching
  a first peak of 243 cases reported on 27 March
  2020
• Since lockdown started on 27 March the daily
  number of confirmed cases initially declined
  and fluctuated at a relatively low level (
Average daily number of Covid-19 cases per week
• Prior to the national lockdown, the
  average daily number of new confirmed
  Covid-19 cases per week increased
  rapidly from 2 to 111
• Just after lockdown commenced, the
  average daily number of new cases per
  week declined to 67
• However, since the 3rd week of lockdown
  the average daily number of new cases
  started increasing again, gaining
  momentum during Stage 4 of the national
  lockdown and increasing very rapidly
  during the past three weeks of Stage 3 of
  the national lockdown, reaching a peak of
  an average of 3 560 new cases per day
  in the past 5 days
• This is a reflection of significantly more
  tests being conducted since mid-April –
  the more tests done, the more Covid-19
  cases will be registered
Source: Calculated from Johns Hopkins Coronavirus Resource Centre, 2020.
Percentage of tests that are positive
• According to Prof Salim S Abdool Karim,
  Chair of the Ministerial Advisory Group
  on Covid-19, ‘a better measure to use is
  the percentage of tests that are positive’
• This rate has stayed relatively stable at
  about 2.7-2.9% between mid-April and
  early May
• However, since mid-May with the relaxing
  of the lockdown regulations, the rate
  started increasing rather rapidly, reaching
  6.5% on 16 June
• This means that currently about 6.5 out
  of every 100 Covid-19 tests done result
  in a positive test result
• It is expected that this percentage will
  continue to increase since the peak of
  the epidemic has not yet been reached

Sources: Calculated from Johns Hopkins Coronavirus Resource Centre, 2020; Malan, 8 May 2020.
• On a cumulative basis, the number of
  confirmed Covid-19 cases in SA has
  increased to 76 334 as on 16 June 2020, 103
  days since the first case was detected
• Did the lockdown (stage 5) have an impact on
  the number of confirmed Covid-19 cases?
• The initial rapid growth in the number of
  confirmed cases was slowed down by the
  lockdown but only for the first 2-3 weeks, after
  which the number of confirmed cases started
  increasing
• What has happened since stages 4 and 3 of
  the lockdown commenced?
• The number of confirmed Covid-19 cases
  started to increase exponentially as generally
  expected by epidemiologists
• 66 days after the first case was confirmed, SA
  had 10 000 confirmed cases; 12 days later
  20 000 cases, 8 days later 30 000 cases; 5
  days later 40 000 cases; 4 days later 50 000
  cases; 3 days later 60 000 cases; and
  another 3 days later 70 000 cases
                                                                         Number of deaths as on 16 June 2020: 1 625
Source: Compiled from Johns Hopkins Coronavirus Resource Centre, 2020.
South Africa Covid-19 epidemic
situation as on 16.6.2020 Cumulative number of confirmed Covid-19 cases,
deaths and recoveries in SA
• First Covid-19 case detected: 5 Mar 2020 (log scale on vertical axis)
• Cumulative number of infected people: 76 334 of which 42.8% are
active cases (30.4% of Africa’s infected total)
• Covid-19 infection rate: 1.287 per 1000 population
• Total number of deaths: 1 625 or 2.1% of infected people (24.0% of
Africa’s death total)
• Covid-19 crude death rate: 0.027 deaths per 1000 population
• Influenza/pneumonia death rate: 0.320 per 1000 population
• Overall crude death rate (all causes): 9.5 deaths per 1000 population
• Number of people recovered from Covid-19: 42 063 or 55.1% of
infected people
• Number of tests done: 1 172 513 or 19 780 per 1m population
• Percentage of tests done that are positive: 6.5%
• The infection curve has initially slowed down after lockdown but
continues to rise rather rapidly
• The number of deaths are increasing although the number of deaths
are still small compared to other countries
• The number of recoveries are increasing steadily and significantly
outnumber the number of deaths
• The active cases curve is slightly below the recoveries curve with
recoveries exceeding active cases
Sources: Compiled from Johns Hopkins Coronavirus Resource Centre, 2020; TradingView, 2020; UN, 2019 (World Population Prospects, 2019 Revision); WHO, 2018
Mortality Database; Worldometer, 2020.How does the Covid-19 epidemic
in South Africa compare to those
in other African countries?
Egypt, Nigeria, Ghana, Algeria, Cameroon and MoroccoCovid-19 epidemic in Egypt
Number of deaths as on 16 June 2020: 1 766
Source: Compiled from Johns Hopkins Coronavirus Resource Centre, 2020.Egypt Covid-19 epidemic
situation as on 16.6.2020
• First Covid-19 case detected: 14 Feb 2020
• Cumulative number of infected people: 47 856 of which 69.7%
are active cases (19.1% of Africa’s infected total)
• Covid-19 infection rate: 0.468 per 1000 population
• Total number of deaths: 1 766 or 3.7% of infected people (26.1%
of Africa’s death total)
• Covid-19 crude death rate: 0.017 deaths per 1000 population
• Influenza/pneumonia death rate: 0.161 per 1000 population
• Overall crude death rate: 5.8 deaths per 1000 population
• Number of people recovered from Covid-19: 12 730 or 26.6% of
infected people
• Number of tests done: 135 000 or 1 323 per 1m population (as
on 15.5.2020)
• Percentage of tests done that are positive: 35.4%
• The infection curve is still rising rapidly
• The death curve is still rising
• The recovery curve is above the death curve, ie, more
recoveries than deaths
• The active cases curve is still rising steadily and close to the
infection curve with 70% of infections being active cases
Sources: Compiled from Johns Hopkins Coronavirus Resource Centre, 2020; TradingView, 2020; UN, 2019 (World Population Prospects, 2019
Revision); WHO, 2018 Mortality Database; Worldometer, 2020.Covid-19 epidemic in Nigeria
Number of deaths as on 16 June 2020: 455
Source: Compiled from Johns Hopkins Coronavirus Resource Centre, 2020.Nigeria Covid-19 epidemic
situation as on 16.6.2020
• First Covid-19 case detected: 28 Feb 2020
• Cumulative number of infected people: 17 148 of which 64.6%
are active cases (6.8% of Africa’s infected total)
• Covid-19 infection rate: 0.083 per 1000 population
• Total number of deaths: 455 or 2.7% of infected population
(6.7% of Africa’s death total)
• Covid-19 crude death rate: 0.002 deaths per 1000 population
• Influenza/pneumonia death rate: n/a
• Overall crude death rate: 12.0 deaths per 1000 population
• Number of people recovered from Covid-19: 5 623 or 32.8% of
infected people
• Number of tests done: 96 402 or 468 per 1m population
• Percentage of tests done that are positive: 17.8%
• The infection curve is rising steadily
• The death curve continues to rise but at a very low level
• The recovery curve is rising rapidly with recoveries exceeding
deaths
• The active cases curve is still rising with 65% of infections
being active cases
Sources: Compiled from Johns Hopkins Coronavirus Resource Centre, 2020; TradingView, 2020; UN, 2019 (World Population Prospects, 2019
Revision); WHO, 2018 Mortality Database; Worldometer, 2020.Covid-19 epidemic in Ghana
Number of deaths as on 16 June 2020: 58
Source: Compiled from Johns Hopkins Coronavirus Resource Centre, 2020.Ghana Covid-19 epidemic
situation as on 16.6.2020
• First Covid-19 case detected: 14 Mar 2020
• Cumulative number of infected people: 12 193 of which 64.0% are
active cases (4.9% of Africa’s infected total)
• Covid-19 infection rate: 0.392 per 1000 population
• Total number of deaths: 58 or 0.5% of infected people (0.9% of
Africa’s death total)
• Covid-19 crude death rate: 0.002 deaths per 1000 population
• Influenza/pneumonia death rate: n/a
• Overall crude death rate: 7.3 deaths per 1000 population
• Number of people recovered from Covid-19: 4 326 or 35.5% of
infected people
• Number of tests done: 255 971 or 8 246 per 1m population
• Percentage of tests done that are positive: 4.8%
• The infection curve is slowly flattening
• The death curve is flattening at a very low level
• The recovery curve continues to rise
• The active cases curve is slightly below the infection curve, with
active cases outnumbering recoveries
Sources: Compiled from Johns Hopkins Coronavirus Resource Centre, 2020; TradingView, 2020; UN, 2019 (World Population Prospects, 2019
Revision); WHO, 2018 Mortality Database; Worldometer, 2020.Covid-19 epidemic in Algeria
Number of deaths as on 16 June 2020: 788
Source: Compiled from Johns Hopkins Coronavirus Resource Centre, 2020.Algeria Covid-19 epidemic
situation as on 16.6.2020
• First Covid-19 case detected: 25 Feb 2020
• Cumulative number of infected people: 11 147 of which 22.6% are
active cases (4.4% of Africa’s infected total)
• Covid-19 infection rate: 0.254 per 1000 population
• Total number of deaths: 788 or 7.1% of the infected population
(11.7% of Africa’s death total)
• Covid-19 crude death rate: 0.018 deaths per 1000 population
• Influenza/pneumonia death rate: n/a
• Overall crude death rate: 4.7 deaths per 1000 population
• Number of people recovered from Covid-19: 7 842 or 70.3% of
infected people
• Number of tests done: n/a
• Percentage of tests done that are positive: n/a
• The infection curve is flattening
• The death curve is flattening
• The recovery curve is rising rapidly, closing in on the infection
curve
• The active cases curve is bending downwards, with significantly
more recoveries than active cases
Sources: Compiled from Johns Hopkins Coronavirus Resource Centre, 2020; TradingView, 2020; UN, 2019 (World Population Prospects, 2019
Revision); WHO, 2018 Mortality Database; Worldometer, 2020.Covid-19 epidemic in Cameroon
Number of deaths as on 16 June 2020: 276
Source: Compiled from Johns Hopkins Coronavirus Resource Centre, 2020.Cameroon Covid-19 epidemic
situation as on 16.6.2020
• First Covid-19 case detected: 6 Mar 2020
• Cumulative number of infected people: 9 864 of which 40.7% are
active cases (3.9% of Africa’s infected total)
• Covid-19 infection rate: 0.372 per 1000 population
• Total number of deaths: 276 or 2.8% of the infected population
(4.1% of Africa’s death total)
• Covid-19 crude death rate: 0.010 deaths per 1000 population
• Influenza/pneumonia death rate: n/a
• Overall crude death rate: 9.4 deaths per 1000 population
• Number of people recovered from Covid-19: 5 570 or 56.5% of
infected people
• Number of tests done: n/a
• Percentage of tests done that are positive: n/a
• The infection curve is still rising
• The death curve has flattened at a very low level
• The recovery curve is rising steadily
• The active cases curve is below the recoveries curve, with
recoveries outnumbering active cases
Sources: Compiled from Johns Hopkins Coronavirus Resource Centre, 2020; TradingView, 2020; UN, 2019 (World Population Prospects, 2019
Revision); WHO, 2018 Mortality Database; Worldometer, 2020.Covid-19 epidemic in Morocco
Number of deaths as on 16 June 2020: 212
Source: Compiled from Johns Hopkins Coronavirus Resource Centre, 2020.Morocco Covid-19 epidemic
situation as on 16.6.2020
• First Covid-19 case detected: 2 Mar 2020
• Cumulative number of infected people: 8 931 of which only 8.7%
are active cases (3.6% of Africa’s infected total)
• Covid-19 infection rate: 0.242 per 1000 population
• Total number of deaths: 212 or 2.4% of the infected population
(3.1% of Africa’s death total)
• Covid-19 crude death rate: 0.006 deaths per 1000 population
• Influenza/pneumonia death rate: 0.023 per 1000 population
• Overall crude death rate: 5.1 deaths per 1000 population
• Number of people recovered from Covid-19: 7 937 or 88.9% of
infected people
• Number of tests done: 455 768 or 12 354 per 1m population
• Percentage of tests done that are positive: 2.0%
• The infection curve has flattened
• The death curve has flattened at a very low level
• The recovery curve is very close to the infections curve with 89%
of infected people recovered
• The active cases curve is bending downwards with recoveries
significantly exceeding active cases
Sources: Compiled from Johns Hopkins Coronavirus Resource Centre, 2020; TradingView, 2020; UN, 2019 (World Population Prospects, 2019
Revision); WHO, 2018 Mortality Database; Worldometer, 2020.Comparison of Covid-19
pandemic indicators
between South Africa
and the most severely hit
African countries
as on 16 June 2020Covid-19 pandemic indicators: Comparison between South Africa,
Egypt, Nigeria, Ghana, Algeria, Cameroon and Morocco (16.6.2020)
Covid-19 indicator South Egypt Nigeria Ghana Algeria Cameroon Morocco Africa
Africa
No of infections 76 334 47 856 17 148 12 193 11 147 9 864 8 931 251 277
% of all Covid-19 infections in Africa 30.4 19.1 6.8 4.9 4.4 3.9 3.6
% of cases that are active 42.8 69.7 64.6 64.0 22.6 40.7 8.7
Infection rate (per 1000 population) 1.287 0.468 0.083 0.392 0.254 0.372 0.242 0.187
No deaths 1 625 1 766 455 58 788 276 212 6 760
% of all Covid-19 deaths in Africa 24.0 26.1 6.7 0.9 11.7 4.1 3.1
Covid-19 death rate (per 1000 population 0.027 0.017 0.002 0.002 0.018 0.010 0.006 0.005
Case fatality rate (deaths per 100 infections) 2.1 3.7 2.7 0.5 7.1 2.8 2.4 2.7
Number recovered 42 063 12 730 5 623 4 326 7 842 5 570 7 937 n/a
Recovery rate (% of infected that recovered) 55.1 26.6 32.8 35.5 70.3 56.5 88.9
Number of tests done 1 172 513 135 000 96 402 255 971 n/a n/a 455 768 n/a
Tests per 1m population 19 780 1 323 468 8 246 n/a n/a 12 354 n/a
Percentage of tests that are positive 6.5 35.4 17.8 4.8 n/a n/a 2.0
Sources: Compiled from Johns Hopkins Coronavirus Resource Centre, 2020; TradingView, 2020; UN, 2019 (World Population Prospects, 2019 Revision); WHO, 2018 Mortality
Database; Worldometer, 2020.Ranking of worst hit African countries by number of
Covid-19 infections and infection rates (16 June 2020)
Source: Compiled from Johns Hopkins Coronavirus Resource Centre, 2020.Ranking of worst hit African countries by number of Covid-19
deaths and Covid-19 death rates (16 June 2020)
Source: Compiled from Johns Hopkins Coronavirus Resource Centre, 2020.Ranking of worst hit African countries by Covid-19 case
fatality rates and recovery rates (16 June 2020)
Source: Compiled from Johns Hopkins Coronavirus Resource Centre, 2020.Ranking of worst hit African countries by number of tests
done and tests per million population (16 June 2020)
Source: Compiled from Johns Hopkins Coronavirus Resource Centre, 2020.% distribution of confirmed Covid-19 % distribution of Covid-19 deaths for
infections for various African countries, various African countries,
16 June 2020 16 June 2020
Source: Compiled from Johns Hopkins Coronavirus Resource Centre, 2020.Cumulative number of confirmed Covid-19 cases for
various African countries
• The Covid-19 pandemic reached Africa mid-Feb 2020,
with the first infections confirmed in Egypt, Morocco
and South Africa
• Currently, South Africa and Egypt have the largest
numbers of infections, followed by Nigeria, Ghana,
Algeria, Cameroon and Morocco but the pandemic has
reached every African country
• About 31% of Covid-19 infections are currently found
in other African countries
Source: Compiled from Johns Hopkins Coronavirus Resource Centre, 2020.Comparison of Covid-19
pandemic development
over time between South Africa
and the most severely hit
African countriesCumulative number of confirmed Covid-19 cases
by African country over time
Source: Compiled from Johns Hopkins Coronavirus Resource Centre, 2020.Cumulative number of confirmed Covid-19 cases
by African country over time
(log scale on vertical axis)
Source: Compiled from Johns Hopkins Coronavirus Resource Centre, 2020.Cumulative number of active Covid-19 cases
by African country over time
Source: Compiled from Johns Hopkins Coronavirus Resource Centre, 2020.Covid-19 infection rate
by African country over time
Source: Compiled from Johns Hopkins Coronavirus Resource Centre, 2020.Cumulative number of Covid-19 deaths
by African country over time
Source: Compiled from Johns Hopkins Coronavirus Resource Centre, 2020.Covid-19 death rate
by African country over time
Source: Compiled from Johns Hopkins Coronavirus Resource Centre, 2020.Cumulative number of Covid-19 recoveries
by African country over time
Source: Compiled from Johns Hopkins Coronavirus Resource Centre, 2020.What could happen
to the Covid-19 pandemic
in Africa
under various doubling times?Doubling times of Covid-19 infections in Africa,
South Africa, Egypt, Nigeria, Ghana, Algeria, Cameroon and Morocco
For the infection curve to flatten at the top, the doubling
time in infections has to increase or lengthen in days
Sources: Own calculations based on data from Johns Hopkins Coronavirus Resource Centre, 2020; Our World in Data, 2020.Various Covid-19 doubling time estimates
• Africa still has a relatively small number of
confirmed Covid-19 infections compared to
Europe and the USA, but the infection curve is
rising rather rapidly, and the number of people
tested still very low
• Should the doubling time remain at the current 19
days, 1.59m would be infected by 8 Aug 2020
• BUT what if the doubling time would decline to
17, 15 or 13 days as the pandemic spreads
throughout the continent and into communities?
• At a 17-day doubling time, 1.89m would be
infected by 8 Aug 2020
• At a 15-day doubling time, 2.55m would be
infected by 8 Aug 2020
• At a 13-day doubling time (similar to the current
doubling time of SA), 3.56m would be infected by
8 Aug 2020
• It is therefore of the utmost importance that the
doubling time remains high to prevent an
exponential growth in new cases on the continent
• However, should the doubling time continue to
increase, eg to 21 days, 1.34m would be infected
by 8 Aug 2020
Source: Own calculations.What could happen to
the Covid-19 epidemic
in South Africa
under various doubling times?Various Covid-19 doubling time estimates
• South Africa has the highest number of infections on the African
continent and the number of confirmed cases has increased very
rapidly during the past 3 weeks. The doubling time of infections
has remained at 12-13 days since early May. As more people are
being screened and tested and as the epidemic spreads into the
community, the number of infections is expected to start rising
exponentially
• Should the doubling time remain at the current 13 days, 1.07m
would be infected by 8 Aug 2020
• BUT what if the doubling time would decline to 11 or 9 days as
more people are being tested and the epidemic spreads into the
community?
• At an 11-day doubling time, 1.78m would be infected by 8 Aug 2020
• At a 9-day doubling time, 3.53m would be infected by 8 Aug 2020
• OR what if the doubling time starts to increase to 15 or 17 days?
• At a 15-day doubling time, 774 000 would be infected by 8 Aug
2020
• At a 17-day doubling time, 575 000 would be infected by 8 Aug
2020
• It is therefore of the utmost importance that the doubling time
starts rising again to prevent an even more rapid growth in new
cases than in the past couple of weeks
Source: Own calculations.Where are the critical areas (or hotpots) in South Africa?
Number of Covid-19 cases and
•   Currently, 59% (or 45 357) of all confirmed
                                                        deaths by province, 16.6.2020
    Covid-19 cases are in the Western Cape,
    followed by Gauteng with 17% (or 13 023                             Covid-19 cases       Covid-19       Recove-    Case      Recove-
    cases) and the Eastern Cape with 15% (or            Provence
                                                                                              deaths          ries    fatality    ry rate
    11 039 cases)                                                                                                       rate
•   The Western Cape also has the largest number                        Number     %      Number        %   Number       %
    of Covid-19 deaths (74% of all deaths), followed
                                                        Eastern Cape    11 039    14.5     245      15.1     5 475      2.2        49.6
    by the Eastern Cape (15%)
•   Currently, the highest case fatality rate (deaths   Free State       578       0.8      9       0.6       222       1.6        38.4
    per 100 infections) is in the Western Cape and      Gauteng         13 023    17.1      87      5.4      3 442      0.7        26.4
    Eastern Cape, while the highest recovery rate
    (67%) is also in the Western Cape                   KwaZulu-Natal    4 048     5.3      73      4.5      2 133      1.8        52.7

•   The Cape Town, greater Johannesburg and             Limpopo          391       0.5      4       0.2       213       1.0        54.5
    Ekurhuleni metropolitan areas with high
    population densities especially in informal         Mpumalanga       343       0.4      1       0.06      138       0.3        40.2
    settlements where poverty levels, TB and HIV
                                                        North West       1 281     1.7      5       0.3       152       0.4        11.9
    prevalence are high, are most at risk of rapid
    community transmissions                             Northern Cape    211       0.3      1       0.06      52        0.5        24.6
•   In addition, infections are expected to spread      Western Cape    45 357    59.4     1 200    73.8    30 236      2.6        66.7
    rapidly in old-age care centres, schools,
    hospitals, shopping malls, etc                      Unknown           63       0.1      0       0.0        0        0.0        0.0

                                                        South Africa    76 334    100.0    1 625   100.0    42 063      2.1        55.1
Source: National Health Laboratory Service, 2020.
Cumulative number of Covid-19 cases,
deaths, recoveries and active cases by
province, 16.6.20
[Please note that the vertical axes differ between the graphs due
to the large differences in infections between the provinces]
Source: Compiled from National Health Laboratory Service, 2020.Covid-19 tests by province,
29.5.2020
• It is argued that the main reason for the high
number of Covid-19 infections in the Western
Cape is the large number of tests being
conducted
• In absolute numbers, Gauteng leads with 223 393
tests having been conducted as on 29.5.2020,
followed by the Western Cape (153 674) and
KwaZulu-Natal (113 968)
• However, relative to the population size, the
Western Cape leads by far with 22 453 tests per
1m population, followed by Gauteng (14 720) and
the Free State (12 511) as on 29.5.2020
• In the more rural provinces such as the Northern
Cape, Limpopo, Mpumalanga and North West,
the numbers of Covid-19 infections are still
small, which could be as a result of low numbers
of tests being conducted
Source: Compiled from BusinessTech, 29 May 2020.Covid-19 epidemic in the Western Cape
Number of deaths as on 16 June 2020: 1 205
Source: Compiled from Western Cape Government Covid-19 Dashboard, 2020.Western Cape Covid-19 epidemic situation
as on 16.6.2020 (Age distribution)
• 27% of all confirmed Covid-19 infections in the Western Cape
are aged 31-40 years, followed by 21.5% aged 21-30 years and
20.4% aged 41-50 years, whereas the highest age groups have
the lowest numbers of Covid-19 infections
• However, the highest number of deaths (26.5% of all deaths)
are aged 51-60 years, closely followed by those aged 61-70
(25.8%)
• Although the numbers of Covid-19 infections and Covid-19
deaths amongst the older people in the Western Cape are still
relatively low, the highest case fatality rate (number of deaths
per 100 infections) is amongst those aged 71-80 years (ie,
17.3%), followed by those aged >80 years (13.2%) and those
aged 61-70 years (13.1%)
• How does the age distribution of Covid-19 infections compare
to the age distribution of the Western Cape population?
Age group WC population Covid-19 cases
21-30 17.3% 21.5%
31-40 18.2% 27.0%
41-50 12.8% 20.4%
51-60 9.7% 14.2%
Sources: Compiled from Western Cape Government Covid-19 Dashboard, 2020; StatsSA, 2019.City of Cape Town Covid-19 epidemic situation
as on 16.6.2020
• 80% of all confirmed Covid-19 cases in the Western
Cape are in the City of Cape Town, home to 65% of the
provincial population
• Of the 36 647 confirmed Covid-19 cases in the City of
Cape Town, 17.5% are in Tygerberg, 15.0% in Khayelitsha
and 13.4% in Klipfontein
• The Northern suburbs currently have the lowest number
of confirmed Covid-19 infections
Source: Compiled from Western Cape Government Covid-19 Dashboard, 2020.Covid-19 epidemic in Gauteng,
14.6.2020
District Covid-19 cases Recoveries Deaths
Johannesburg 3 546 1 558
Ekurhuleni 1384 660
Tshwane 960 376
Sedibeng 162 56
West Rand 627 240
Unallocated 516 0
Total 7 195 2890 57
• Gauteng has the second highest number of Covid-19 infections in South Africa, but only
57 deaths as on 14.6.2020
• 49% of cases in Gauteng are found in Johannesburg, followed by Ekurhuleni with 19%
Source: Compiled from Daily Maverick Daily Digest #75, 15.6.2020.Covid-19 epidemic in Eastern Cape,
14.6.2020
District Covid-19 cases Recoveries Deaths
Alfred Nzo 121 0
Amathole 540 6
Buffalo City Metro 2 175 30
Chris Hani 1 251 27
Joe Gqabi 151 1
Nelson Mandela Bay Metro 1 076 79
OR Tambo 1 364 46
Sarah Baartman 277 15
Imported cases 178 0
Total 8 615 4 393 208
• Eastern Cape has the third highest number of Covid-19 infections and the second highest
number of Covid-19 deaths in South Africa as on 14.6.2020
• 25% of cases in the Eastern Cape are found in Buffalo City metro and 16% in OR Tambo district
Source: Compiled from Daily Maverick Daily Digest #75, 15.6.2020.Hardest hit areas(hotspots) People most at risk
in South Africa of Covid-19
• Older persons, especially those living
• Western Cape: City of Cape Town, in old-age homes and frail care
especially areas such as Tygerberg, centres
Khayelitsha, Klipfontein • People with pre-existing medical
• Gauteng: Johannesburg, especially areas conditions such as diabetes,
such as Alexandra, Wynberg, Sandton hypertension, cardiovascular
disease, immune deficiencies,
• Gauteng: Ekurhuleni metro
chronic respiratory illness, blood
• Eastern Cape: Nelson Mandela Bay metro cancer, lung cancer
• Eastern Cape: Buffalo City • Mortality rises with age and with
• KwaZulu-Natal: eThekwini metro underlying medical conditions
• KwaZulu-Natal: iLembe District • People living in densely populated
areas• More females than males in SA have Covid-19 • Highest % of deaths in SA are amongst those
• Highest % of infections are amongst those aged 60-69 years and 50-59 years
aged 30-34 years and 35-39 years • Slightly more males than females die of Covid-
• Almost 50% of all cases are aged 25-49 years 19 (51% vs 49%)
Age and gender distribution of Covid-19
cases in SA, 28.5.2020
Age
80+
75-79
70-74
65-69
60-64
55-59
50-54
45-49
40-44
35-39
30-34
25-29
20-24
15-19
10-14
5-9
0-4
% Male % Female
Sources: Compiled from Business Tech, 29.5.2020; National Health Laboratory Service, 15 June 2020.Covid-19 models and projections for South Africa
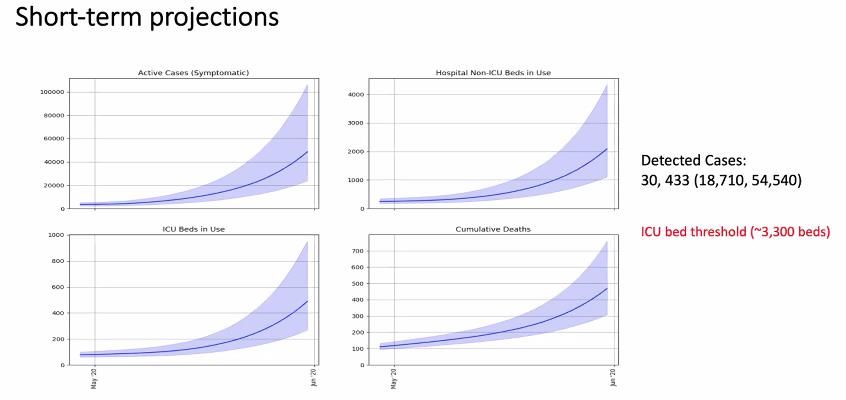
Covid-19 projections by government
       A team of scientific experts and the Dept of Health presented some Covid-19
       projections (pessimistic and optimistic scenarios) on 19 May. The underlying
       assumptions are as follows:

Source: BusinessTech, 19.5.2020.
• Short-term projections (for end of May):
• number of detected Covid-19 cases: 30 433 (ranging between 18 710 and 54 540) [Actual number as on
31.5.2020: 32 683 confirmed cases]
• number of Covid-19 deaths: 475 (ranging between 300 and 700) [Actual number as on 31.5.2020: 683 deaths]
Source: BusinessTech, 19.5.2020.• Long-term projections (until Nov):
• number of active Covid-19 cases (optimistic scenario): peak at 1m (ranging between 0.7m and 1.2m) in Aug
• number of active Covid-19 cases (pessimistic scenario): peak at 1.2m (0.95m and 1.5m) in mid-Jul
• number of Covid-19 deaths (optimistic scenario): 40 000 by Nov
• number of Covid-19 deaths (pessimistic scenario): 48 000 by Nov
Source: BusinessTech, 19.5.2020.ASSA Covid-19 model
According to the Covid-19 model of the Actuarial Society of South Africa
(ASSA), work still in progress and only available to actuaries, the
following preliminary estimates for a range of scenarios are available:
• the number of symptomatic patients will peak between August and
September, at between 588 000 and 2.3m people
• the demand for hospital beds when the outbreak is at its worst will
range between 69 400 and 125 000, while intensive care unit bed
demand ranges between 10 700 and 19 200
• the death toll from South Africa’s Covid-19 outbreak this year could
range between 46 000 and 88 000
Source: Business Day, 2020.Panda (Pandemic – Data Analysis) model
According to a model developed by a consortium called Panda, which includes
actuaries, an economist, a medical doctor, lawyers, and data specialist:
• economically restrictive lockdown measures in South Africa may cause 29
times more deaths than the measures aim to prevent
• estimates of total years of life lost (YLL)* in South Africa as a result of lockdown
could run into millions of years
• years of life lost owing to economic contraction caused by lockdown lie in the
range of 14 to 34m . In contrast, the years of life lost to avoidable
overburdening of health resources lie in the range of 26 800 to 473 500 (the
latter should not be confused with the number of Covid-19 deaths expected,
which is much lower)
• The main message of a report by Panda sent to Pres Ramaphosa is that a
continued lockdown is not only damaging the economy, it promises a
‘humanitarian disaster to dwarf Covid-19’ by having a severe impact on the
health and well-being of millions of South Africans
[* Years of life lost (YLL) when someone dies from some impact corresponds to that persons remaining life expectancy at the point when that impact occurs. We can sum this measure across a
population to estimate the aggregate years of life lost to an impact]
Source: Financial Mail, 2020.Concluding remarks
• Africa, home to about 1.34bn people (or 17.4% of the world population)
  currently has 251 277 confirmed Covid-19 cases (or 3% of the world infected
  total) and 8 152 Covid-19 deaths (or 1.5% of the world total)
• Although the numbers are still small compared to the rest of the world, Covid-
  19 has reached every African country, and infections are rising rapidly
• The worst affected countries are South Africa and some northern African
  countries such as Egypt, Algeria and Morocco as well as Nigeria, Ghana and
  Cameroon
• Together these 7 countries account for 73% of all confirmed Covid-19
  infections and 77% of all Covid-19 deaths on the continent
• The highest number of Covid-19 infections, infection rates and Covid-19 death
  rates are found in South Africa
• Egypt has the highest number of Covid-19 deaths, followed by South Africa,
  while Algeria has the highest case fatality rate
• Morocco and Algeria have the highest recovery rates (>70%), while South
  Africa has the highest number of tests and tests per 1m population
• The Covid-19 infection curve for Africa continues to rise rather rapidly
• The infection curves for South Africa and Egypt continue to rise rapidly, while
  those for Ghana, Algeria and Morocco have flattened. The infection curves for
  Nigeria and Cameroon are rising slowly
• It is only in South Africa where the implementation of national lockdown had an
  impact on the number of new Covid-19 infections, ie, declining numbers for the
  first 2 weeks after lockdown commenced
• BUT the infections in South Africa and elsewhere on the continent are and will
  continue to rise with the easing of lockdown restrictions because nobody is
  immune to the novel coronavirus and no vaccine or anti-virus is yet available
But why is the Covid-19 case-load in Africa still so low compared to
     other countries and continents? Some suggestions are:
      • Low testing levels, inadequate testing facilities due to scarce resources and weak
        healthcare systems
      • Underreporting of Covid-19 cases and Covid-19 deaths
      • Young population age structure with a low proportion of older people (only 3.5% are
        65+) and a median age of only 19.7 years, which means that 50% of Africa’s population
        is younger than 19.7 years. Older people are especially vulnerable to Covid-19 and
        have the highest death rates
      • Low population densities in many African countries, except in densely populated
        metropolitan areas (the virus spreads more easily in densely populated areas)
      • Climate conditions are hotter and drier in large parts of the continent. Like the flu the
        coronavirus is believed to be thriving in the winter months and to be less resistant to
        heat and dry conditions
      • Low intercontinental movement or international traveling (Covid-19 was initially spread
        from country to country by travelers)
      • Most African countries implemented strict lockdown restrictions and border closures
        very early on
Sources: Daily Maverick, 13 Apr 2020; The Africa Report, 5 May 2020.
• However, it can be expected that the virus will continue to spread throughout Africa, especially in the metropolitan areas and big cities with large informal settlements – the peak is still to come! • A new study by the WHO Regional Office for Africa has revealed that Africa’s Covid-19 death toll could reach between 83 000 and 190 000 people and between 29m and 44m could get infected in the first year of the pandemic if containment measures fail (IOL, 2020) • Dr Matshidiso Moeti, WHO regional director for Africa stated that ‘while Covid- 19 likely won’t spread as exponentially in Africa as it has elsewhere in the world, it likely will smoulder in transmission hotspots. Covid-19 could become a fixture in our lives for the next several years unless a proactive approach is taken by many governments in the region. We need to test, trace, isolate and treat’, Moeti said (IOL, 2020) • ‘Ultimately, the development and delivery of a safe and effective vaccine will be needed to fully interrupt transmission’ (WHO, 2020)
References
Business Day, 29.4.2020. Actuarial Society model predicts up to 88 000 Covid-19 deaths. https://www.businesslive.co.za/bd/national/health/2020-04-29-actuarial-society-
model-predicts-up-to-88000-covid-19-deaths/
BusinessTech, 19.5.2020.New coronavirus projections from Mkhize and top scientists. https://businesstech.co.za/news/government/399649/new-coronavirus-projections-from-
mkhize-and-top-scientists/
BusinessTech, 29.5.2020. The number of coronavirus tests done in every province in South Africa.
Daily Maverick, 13 Apr 2020. How do we explain the low Covid-19 caseload in Africa (so far)? https://dailymaverick.co.za
Daily Maverick Daily Digest #75, 15.6.2020. https://dailymaverick.co.za
Financial Mail, 5.5.2020. Exclusive: Lockdown disaster dwarfs Covid-19, say SA actuaries. https://www.businesslive.co.za/fm/features/2020-05-05-lockdown-disaster-dwarfs-
covid-19-say-sa-actuaries/
IOL, May 7, 2020. WHO says up to 190 000 Africans could die of Covid-19 if containment measures fail. https://www.iol.co.za/news/south-africa/kwazulu-natal/who-says-
up-to-190-000-africans-could-die-of-covid-19-if-containment-measures-fail-47672410
Johns Hopkins Coronavirus Resource Centre. Online database, 2020. https://coronavirus.jhu.edu/map.html
Malan, 8 May 2020. Q&A: When will you be able to board a plane again. https://bhekisisa.org/health-news-south-africa/2020-05-08-q-and-a-when-will-you-be-able-to-board-a-
plane-again/
National Health Laboratory Service, 2020. Covid-19 Update (15 June 2020). https://www.nhls.ac.za/covid-19-update15-june-2020/
National Health Laboratory Service, 2020. Covid-19 Update (16 June 2020). https://www.nhls.ac.za/covid-19-update16-june-2020/
Our World in Data, 2020. https://ourworldindata.org/coronavirus
StatsSA, 2019. Mid-year Population Estimate, July 2019. http://www.statssa.gov.za/publications/P0302/P03022019.pdf
The Africa Report, 5 May 2020. Coronavirus: Unpacking the theories behind Africa’s low infections rate. https://www.theafricareport.com/27470/coronavirus-unpacking-the-
theories-behind-africas-low-infection-rate/
TradingView. 2020. Coronavirus (Covid-19) charts and stats. https://www.tradingview.com/covid19/
UN, 2019. World Population Prospects, 2019 Revision. https://population.un.org/wpp/DataQuery/
Western Cape Government Covid-19 Dashboard, 2020. https://coronavirus.westerncape.gov.za/covid-19-dashboard
WHO, 2018. Online Mortality Database. https://apps.who.int/healthinfo/statistics/mortality/whodpms/
WHO, 2020. WHO says Covid-19 is 10 times more deadly than swine flu. https://www.france24.com/en/20200413-who-says-covid-19-is-10-times-more-deadly-than-swine-flu
Worldometer. Online database, 2020. https://www.worldometers.info/coronavirus/
Contact for
further enquiries
  Doris Viljoen
   Senior Futurist
 doris@ifr.sun.ac.za
You can also read