ISSUE 41/March 2021 - National Agricultural Marketing Council
←
→
Page content transcription
If your browser does not render page correctly, please read the page content below
ISSUE 41/March 2021

                1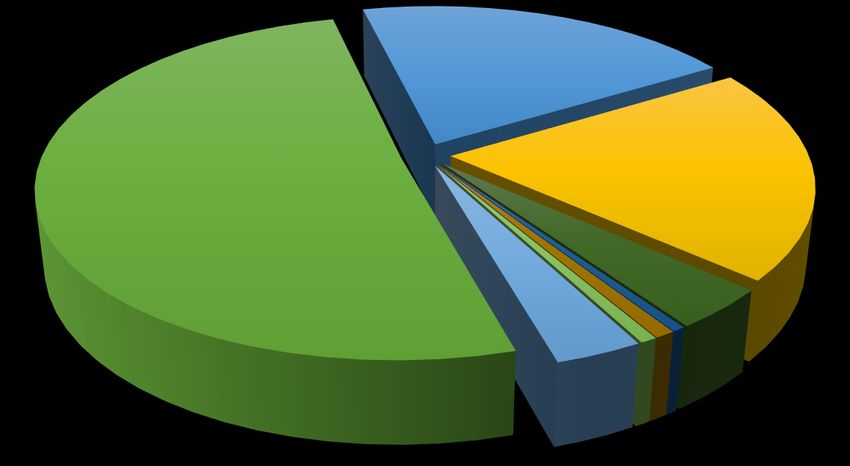
SOUTH AFRICAN FRUIT TRADE FLOW
                         Issue No. 41: March 2021

   Compiled by Lucius Phaleng, Onele Tshitiza, Moses Lubinga and Sifiso
                                Ntombela

Table of Contents
1. Background                                                             3
2. Outlook of table grapes for the 2020/21 season                         3
3. Outlook of stone fruits for the 2020/21 season                         6
4. Fruit industry perspectives                                            12
 4.1. Blockage of the Suez Canal and South Africa’s trade: What to expect 12
REFERENCES                                                                13
USEFUL LINKS                                                              14

                                                                           2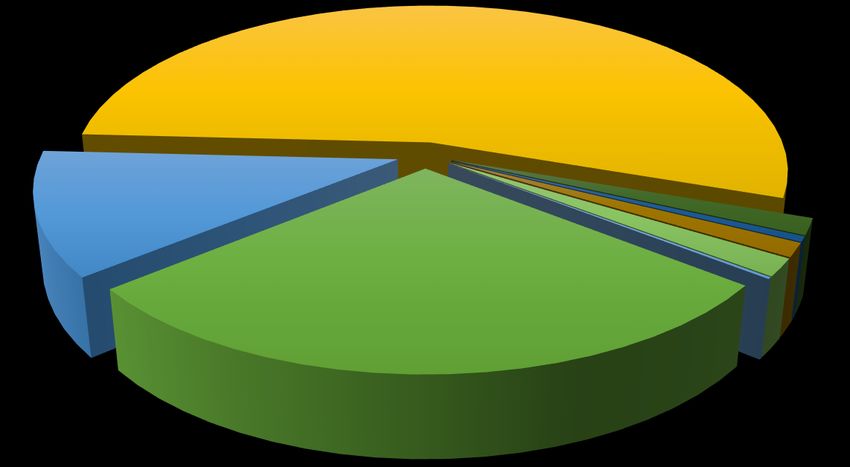
1. Background
South Africa’s diverse weather and climatic conditions enable the country to cultivate
and produce a variety of fruits. The country is known globally as a producer and
exporter of citrus, deciduous and subtropical fruits. This Fruit Trade Flow Report
issue looks at table grapes and stone fruit (plums, nectarines, peaches and
apricots). The main focus is on analysing the current season's performance of these
fruits, for both the export and domestic markets, compared to the previous seasons.
This report further assesses these fruits’ global production, giving a perspective on
South Africa's production and export rankings (as a share of global production and
exports).

2. Outlook of table grapes for the 2020/21 season
The global production of table grapes for 2020/21 is shown in Figure 1. Global
production is projected slightly upwards from 2019/20 by just 221 000 tons to 25.7
million tons, which is due to the expected increase in production in China, which is the
highest global producer, of about 400 000 tons in 2020/21. China's production has
improved over time because of enhanced production practices. Other producing
countries’ production is expected to increase slightly or remain the same, such as the
United States (US), which is likely to increase by 114 000 tons, and Brazil and
Uzbekistan, which are expected to remain unchanged at 1.592 million tons and 1.590
million tons respectively. Production from India, Turkey and the European Union (EU)
is predicted to decline by 125 000 tons, 50 000 tons and 170 000 tons, respectively,
due to unfortunate weather events such as hail damage in Turkey and frost during
flowering in Italy (USDA, 2020a). Imports are expected to remain fairly unchanged at
3.393 million tons and exports will increase by only 73 000 tons globally.

                           30000

                           25000
   Volume in 1000 Tons

                           20000

                           15000

                           10000

                             5000

                                0
                                      2015/16   2016/17         2017/18     2018/19   2019/20   2020/21*
                         Production    23757     24783           24955       24374     25469     25690
                         Imports        2948     3093            3412         3336     3393       3393
                         Exports        2916     3123            3279         3305     3341       3414

                                                   Production     Imports   Exports

Figure 1: Global production, imports and exports of table grapes, 2015/16-2020/21*
Source: USDA (2020b)
*Estimate

                                                                                                           3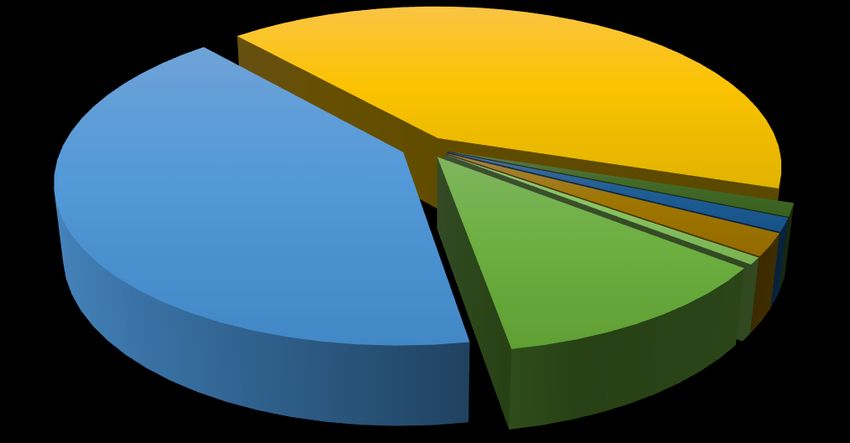
South Africa’s production is depicted in Figure 2. Production is expected to increase
by 8 000 tons to 330 000 tons in the 2020/21 season. Production has improved due to
new plantings of high-yielding cultivars coming into full production, marginal growth in
hectares planted in the last six years, water availability, and favourable weather
conditions during harvesting in the planting regions (SATGI, 2021). Exports are
expected to increase by 7 000 tons compared to the previous season due to increased
production, while imports are predicted to increase to 11 000 tons – 1 000 tons more
than the previous season.

                             400
   Volume in 1000 Tons

                             350
                             300
                             250
                             200
                             150
                             100
                              50
                               0
                                    2011/1 2012/1 2013/1 2014/1 2015/1 2016/1 2017/1 2018/1 2019/2 2020/2
                                      2      3      4      5      6      7      8      9      0      1*
                         Production 286     262    252    291    285    334    308    298    322    330
                         Imports      4      5      5      6      6      7      8      9      10     11
                         Exports     246    235    226    264    255    304    279    276    298    305

                                                    Production     Imports    Exports

Figure 2: South Africa’s production, imports and exports of grapes, 2011/12-2019/20*
Source: USDA (2020b)
*Estimate

According to South African Table Grape Industry (SATGI) estimates, South Africa is
expected to export between 67.2 million cartons and 70.9 million cartons (1 carton= 4
kg) in 2020/21 (Table 1), an increase of between 2 % and 7 % compared to what was
packed in the 2019/20 season. Most of the production regions are estimated to
increase as the industry returns to its normal volumes compared to 2019/20, which
was affected by rains. The Orange River was not adversely affected by the rain during
the year as the harvest was not entirely interrupted.

Table 1: South African Table Grape Industry’s 4th estimate for 2020/21
                                   2020/21 Crop estimates                               Actual packed volumes
Region                             4th            3rd          2nd           1st        2019/20     2018/19   2017/18
                                   04 March 2021 02 February   12 January    27 October
                                                  2021         2021          2021
Northern                           7.8-7.9        7.5-7.8      6.9-7.4       6.9-7.4    6.1         7.12     6.83
Provinces
Orange River                       18.3-18.5     18.3-18.3     15.0-16.0     18.5-19.9   19.86     19.21     19.02
Olifants River                     4.0-4.2       3.7-4.0       3.7-4.0       3.5-3.8     3.32      2.37      2.8
Berg River                         16.5-17.3     15.5-16.7     15.5-16.7     15.5-16.7   16.27     13.79     13.05
Hex River                          20.6-23.0     20.6-23.0     20.6-23.0     20.6-22.0   20.6      18.65     20.37

                                                                                                                     4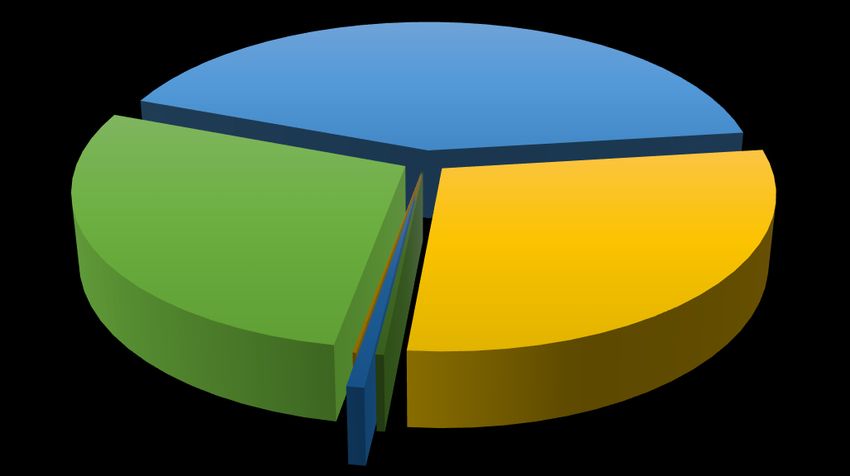
Total            67.2-70.9           65.3-69.8     61.7-67.1    65.0-69.8   66.15       61.13        62.06
Source: SATI (2021)
Table 2 shows South Africa's total exports of table grapes at the end of week 11 in 4
kg cartons. Overall, there has been a total of 62.6 million cartons of table grapes
exported by South Africa so far in the season, 3 % more than 2020 in the same week.
It can be noted that the EU is South Africa's largest market for table grapes, absorbing
54 % of the exports, and exports increased by 14 % compared to the same week in
2020. The United Kingdom (UK) is the second-largest importer of South Africa's
grapes but is 9 % lower than 2020. Interesting is the 40 % increase in exports going
to Asia in 2021 compared to 2020 in week 11, revealing a potential increase in demand
and opening a market in Asia for South Africa's table grapes.

Table 2: South Africa’s total exports of table grapes for week 11 in 4 kg cartons (2020 and
2021)
                         2020               2021               Difference      Difference (%)   Share in
                                                                                                exports
                                                                                                (%)

 European Union          29,631,263         33,643,221         4,011,958       14               54
 United Kingdom          15,222,393         13,793,321         -1,429,072      -9               22
 South-East Asia         5,832,823          5,303,295          -529,528        -9               8
 North America           4,698,290          4,493,178          -205,112        -4               7
 Middle East             2,924,906          2,980,368          55,462          2                5
 Africa                  912,445            900,558            -11,887         -1               1
 Asia                    183,268            256,426            73,158          40               0
 Other                   1367370            1213255            -154115         -11              2
 Total                   60,772,758         62,583,622         1,810,864       3
Source: Agrihub (2021)

Figure 3 shows the volumes and average prices of fresh table grapes sold through
the national fresh produce markets (NFPMs) from 2019 to 2021 (January-February).
The peak season shows between January and March, where the largest volumes are
sold and corresponding prices are at their lowest. The volumes in 2021 so far are
lowest compared to the other years and the prices higher, likely due to more table
grapes being directed to the export market or the late start in the season for some
regions. By February 2021, 6 376.06 tons of table grapes had been supplied at R15
774.90/ton compared to 7 545.94 tons supplied in 2020 at R13 838.59/ton and 7
606.01 tons at R12 132.56/ton in 2019.

                                                                                                             5
5000 35000
4500
30000
4000
3500 25000
Volume in Tons
Price in R/Ton
3000
20000
2500
15000
2000
1500 10000
1000
5000
500
0 0
Jan Feb Mar Apr May Jun Jul Aug Sep Oct Nov Dec
2019 TONS 2020 TONS 2021 TONS
2019 R/TON 2020 R/TON 2021 R/TON
Figure 3: Price and quantity of table grapes sold through the NFPMs (2019-2021)
Source: DALRRD (2021)
3. Outlook of stone fruits for the 2020/21 season
Table 3 highlights the various stone fruits passed for export between 2017/18 and
2019/20, with 2020/21 being estimated volumes. The stone fruit forecast for the
2020/21 season is looking much better than last year. The good winter rainfall in most
parts of the Western Cape during 2020 contributed to a better overall fruit set of all
stone fruit commodities. Apricots are estimated to increase by 23 % year-on-year (y-
o-y), mainly due to Imperial/Palsteyn returning to an average export crop. Nectarine
export volumes are expected to increase from last year’s five million cartons to 5.6
million cartons. The growth in export volumes is driven by young orchards coming into
production and more favourable weather conditions. Similarly, peaches are also
expected to increase to a normal crop of 5 % y-o-y. Plum growers are expecting export
volumes to increase by 22 % compared to last season.
Table 3: Stone fruit cultivars passed for export (cartons)
Stone fruit cultivars passed for export (week 9)
Stone fruits 2017/18 2018/19 2019/20 3-year avg. 2020/21 2020/21 vs
est. 2019/20
Plums
10 249 055 8 790 651 8 892 993 9 310 900 10 870 500 +22 %
(1 carton = 5.25 kg)
Nectarines
4 202 020 4 010 973 5 065 598 4 426 197 5 608 500 +11 %
(1 carton = 2.5 kg)
Peaches
2 156 038 1 835 008 2 010 484 2 000 510 2 111 800 +5 %
(1 carton = 2.5 kg)
Apricots
723 195 574 935 354 804 550 978 435 600 +23 %
(1 carton = 4.75 kg)
Source: Hortgro (2021)
6Figure 4 highlights the volumes of South Africa’s plums (measured in 5.2 kg cartons)
passed for export and the corresponding markets in week 8 of 2021. Volumes passed
for export in week 8 of 2021 increased by 113 % compared to the same period in 2020.
Europe remains South Africa's main market for plums and this is driven by continued
market access. During week 8 of 2021, European imports constituted a share volume
of 51 % and this showed an increase of 1 % compared to the 2020 period. The Middle
East was the second-largest export market, constituting a 20 % share, followed by the
UK (20 %), Far East and Asia (4 %), Russian Federation (3 %), USA & Canada and
Indian Ocean Islands (1 %). Africa showed a zero per cent share.
Middle East
20%
United Kingdom
20%
Europe
51%
Far East &
Asia
Africa 4%
0%
USA & Indian Ocean
Russian Federation Canada
3% Islands
1% 1%
Figure 4: Main export destinations for South Africa’s plums (week 8 of 2021)
Source: Hortgro (2021)
As nectarine exports are expected to increase by 5.6 million cartons (2.5kg), there is
also an expectation that the illustrated markets will be critical in opening up their
shelves. Three (3) nectarine cultivars were passed for export, namely Arctic Wolf,
September Red and Arctic Snow. Figure 5 shows the principal market destinations
for nectarines exported from South Africa in week 8 of the 2021 season. The UK is
indicated as the principal importer of nectarines from South Africa, with a share of
54 %, followed by Europe (29 %), the Middle East (12 %), Far East & Asia, as well as
USA/Canada (2 %) and Indian Ocean Islands (1 %).
7United Kingdom
54%
Far East & Asia
Middle East 2%
12%
Africa
Europe
0%
29%
Indian
Ocean
Russia USA & Islands
0% Canada 1%
2%
Figure 5: Main export destinations for South Africa’s nectarines
Source: Hortgro (2021)
The majority of peaches produced in the country are consumed for processing (peach
juice) and drying. Only smaller portions of peaches are exported to the international
markets. Figure 6 illustrates the main market destinations for peaches exported by
South Africa in week 11 of 2021. The Middle East absorbed about 41 % of peaches
from South Africa, followed by the UK (42 %), Europe (12 %), Indian Ocean Islands
(2 %) and Far East & Asia (1 %). Both the Russian Federation and Africa constituted
about 1 % respectively of South Africa's total peach exports.
United Kingdom
42%
Far East &
Asia
Middle East
1%
41%
Europe Africa
12% 1%
Indian Ocean
Islands
2%
Russian
Federation
1%
Figure 6: Main export destinations for South Africa’s peaches
Source: Hortgro (2021)
8Figure 7 indicates the main market destination for South Africa's apricots to the global
markets in week 11 of 2021. The Middle East ranked as the principal importer of South
Africa’s apricots with a share of 42 %, followed by Europe (28 %), the UK (29 %) and
Africa (1 %), while the Indian Ocean Islands constituted 0 %.
Middle East
42%
Europe United Kingdom
28% 29%
Indian Ocean
Far
Islands East &
0% Africa
1% Asia
0%
Figure 7: Main export destinations for South Africa’s apricots
Source: Hortgro (2021)
South Africa’s fresh produce markets are regarded as critical market destinations for
local farmers after the export market. Figure 8 highlights the volume of plums sold
through the National Fresh Produce Markets (NFPMs), as well as their market price
per ton. The information is illustrated monthly from January to December (2019 &
2020) and from January to February 2021. The total volume of plums sold in 2019 was
12 833 tons at an average price of R 9 612 per ton, while 2020 sales increased to 13
258.40 tons at an average of R 9 610 per ton. Additionally, 2021 is still in progress,
with only two months shown. In the period under review, high sales were experienced
in February 2020 (3 949 tons), while high prices were experienced in August 2020
(R41 497/ton).
94500 45000
4000 40000
3500 35000
3000 30000
Volume inTons
Price in R/Ton
2500 25000
2000 20000
1500 15000
1000 10000
500 5000
0 0
Jan Feb Mar Apr May Jun Jul Aug Sep Oct Nov Dec
2019 TONS 2020 TONS 2021 TONS
2019 R/TON 2020 R/TON 2021 R/TON
Figure 8: Price and quantity of plums sold through the NFPMs (2019 – 2021)
Source: DALRRD (2021)
Figure 9 illustrates the monthly sales of nectarines during 2019, 2020 and 2021
(January to February) season. In South Africa, nectarines are mainly destined for
export markets, while the rest is consumed as fresh and processed into juice. A total
of 9 499 tons were sold through the NFPMs at an average price of R 16 721/ton in
2019, while 2020 sales stood at 8 757 tons (R18 077/ton). The sales in 2019 were
higher than sales in the 2020 period. High sales of nectarines occur towards the
beginning and the end of each year. In 2021 (January & February), a total of 2 754.3
tons were sold.
102500 40000
35000
2000
30000
Volume in Tons
Price in R/Ton
25000
1500
20000
1000
15000
10000
500
5000
0 0
Jan Feb Mar Apr May Jun Jul Aug Sep Oct Nov Dec
2019 TONS 2020 TONS 2021 TONS
2019 R/TON 2020 R/TON 2021 R/TON
Figure 9: Price and quantity of nectarines sold through the NFPMs (2019 – 2021)
Source: DALRRD (2021)
Figure 10 illustrates the trends for peaches sold through the (NFPMs) in terms of
quantity and average price for 2019, 2020 and 2021 (January and February). In 2019,
the NFPMs sold a total of 12 082.15 tons at an average price of R 13 432.51 per ton,
with high sales volumes being experienced in January. In 2020, about 13 411.39 tons
were sold in the local markets at an average price of R 13 968.66 per ton, and high
sales were also experienced in January. The first two months of 2021 experienced a
sale of 6 157.33 tons at an average price of R 11 837.83 per ton.
4000 50000
3500 45000
40000
3000
35000
Volume in Tons
Price in R/Ton
2500 30000
2000 25000
1500 20000
15000
1000
10000
500 5000
0 0
Jan Feb Mar Apr May Jun Jul Aug Sep Oct Nov Dec
2019 TONS 2020 TONS 2021 TONS
2019 R/TON 2020 R/TON 2021 R/TON
Figure 10: Price and quantity of peaches sold through NFPMs (2019 – 2021)
Source: DALRRD (2021)
11Figure 11 highlights the volume of apricots sold through the NFPMs and the
corresponding price trends for 2019, 2020 and 2021 (January and February). During
2019, approximately 841.53 tons were sold at an average price of R 16 518.23 per
ton, and high sales were achieved in December at a volume of 326.13 tons. In 2020,
about 749.40 tons were sold at an average of R 17 921.57 per ton. Local market sales
for 2021 only capture the months of January and February, which had sale volumes
of 322.37 tons at an average sale price of R 10 842.10 per ton.
500 100000
450 90000
400 80000
350 70000
Volume in Tons
Price in R/Ton
300 60000
250 50000
200 40000
150 30000
100 20000
50 10000
0 0
Jan Feb Mar Apr May Jun Jul Aug Sep Oct Nov Dec
2019 TONS 2020 TONS 2021 TONS
2019 R/TON 2020 R/TON 2021 R/TON
Figure 11: Price and quantity of apricots sold through NFPMs (2019 – 2021)
Source: DALRRD (2021)
4. Fruit industry perspectives
The following section focuses on current issues affecting the fruit industry and also
provides an analysis of how the industry is performing in terms of addressing
developmental issues and where it could improve. In this issue, the focus is on the
Suez Canal blockage.
4.1. Blockage of the Suez Canal and South Africa’s trade: Lessons learnt
From one hurdle to another! Beyond the entanglement in ongoing trade wars between
China, the United States (US) and Australia culminating in soaring tariff rates on
certain agricultural products (e.g. wine), which also influence South Africa's
agricultural trade, the outbreak of the COVID-19 pandemic was another stumbling
block that saw the disruption of logistics globally. Although South Africa's agricultural
exports were not significantly affected (except for alcoholic beverages and tobacco
products), there was a slowdown in activities at customs in a number of countries.
Logistics companies recorded shortages in containers for cargo as they were pending
to be cleared at the customs points. However, as countries gradually eased the
12restrictive measures as the number of COVID-19 infections subsided globally, trade
resumed to blossom.
As of 23 March 2021, the most recent hurdle that affected South Africa's agricultural
trade flows, particularly with the European Union (EU), the United Kingdom (UK) and
parts of Asia, was the blockage of the Suez Canal by a massive container ship, Ever
Given, measuring 400 metres wide and 59 metres long. It is worth noting that over the
years, the EU, UK and Asia have remained South Africa's major trading partners in
agricultural products and that the Suez Canal is the main and fastest shipping route to
that part of the world. The canal is responsible for over 50 ships that traverse per day
and handles about 12 % of global trade (ABC News, 2021). The massive container
ship (Ever Given), which was wedged sideways in the narrow canal, left no provision
for other ships to sail, thereby hampering trade. Timely interventions had to be made
to dislodge the massive Ever Given, with further disruption of global trade foreseen to
happen in addition to the damage already done by the COVID-19 outbreak and the
trade wars. For South Africa to minimise the negative impact thereof, there was a
possibility of ships using the Pacific Ocean route, but this would have come at a cost
of about ten more days to reach the EU, among other associated intricacies.
Alternatively, in the highly perishable primary agricultural products, airfreight would
have been the fastest option but at an exorbitant cost. Unfortunately, the national
airline – South African Airways (SAA) – is also not operational.
What is the take-home message out of all these global shocks that disrupt South
Africa's agricultural trade? In a broad sense, South Africa should emphasise
diversification of both markets and products.
● For market diversification, under the auspices of the recently enacted African
Continental Free Trade Area (AfCFTA), South Africa should explore trade more
with other African countries. This, however, calls for capital investment in both
hard and soft infrastructure to reduce the existing bottlenecks across the
continent. Moreover, such investments entail considerations for affordable
airfreight interventions for perishable cargo that earns the economy premium
prices.
● For product diversification, agro-processing should also be accorded more
attention. The Agriculture and Agro-processing Master Plan (AAMP) is in the
pipeline for the agricultural sector.
13REFERENCES
ABC News. 2021. Suez Canal blockage adds to pressure points in global trade.
Available online at: https://abcnews.go.com/Business/wireStory/suez-canal-
blockage-adds-pressure-points-global-trade-76742659
Agrihub. 2021. Grapes weekly exports. Available online at:
https://www.agrihub.co.za/reports/
DALRRD (Department of Agriculture, Land Reform and Rural Development). 2021.
Local market fruit sales data. Pretoria: Directorate of Agricultural Statistics.
Hortgro. 2021. Stone fruit export data. Paarl: Information and Market Intelligence
Division.
SATGI (South African Table Grape Industry). 2021. South African Table Grape
Industry – Fourth crop estimate for 2020/2021 season. Available online at:
https://www.satgi.co.za/download/south-african-table-grape-industry-4th-crop-
estimate-for-2020-2021-season/
USDA (United States Department of Agriculture) Foreign Agricultural Service. 2020a.
Fresh apples, grapes, and pears: World markets and trade. Washington, DC: USDA.
Available online at:
https://apps.fas.usda.gov/PSDOnline/CircularDownloader.ashx?year=2021&month=
03&commodity=Fruit
USDA (United States Department of Agriculture) Foreign Agricultural Service. 2020b.
Production, supply and distribution. Washington, DC: USDA. Available online at:
https://apps.fas.usda.gov/psdonline/app/index.html#/app/downloads
14USEFUL LINKS
Bureau for Food and Agricultural Policy (BFAP) www.bfap.co.za
Citrus Growers’ Association (CGA) www.cga.co.za
Department of Agriculture, Forestry and Fisheries (DAFF) www.daff.gov.za
Food and Agriculture Organisation (FAO) www.fao.org/docrep/
Fresh Produce Exporters’ Forum (FPEF) www.fpef.co.za
Hortgro Services www.hortgro.co.za
National Agricultural Marketing Council (NAMC) www.namc.co.za
Perishable Products Export Control Board (PPECB) www.ppecb.com
Quantec Easy Data www.quantec.co.za
South African Subtropical Growers’ Association (Subtrop) www.subtrop.co.za
South African Table Grape Industry (SATGI) www.satgi.co.za
© 2021. Published by the National Agricultural Marketing Council (NAMC).
DISCLAIMER
The information contained in this document results from research funded wholly or in
part by the NAMC acting in good faith. Opinions, attitudes and points of view
expressed herein do not necessarily reflect the official position or policies of the
NAMC. The NAMC makes no claims, promises or guarantees about the accuracy,
completeness or adequacy of the contents of this document and expressly disclaims
liability for errors and omissions regarding the contents thereof. No warranty of any
kind, implied, expressed or statutory, including but not limited to the warranties of no
infringement of third-party rights, title, merchantability, fitness for a particular purpose
or freedom from computer virus, is given with respect to the contents of this document
in hard-copy, electronic format or electronic links thereto. References made to any
specific product, process or service by trade name, trademark, manufacturer or
another commercial commodity or entity are for information purposes only and do not
imply approval, endorsement or favouring by the NAMC.
For Correspondence:
Dr. Sifiso Ntombela
(+27) 12 341 1115
Sifiso@namc.co.za
Private Bag X935
Pretoria, 0001
15You can also read