South Africa Na#onal Pulse 2017 Report - Reputation Institute
←
→
Page content transcription
If your browser does not render page correctly, please read the page content below

South Africa Na#onal Pulse 2017 Report
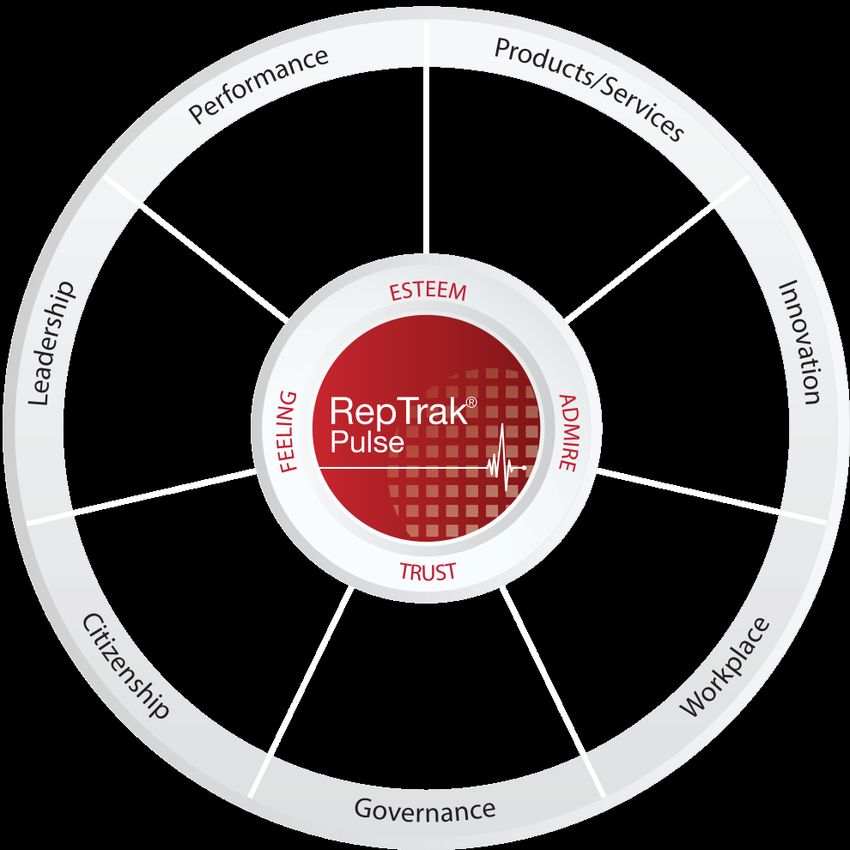
Table of Contents

                    Section 1    Introduction       4

                    Section 2    Country results   10

                    Appendix 1   Demographics      35

                    Appendix 2   Methodology       37

                                                        2
                                                        2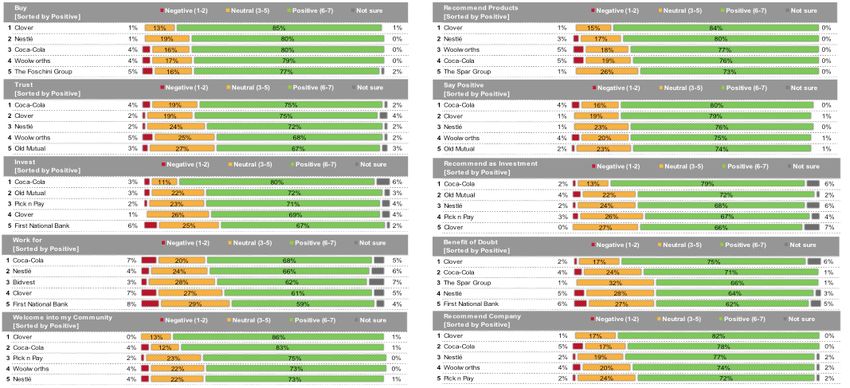
Section 1      Introduction
About the study. The RepTrak® model.

                                       3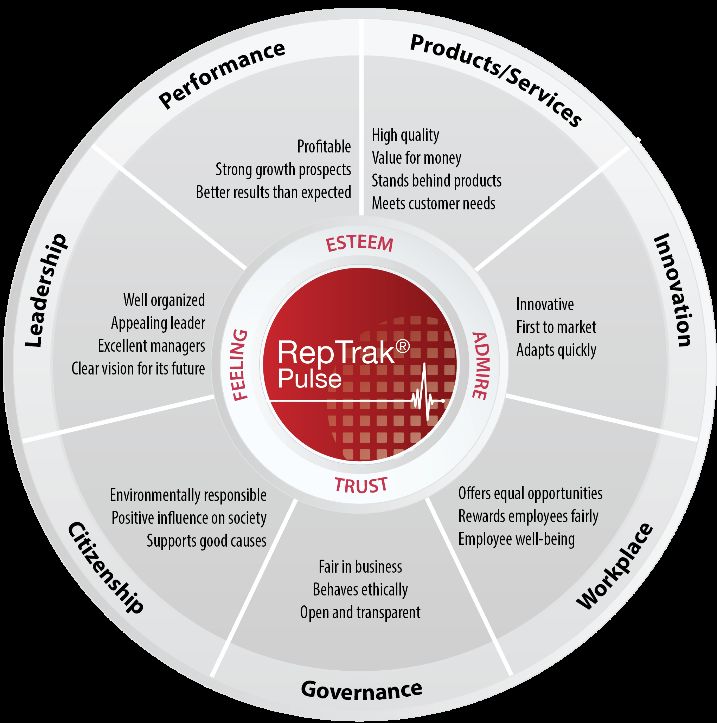
About the Study

What follows are the results of the RepTrak® Pulse 2017
reputation study conducted in South Africa by the Reputation
Institute and the Reputation House.

The reputations of the biggest and most visible companies in
South Africa were measured via an online survey among a
representative sample of the general public in South Africa.

Data collection took place in February and March, 2017.

Contact information

For more information about the study please contact:
info@reputationhouse.co.za

                                                               4
                                                               4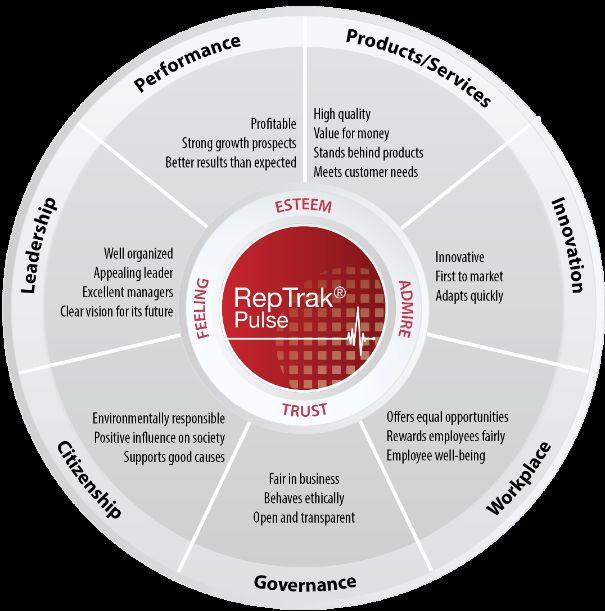
The RepTrak® Model Explains Reputation

The RepTrak® Model
Reputation Institute’s generic model for reputation is structured
around four core themes, seven reputation dimensions and 23
reputation attributes. Together, these elements explain a
company’s reputation.                                                       3
1 - Reputation                                                          2
RepTrak® Pulse is the core of a company’s reputation and
shows how strong the emotional bond is between the company          1
and the public.

2 – Dimensions and attributes
The RepTrak® model consists of seven operational dimensions
and 23 attributes that explain the reputation profile.

3 - Drivers
The individual attributes mean different things to people and are
perceived differently in terms of weighted importance.

Analyses identify areas that are most important for strengthening
a company’s reputation.

Drivers can be at dimension and attribute level and show how
the company gains value for money in its communication.
                                                                                5
                                                                                5
RepTrak® - Rational vs. Emotional

What is the relationship between RepTrak® Pulse
and the 7 reputation dimensions?

RepTrak® Pulse measures the overall reputation
based on people's immediate emotional perception
of the company. In contrast, the 7 reputation
dimensions examine people’s rational perception of
corporate reputation based on specific and detailed
statements.

RepTrak® Pulse score is not necessarily always
equal to the average of the 7 reputation dimensions.
People’s emotional perception may be influenced by
an overall positive attitude to the company, which is
not necessarily rewarded by a proper evaluation of
the respective company's products, innovation,
workplace, governance, citizenship, leadership or       Emotional            Rational
performance.                                                        explanation of the emotional

                                                                                                   6
                                                                                                   6
Why should we care about reputation

Reputation is important, because it drives supportive behaviour and through support of its stakeholders allows the company to achieve business
results.

       Touch Points                               Reputation                                              Supportive Behaviour
                                                                                        Welcome into the community     Recommend products/services
       Direct experience
                                                                                            Benefit of the doubt       Recommend as an investment

                                                                                            Trust the company               Recommend the company
 What a company communicates
                                                                                                 Work for                        Say positive

                                                                                                    Buy                             Invest
       What others say
                                                                                                                   Choose

Stakeholders build their perceptions about a company through three types of channels:
       • “Direct Experience” (buying product/service, contacting customer support
          • “What a company communicates” (company’s own communication, marketing material, newsletters, website)
          • “What others say” (word of mouth, media publications, expert opinions)
Perceptions gained through Direct Experience and Own Communication can be to large extent controlled by the company. What others say, on
the other hand, can only be influenced indirectly. The company needs to manage its reputation in order to appear in accordance to expectations
of its stakeholders.

                                                                                                                                                     7
                                                                                                                                                     7
Significant differences and normative scale

Significant differences
In any study based on a sample of the population there is a statistical error in all measurements.

The table below shows the difference needed between two scores before they can be said to be significantly different.

            Statistical Significance

    RepTrak® Pulse                      > 3,7

    Dimensions                          > 7,3

Only score differences that are statistically significant will be shown in this report.

Normative scale
Using an extensive database containing results from thousands of studies throughout the world since 1998, Reputation Institute has developed
a Normative Scale (in everyday language “The Traffic Light”) that indicates whenever a particular score is high or low when benchmarked
against previous studies of a similar character.

    Excellent/Top tier                  80+
    Strong/Robust                      70-79
    Average/Moderate                   60-69
    Weak/Vulnerable                    40-59
    Poor/Lowest tier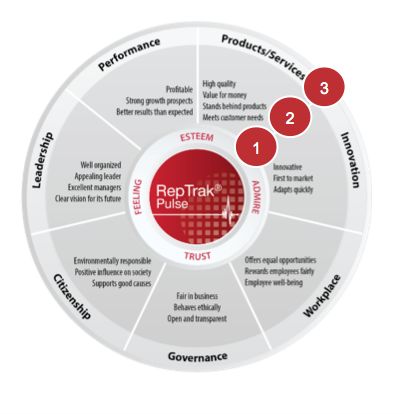
Section 2      Country Results
South Africa 2017

                                 9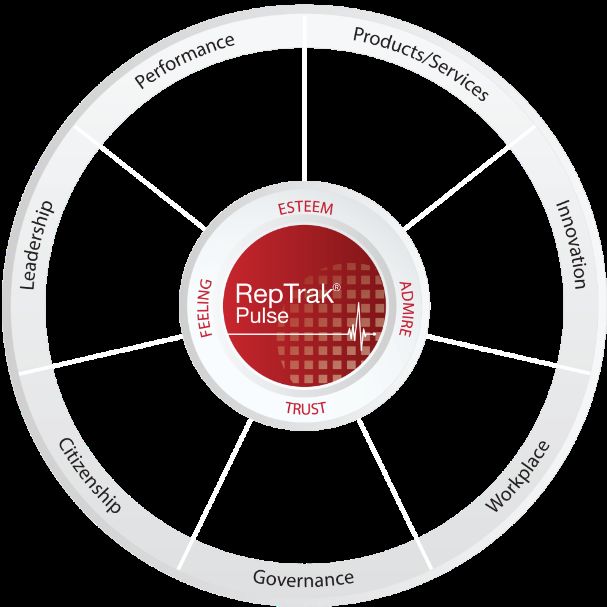
Most Visible Companies
List of Companies
South Africa
[Sorted by Industry]

Financial_Short-Term Insurance   FMCG                                     Oil, Gas & Lubricants

1st for Women (Pty) Ltd          Clover                                   BP
Auto & General                   Coca Cola                                Caltex
Budget Insurance                 Nestle                                   Engen
Dial Direct                      Procter & Gamble                         Sasol
MiWay Insurance                  SAB Miller                               Shell
Outsurance                       Tiger Brands                             Total South Africa
Santam                           Unilever

Financial – Bank                 Financial - Diversified                  Telecommunications

ABSA                             Discovery                                Cell C
Capitec Bank Holdings            Liberty Holdings                         MTN Group
First National Bank              Momentum                                 Telkom SA
Nedbank                          Old Mutual                               Vodacom Group
Standard Bank                    Sanlam

Retail                           State Owned Enterprises

Edcon Group                      Eskom
Massmart Holdings                South African Airways
Mr Price Group                   South African Broadcasting Association
Pick n Pay Holdings              South African Post Office
Shoprite Holdings                Transnet
The Foschini Group
The Spar Group
Truworths (International)
Woolworths Holdings                                                                               10
                                                                                                  10
Measured companies - 2016 to 2017
Company 2016 2017 Company 2016 2017
1st for Women Nedbank
ABSA Nestlé
Auto & General Old Mutual
Barloworld Outsurance
Bidvest Pick n Pay
BP Procter & Gamble
Budget Insurance SABMiller
Caltex Sanlam
Capitec Bank Santam
Cell C Sasol
Clover Shell
Coca-Cola Shoprite
Dial Direct South African Airways
Discovery South African Broadcasting Corporation
Edcon Group South African Post Office
Engen Spar Group
Eskom Standard Bank
First Rand_FNB Telkom
Foschini Group Tiger Brands
Liberty Holdings Total
Massmart_Makro/Game/Dion Transnet
MiWay Insurance Truworths
Momentum Unilever
Mr Price Group Vodacom
MTN Woolworths
11
11Familiarity Distribution
South Africa (1/2)
Familiarity distribution (%)
[South Africa]
[sorted by very familiar] Very familiar Somewhat familiar Have only heard the name Not at all familiar Not sure
Coca Cola 85% 12% 0%
1% 2% n = 2.152
First National Bank 81% 15% 0% 4% 1% n = 2.302
Eskom 80% 17% 1% 2% 1% n = 3.692
Vodacom Group 78% 15% 4%
2% 1% n = 2.429
Pick n Pay Holdings 78% 16% 3%
1% 1% n = 2.281
Telkom SA 77% 18% 2%
1% 1% n = 3.456
The Spar Group 76% 17% 4%
1% 2% n = 2.308
Nestle 75% 21% 2% 0% n = 2.260
Mr Price Group 75% 21% 3%
1% 1% n = 2.350
Cell C 74% 21% 3%
1% 1% n = 2.297
Clover 74% 21% 3%
1% 0% n = 2.298
ABSA 74% 21% 3%
1% 1% n = 2.248
Shell 74% 22% 3%
1% 0% n = 2.215
South African Post Office 73% 22% 3%
1% 0% n = 2.265
Truworths 73% 21% 5%
1% 0% n = 2.328
MTN Group 73% 21% 4%
2% 0% n = 2.615
Woolworths Holdings 72% 20% 5%2% 1% n = 3.789
Standard Bank 72% 24% 3%
1% 0% n = 2.129
Engen 71% 23% 3%
2% 0% n = 2.356
Shoprite Holdings 71% 20% 5%3% 1% n = 2.250
Massmart Holdings_Makro/Game/Dion 69% 21% 6%4% 0% n = 2.336
Caltex 69% 23% 6%1% 1% n = 2.346
BP 69% 25% 4%
2% 0% n = 2.513
Nedbank 67% 24% 5%3% 1% n = 2.147
Old Mutual 65% 27% 6%1% 0% n = 2.322
0% 10% 20% 30% 40% 50% 60% 70% 80% 90% 100% 12
12Familiarity Distribution
South Africa (2/2)
Familiarity distribution (%)
[South Africa]
[sorted by very familiar] Very familiar Somewhat familiar Have only heard the name Not at all familiar Not sure
The Foschini Group 65% 27% 5%2% 1% n = 2.245
South African Airways 64% 29% 5%
1% 1% n = 2.490
South African Broadcasting Corporation 64% 24% 7% 3% 1% n = 2.233
Sasol 64% 28% 6%2% 0% n = 2.472
Discovery 62% 26% 9% 2% 1% n = 2.454
Outsurance 61% 27% 8% 3% 1% n = 2.388
Capitec Bank Holdings 61% 28% 8%1% 1% n = 2.323
Sanlam 60% 30% 7%2% 0% n = 2.636
Total South Africa 59% 25% 9% 6% 1% n = 2.742
Tiger Brands 54% 30% 11% 4% 0% n = 2.509
Transnet 51% 30% 14% 5% 0% n = 3.910
SAB Miller 49% 28% 12% 10% 2% n = 2.777
Unilever 47% 30% 13% 9% 1% n = 2.644
Momentum 46% 36% 12% 5% 1% n = 2.462
Edcon Group 45% 24% 14% 16% 1% n = 2.879
Santam 45% 36% 14% 5% 1% n = 2.603
MiWay Insurance 43% 32% 18% 7% 0% n = 3.011
Budget Insurance 42% 36% 16% 5% 1% n = 2.459
Auto & General 42% 33% 18% 6% 1% n = 2.608
1st for Women 41% 35% 17% 6% 1% n = 2.951
Bidvest 40% 36% 18% 5% 1% n = 2.784
Dial Direct 40% 34% 19% 6% 1% n = 2.925
Liberty Holdings 39% 31% 17% 12% 1% n = 2.874
Barloworld 30% 33% 19% 15% 3% n = 3.259
P&G 22% 29% 24% 21% 3% n = 3.446
0% 10% 20% 30% 40% 50% 60% 70% 80% 90% 100% 13
13South Africa – 2017 Top 10
RepTrak® Pulse – Top 10
South Africa: 2017
1 80,3
2 79,5
3 77,6
4 76,7
5 76,3
6 75,8
7 75,6
8 75,2
9 72,7
Excellent/Top tier 80+
Strong/Robust
Average/Moderate
70-79
60-69
10 72,4
Weak/Vulnerable 40-59
Poor/Lowest tierChanges in Top 10
2016 vs 2017
2016 2017
78,1 1 80,3
1
76,2 2 79,5
2
75,4 3 77,6
3
74,9 4 76,7
4
73,3 5 76,3
5
72,6 6 75,8
6
72,1 7 75,6
7
71,6 8 75,2
8
70,2 9 72,7
9
10
69,9 10 72,4
Excellent/Top tier 80+
Strong/Robust 70-79
Average/Moderate 60-69
Weak/Vulnerable 40-59
Poor/Lowest tier1
Clover
Strong/Robust
2
Poor/Lowest tier
Coca Cola
Weak/Vulnerable
Excellent/Top tier
Average/Moderate
3
Pick n Pay Holdings
4
Nestle
5
First National BankIndustry Ranking
Industry Rankings
2017
FMCG (7) 72,8 n = 699
Retail (9) 72,1
n = 1 101
70,8
Financial - Diversified (5) n = 502
69,7
Oil, Gas & Lubricants (6) n = 600
68,7
Financial - Banking (5) n = 500
66,8
Financial - Short-term Insurance (7) n = 702
63,5
Telecommunication (4) 58,4 n = 602
State Owned Enterprises (5) 45,2 n = 901
Total n = 5 807
Excellent/Top tier 80+
Strong/Robust 70-79
Average/Moderate 60-69
Weak/Vulnerable 40-59
Poor/Lowest tierIndustry Leaders
Leaders within each Industry
2017
Industry Leaders
2017
FMCG (Clover)
Retail (Pick n Pay Holdings)
Financial - Banking (First National Bank)
Financial - Diversified (Old Mutual)
Oil, Gas & Lubricants (Engen)
Financial - Short-term Insurance (Santam)
Telecommunication (Vodacom Group)
State Owned Enterprises (South African Airways)
Excellent/Top tier 80+
Strong/Robust 70-79
Average/Moderate 60-69
Weak/Vulnerable 40-59
Poor/Lowest tierIndustry Leaders Rank 2016 2017
FMCG
2016 vs 2017
Retail
Financial - Banking
Financial - Diversified
Oil, Gas & Lubricants
Financial – Short-
term Insurance
Telecommunication
Excellent/Top tier 80+
Strong/Robust 70-79
Average/Moderate 60-69 State-Owned
Weak/Vulnerable 40-59 Enterprises 19
Poor/Lowest tierReputation Drivers
Dimensions 2017
20Products vs. Enterprise - driving reputation
Explanation
6 Products vs. enterprise analysis is based on two sets of
indices for all companies in South Africa: the Products
index (defined as Products & Services and Innovation)
and the Enterprise index (defined as Workplace,
1 Governance, Citizenship, Leadership and Performance).
The indices are created by multiplying each dimension
score by their respective South Africa weights.
-4
The x-axis shows the deviation of the given company’s
Enterprise index from the South Africa average.
South Africa
Products
The y-axis shows the deviation of the given company’s
-9 Product index from the South Africa average.
The line represents the average balance between the
Product and Enterprise dimensions for companies’
-14 reputation in South Africa.
The reputation of companies above the line is more
strongly influenced by the Product dimensions (is Product-
-19 centric), while the reputation of companies below the line
is more strongly influenced by the Enterprise dimensions
(is Enterprise-centric).
-24
-24 -19 -14 -9 -4 1 6
South Africa 21
21
Enterprise n = 5.806In the Marketplace Just Two Factors are at Play
PRODUCTS ENTERPRISE
22
22Who You Are Matters More than What You Do
ENTERPRISE PRODUCTS
69.1% 30.9%
% Influence on
Emotional Bond
66.0
South African Companies Overall Pulse 23
232017 Reputation Drivers
Dimension Drivers
2017 To win the support and trust of
consumers, you have to engage on all 7
3 1 dimensions:
• Each of the 7 dimensions account for
14.3% 17.5% more than 12% of reputation, except for
Workplace. So to win you need to excel
and communicate about each one of the
dimensions.
13.0% 13.4%
• The key reputation drivers: Product &
Services, Governance and Performance
explain almost 50% of reputation (47.4%).
12.9% 13.4%
• Building a company specific reputation
15.6% platform across dimensions is the key to
succeed in the reputation economy.
2 24
24Reputation Drivers Overtime
Dimension Drivers Over Time
South Africa: 2012 - 2017
22
20
18
Products & Services
16
Governance
14 Performance
Innovation
Workplace
Leadership
12
Citizenship
10
8
2012 2013 2014 2015 2016 2017
Products & Services 18,5 16,6 15,2 18,9 18,2 17,5
Innovation 15,4 15,9 14,8 15,5 13,4 13,4
Workplace 13,2 13,6 13,8 13,1 12,8 13,4
Governance 13,1 13,6 13,4 12,8 15,3 15,6
Citizenship 13,5 13,0 15,0 12,6 13,2 12,9
Leadership 12,6 12,7 12,9 12,7 13,6 13,0
Perform ance 13,7 14,7 14,8 14,4 13,5 14,3
A dj. R ² n = 0.759 0.689 0.753 0.548 0.769 0.743
n= 2,300 1,999 2,400 10,547 5,000 5,000
25
25Dimension Rankings – Winner Per Dimension
2016 vs 2017
2016 2017
Excellent/Top tier 80+
Strong/Robust 70-79
Average/Moderate 60-69
Weak/Vulnerable 40-59
Poor/Lowest tierDimension Rankings – Top 5
Products and Services Innovation Workplace
Clover Coca-Cola Coca-Cola
Coca-Cola Clover First National Bank
Nestlé First National Bank Clover
Woolw orths Nestlé Sanlam
First National Bank Pick n Pay Sasol
Governance Citizenship Leadership
Pick n Pay Clover Coca-Cola
Coca-Cola Coca-Cola Pick n Pay
Clover Pick n Pay Clover
The Spar Group Woolw orths The Spar Group
Bidvest Discovery First National Bank
Perform ance
Coca-Cola
Clover
Excellent/Top tier 80+
70-79 Pick n Pay
Strong/Robust
Average/Moderate 60-69
Nestlé
Weak/Vulnerable 40-59
Poor/Lowest tierDimension Quadrant Products &
Services
17,0
RepTrak® Dimension Importance: 2017
Score Weights
Products 66,7 17,5
Innovation 65,0 13,4
Workplace 63,1 13,4 Governance
South Africa
Governance 63,6 15,6
Citizenship 63,4 12,9
Leadership 64,2 13,0
Performance 66,9 14,3 Performance
n = 5,806
Workplace Innovation
Leadership
Citizenship
12,0
Excellent/Top tier 80+ 60,0
Strong/Robust 70-79 Lower Priority Weaknesses South Africa
Lower Priority Strengths
Average/Moderate 60-69 RepTrak® Dimension Scores: 2017
Weak/Vulnerable 40-59
Poor/Lowest tierDimension Distribution
South Africa
Dimension distribution Q1 2017
South Africa
[by dimension order] Negative (1-2) Neutral (3-5) Positive (6-7) "Not sure %" Score
Products & Services 6% 36% 55% 3% 66,7
Innovation 7% 37% 51% 4% 65,0
Workplace 6% 33% 40% 20% 63,1
Governance 7% 37% 46% 10% 63,6
Citizenship 7% 36% 44% 13% 63,4
Leadership 7% 35% 47% 11% 64,2
Performance 6% 33% 51% 11% 66,9
0% 10% 20% 30% 40% 50% 60% 70% 80% 90% 100%
n = 5.806
29
29Supportive Behaviour
2017
30RepTrak® Pulse vs. Recommend company (%) in South Africa
If a company improves its reputation by 5 points, the number of people who would recommend the company goes up by 6.3%.
90%
Willingness to support (Recommend company to others Top-two box)
Clover
80% Coca Cola
Nestlé
Woolw orths Holdings
Pick n Pay
Massmart
70% Old Mutual
Discovery
Shoprite First National Bank (FNB)
60%
Engen
Nedbank
BP Bidvest
Barlow orld
50%
South African Airways
Procter & Gamble
Telkom ABSA Momentum
40% Transnet MTN
Dial Direct
30% South African Broadcasting
Association
Excellent/Top tier 80+
Strong/Robust 70-79
Eskom South African Post Office Adj. R² = 0.92 Average/Moderate 60-69
20% 40-59
Weak/Vulnerable
25 30 35 40 45 50 55 60 65 70 75 80 85
RepTrak® Pulse Score Poor/Lowest tierSupport for the most and least reputable companies in South Africa
Top 5 vs bottom 5
The most reputable companies vs. least reputable companies
Supportive behavior distribution Negative (1-2) Neutral (3-5) Positive (6-7) Not sure Count
The 5 most reputable companies 3% 19% 77% 0% n = 499
Buy
The 5 least reputable companies 28% 38% 32% 2% n = 1.101
The 5 most reputable companies 3% 21% 76% 0% n = 499
Recommend products
The 5 least reputable companies 28% 39% 31% 2% n = 1.101
The 5 most reputable companies 2% 25% 69% 3% n = 499
Trust to do the right thing
The 5 least reputable companies 31% 37% 29% 3% n = 1.101
The 5 most reputable companies 2% 22% 76% 0% n = 499
Say something positive
The 5 least reputable companies 28% 39% 31% 2% n = 1.101
The 5 most reputable companies 3% 22% 70% 5% n = 499
Invest
The 5 least reputable companies 37% 31% 28% 4% n = 1.101
The 5 most reputable companies 2% 23% 69% 5% n = 499
Recommend as investment
The 5 least reputable companies 36% 31% 29% 4% n = 1.101
The 5 most reputable companies 8% 25% 62% 5% n = 499
Work for
The 5 least reputable companies 37% 29% 30% 4% n = 1.101
0% 20% 40% 60% 80% 100%
32
32Most Supported Companies – Top 5
Buy Negative (1-2) Neutral (3-5) Positive (6-7) Not sure Recom m end Products Negative (1-2) Neutral (3-5) Positive (6-7) Not sure
[Sorted by Positive] [Sorted by Positive]
1 Clover 1% 13% 85% 1% 1 Clover 1% 15% 84% 0%
2 Nestlé 1% 19% 80% 0% 2 Nestlé 3% 17% 80% 0%
3 Coca-Cola 4% 16% 80% 0% 3 Woolw orths 5% 18% 77% 0%
4 Woolw orths 4% 17% 79% 0% 4 Coca-Cola 5% 19% 76% 0%
5 The Foschini Group 5% 16% 77% 2% 5 The Spar Group 1% 26% 73% 0%
Trust Negative (1-2) Neutral (3-5) Positive (6-7) Not sure Say Positive Negative (1-2) Neutral (3-5) Positive (6-7) Not sure
[Sorted by Positive] [Sorted by Positive]
1 Coca-Cola 4% 19% 75% 2% 1 Coca-Cola 4% 16% 80% 0%
2 Clover 2% 19% 75% 4% 2 Clover 1% 19% 79% 1%
3 Nestlé 2% 24% 72% 2% 3 Nestlé 1% 23% 76% 0%
4 Woolw orths 5% 25% 68% 2% 4 Woolw orths 4% 20% 75% 1%
5 Old Mutual 3% 27% 67% 3% 5 Old Mutual 2% 23% 74% 1%
Invest Negative (1-2) Neutral (3-5) Positive (6-7) Not sure Recom m end as Investm ent Negative (1-2) Neutral (3-5) Positive (6-7) Not sure
[Sorted by Positive] [Sorted by Positive]
1 Coca-Cola 3% 11% 80% 6% 1 Coca-Cola 2% 13% 79% 6%
2 Old Mutual 3% 22% 72% 3% 2 Old Mutual 4% 22% 72% 2%
3 Pick n Pay 2% 23% 71% 4% 3 Nestlé 2% 24% 68% 6%
4 Clover 1% 26% 69% 4% 4 Pick n Pay 3% 26% 67% 4%
5 First National Bank 6% 25% 67% 2% 5 Clover 0% 27% 66% 7%
Work for Negative (1-2) Neutral (3-5) Positive (6-7) Not sure Benefit of Doubt Negative (1-2) Neutral (3-5) Positive (6-7) Not sure
[Sorted by Positive] [Sorted by Positive]
1 Coca-Cola 7% 20% 68% 5% 1 Clover 2% 17% 75% 6%
2 Nestlé 4% 24% 66% 6% 2 Coca-Cola 4% 24% 71% 1%
3 Bidvest 3% 28% 62% 7% 3 The Spar Group 1% 32% 66% 1%
4 Clover 7% 27% 61% 5% 4 Nestlé 5% 28% 64% 3%
5 First National Bank 8% 29% 59% 4% 5 First National Bank 6% 27% 62% 5%
Welcom e into m y Com m unity Recom m end Com pany Negative (1-2) Neutral (3-5) Positive (6-7) Not sure
Negative (1-2) Neutral (3-5) Positive (6-7) Not sure
[Sorted by Positive] [Sorted by Positive]
1 Clover 0% 13% 86% 1% 1 Clover 1% 17% 82% 0%
2 Coca-Cola 4% 12% 83% 1% 2 Coca-Cola 5% 17% 78% 0%
3 Pick n Pay 2% 23% 75% 0% 3 Nestlé 2% 19% 77% 2%
4 Woolw orths 4% 22% 73% 0% 4 Woolw orths 4% 20% 74% 2%
5 Nestlé 4% 22% 73% 1% 5 Pick n Pay 2% 24% 72% 2% 33Appendix 1 Demographics
Demographics
34Respondent Profile
South Africa 2017
Geography Gauteng 27% Gender Age Group
KwaZulu-Natal 23% 32%
Western Cape 15% 50.0% 25%
22% 21%
Eastern Cape 10%
Free State 7%
North West 6%
Mpumalanga 5%
Limpopo 4%
Northern Cape 3% 50.0% 18-24 25-34 35-44 45-64
Education Income
Race White 47% 65% 27% 34%
25%
African 33% 14%
35%
Indian/Asian 9%
Coloured 7% Low Middle High Don't
Prefer not to answer Low High Middle Income Income Income wish to
3%
education Education education answer
35
35Appendix 2 Methodology
Fielding methodology. Research design. Key analyses
and modelling techniques.
36Fielding methodology & Research design
Qualified respondents are: Adults between 18-64 who reported that they were either “Somewhat Familiar” or “Very Familiar” with one of the companies in the
study. Furthermore, respondents who are not able to give valid responses to 3 of the 4 Pulse questions are screened out.
Data collection method: Respondents filled out a 15 minute online RepTrak® questionnaire designed to measure overall corporate reputation and related
questions. The questionnaire used for this research is based on the proprietary RepTrak® model developed by Reputation Institute for analysis of corporate
reputations. Respondents were invited to participate in this project through emailed invitations sent to a carefully screened online panel managed by an
established commercial market research firm, member of ESOMAR. Respondents were randomly assigned to rate up to 5 companies in a Pulse study and 2
companies in a Deep Dive study with which they were familiar.
Fielding period: February – March, 2017
Number of respondents: A minimum of 300 respondents provided ratings for each Deep Dive and a minimum of 100 for each Pulse company in the study.
Sample representation: Responses were weighted to represent the national profile on demographics, including age and gender.
Note on Gaps: All Gaps are calculated using exact scores. Occasionally reported gaps appear to differ by 0.1 from gaps calculated between scores with one
decimal. This is due to rounding error.
Note on Sample Sizes: All sample sizes reported are based on weighted data. Occasionally the weighting procedure produces a slightly smaller or larger
sample size than the unweighted raw data otherwise would.
Note on RepTrak® Pulse Scores: The RepTrak® Pulse is calculated on the basis of the answers from the four variables that measure the respondent’s
esteem, feeling, admiration and trust (captured in the Pulse score on a 0-100 scale).
37
37Key Analysis & Modeling Techniques
RepTrak® Pulse Score
All RepTrak® analyses begin with a single reputation score (the RepTrak® Pulse) that is decomposed into a set of underlying dimensions and attributes. The
process of decomposition involves application of various forms of multivariate analyses designed to address interdependence and multicollinearity in data
obtained from cognitive research.
At the core, the RepTrak® Pulse measures reputation consisting of three questions about the emotional appeal of the company and a rating of the “Overall
Reputation” of the company. Structural Equation Modelling indicates that these four variables are a reliable indicator of the reputation construct.
• [Company] is a company I have a good feeling about
• [Company] is a company that I trust
• [Company] is a company that I admire and respect
• [Company] has a good overall reputation
Attributes were measured on 7-point scales, where 1 = Strongly Disagree and 7 = Strongly Agree.
Results are re-scaled to 100-point scale for easier interpretation.
38
38Key Analysis & Modeling Techniques
Normative Scale
Using an extensive database containing results from thousands of studies throughout the world since 1998, Reputation Institute has
Excellent/Top Tier Above 80
developed a Normative Scale (in everyday language “The Traffic Light”) that indicates whenever a particular score is high or low Strong/Robust 70-79
when benchmarked against previous studies of a similar character. Average/Moderate 60-69
Weak/Vulnerable 40-59
Poor/Bottom Tier Below 40
Driver Analysis
The relative contribution of individual dimensions to the RepTrak® Pulse is calculated from a factor adjusted regression modeling procedure. Individual
dimension weights range from 0-1, and total to 100%.
To determine drivers of reputation, the weights are developed with a Factor Adjusted Linear Regression:
Factor analysis is used to determine the unique contribution of each attribute to the variance of the RepTrak® Pulse. Equamax rotation is used to
assign the factors to the dimensions. It creates an orthogonal structure of uncorrelated variables that allows the regression to be performed without
interference from multicollinearity. It is used to maximize interpretation of the final set of regression coefficients.
Linear Regression is run using the Raw Pulse Construct as the dependent variable and the factor scores as the independent variables. Only
attributes that were found to be significantly correlated with the reputation (pReporting Results
Statistical Significance
Statistical Significance of Results Reported in RepTrak® Projects
Individual responses to questions asked in a survey enable the calculation of various statistical measures, including averages (means) and standard deviations.
The greater the number of responses used in calculating an average, the more confident we are about the accuracy of the score. Similarly, the smaller the
range of responses made to a specific question, the more confident we are about the score.
Reputation Institute reports scores with a 95% confidence interval in the surveys that we conduct. The interval describes our confidence that, if we conducted
the same study repeatedly, 95 times out of 100 the obtained score would lie within the confidence interval. It therefore describes how statistically different a
score is likely to be from another score.
If a measure is created from multiple questions, the variation in responses is reduced, and our confidence in the average obtained
from the combined questions is higher, thereby shrinking the confidence interval.
The specific formula Reputation Institute therefore uses to calculate a 95% confidence interval around the mean is therefore:
Confidence Interval = Average Score +/- 1.96 * Average Standard Deviation of Attributes / SQRT (Sample Size * # of Attributes)
Directional Scores
When analyzing subgroups and/or specific and hard-to-reach stakeholders, sample sizes will often have limited power and reliability. As the sample size shrinks,
results become directional in nature. At extremely low counts, results become unreliable and are not shown.
In this report low and insufficient counts are denoted as per below:
*Low counts (Standardizing all Reputation Scores
RepTrak® Scores - Standardized and Comparable
Market research shows that people are inclined to rate companies more or less favorably in different countries,
or when they are asked questions directly or online. When asked in a personal interview, for example, it’s known
that people tend to give a company higher ratings than when they are asked by phone, or when they are asked
to answer questions about the company online. This is a well-established source of ‘systematic bias’. Another
source of systematic bias comes from national culture - in some countries, people are universally more positive
in their responses than in other countries. In statistical terms, it means that the entire distribution of scores in a
‘positive’ country is artificially ‘shifted’ in a positive direction for all companies, good or bad. The distribution of
scores in that country may also be more ‘spread out’ than in another because people have more information and
are able to make more subtle differences between companies.
To overcome this systematic bias, Reputation Institute’s policy is to adjust all RepTrak® scores by standardizing
them against the aggregate distribution of all scores obtained from the Reputation Institute’s Annual Global
RepTrak® Pulse. Standardization has the effect of lowering scores in countries that tend to over-rate
companies, and has the effect of raising scores for companies in countries that tend to rate companies more
Two adjustments are made for every RepTrak® Score
negatively.
Reputation Institute uses its cumulative database of RepTrak® Pulse scores about reputation scores internationally to carry out two adjustments:
Country Adjustment: All scores derived from surveys are standardized by subtracting the country mean and dividing by the standard deviation of all known
scores previously obtained in that country. In statistical terms, this adjustment ‘normalizes’ the distribution of scores in the country to a mean of 0 and a standard
deviation of 1, producing a ‘z-score’ for the observation.
Global Adjustment: The ‘z-score’ obtained on the country level is then used to determine the globally adjusted score. In order to do this, the results are scaled
back by multiplying each company’s score by the global standard deviation and adding back the global mean. The resulting number is the globally adjusted
score.
As additional global research comes in, Reputation Institute regularly updates the country and global distributions that are used to create our standardized
RepTrak® scores. All RepTrak® results are therefore comparable across industries, countries, and over time. 41
41Contact Us Reputation House Parkwood - Johannesburg Phone: 0027 11 268 1559 Email: info@reputationhouse.co.za www.reputationhouse.co.za
You can also read