Progress on COVID-19: South Africa Public Health Response Minister of Health South Africa - 26th April 2020
←
→
Page content transcription
If your browser does not render page correctly, please read the page content below
Progress on COVID-19: South Africa
      Public Health Response

  Minister of Health South Africa
          26th April 2020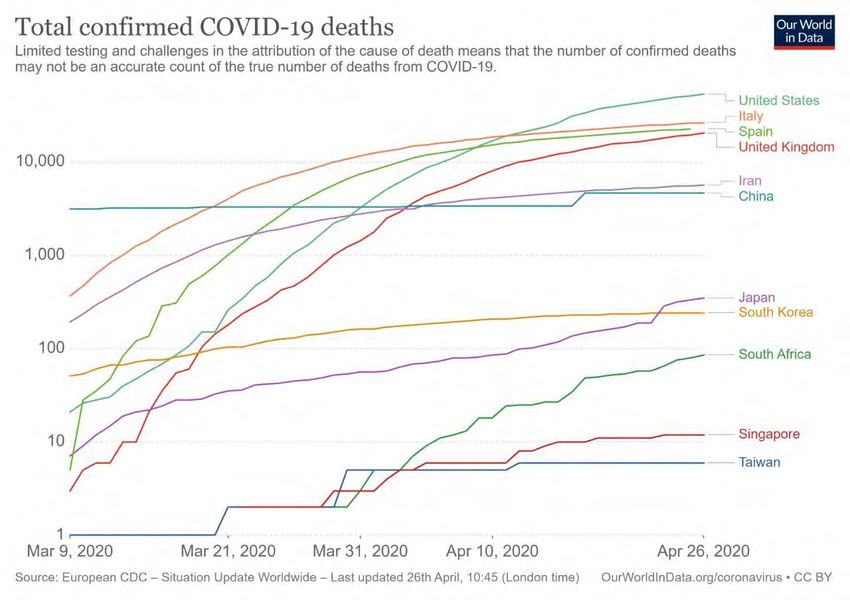
COVID-19: Global Situation
Based on SITREP 96 with data as of 24th April 2020
As reported by the WHO, the
spread of coronavirus continues to
affect more countries, consequently
registering an increase in the total
number of confirmed global cases
which is currently at 2 719 897 with
187 705 deaths (24th April 2020).
This illustrates an increase of
more than 93 567 new cases
and 6767 new deaths over 24
hours (WHO COVID-19 SITREP
96).
The European Region remains the
worst affected and the epicentre of
the pandemic reporting 1 314 666
confirmed cases with 119 463
deaths (WHO COVID-19 SITREP 96).
Source: WHO
2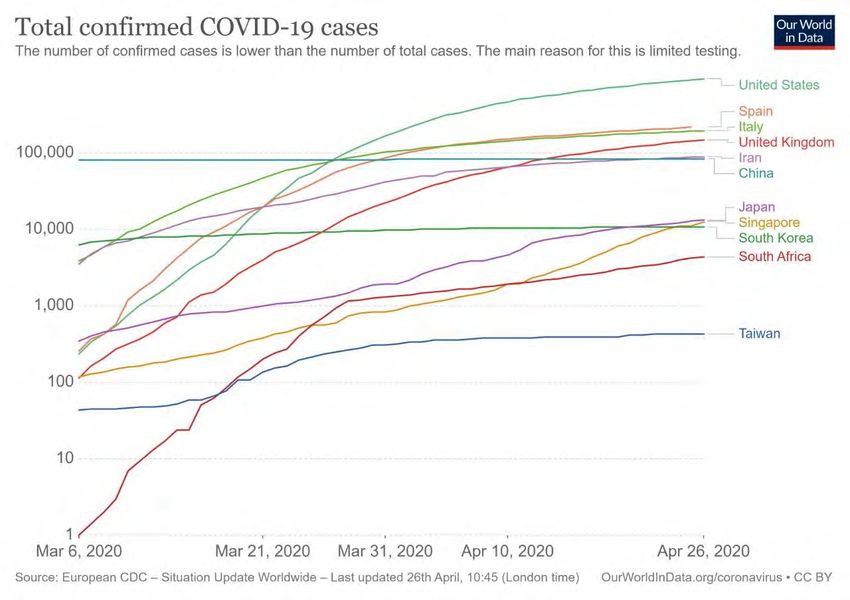
COVID-19: African Region
Based on SITREP 94 with data as of 24th April 2020
The African Region also continues to register a Total Confirmed % of Confirmed
steady increase of confirmed cases in 45 SADC Country
Cases Cases
Deaths % of Deaths
countries/territories.
South Africa 4 220 74% 79 56%
In total, the African Region reported 19 497
DRC 416 7% 28 20%
confirmed cases and 812 fatalities, illustrating
Mauritius 331 6% 9 6%
more than 1 405 new cases over 24 hours
Tanzania 300 5% 10 7%
(WHO COVID-19 SITREP 96). Madagascar 122 2% - 0%
South Africa has the highest number of cases Zambia 84 1% 3 2%
followed by Egypt and Algeria; however, both Mozambique 65 1% - 0%
Algeria and Egypt have a higher number of Zimbabwe 29 1% 4 3%
deaths. eSwatini 40 1% 1 1%
Angola 25 0% 2 1%
The SADC Region has reported 5 714 confirmed
Malawi 33 1% 3 2%
cases and 140 fatalities which is an increase of 347 Namibia 16 0% 1 1%
cases over 24 hours (WHO COVID-19 SITREP 95). Botswana 22 0% - 0%
Within SADC, South Africa has 74% of the total Seychelles 11 0% - 0%
cases and 56% of the total deaths. Total 5 714 140
3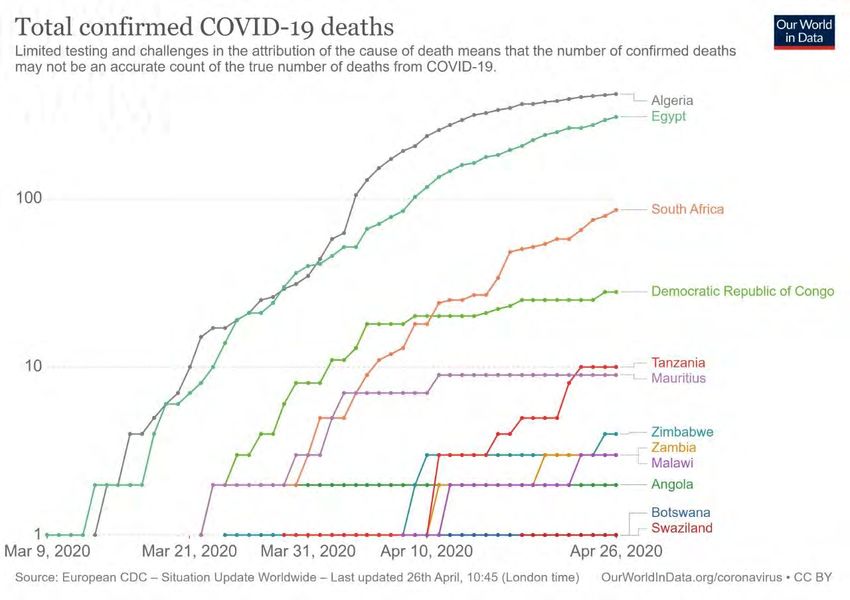
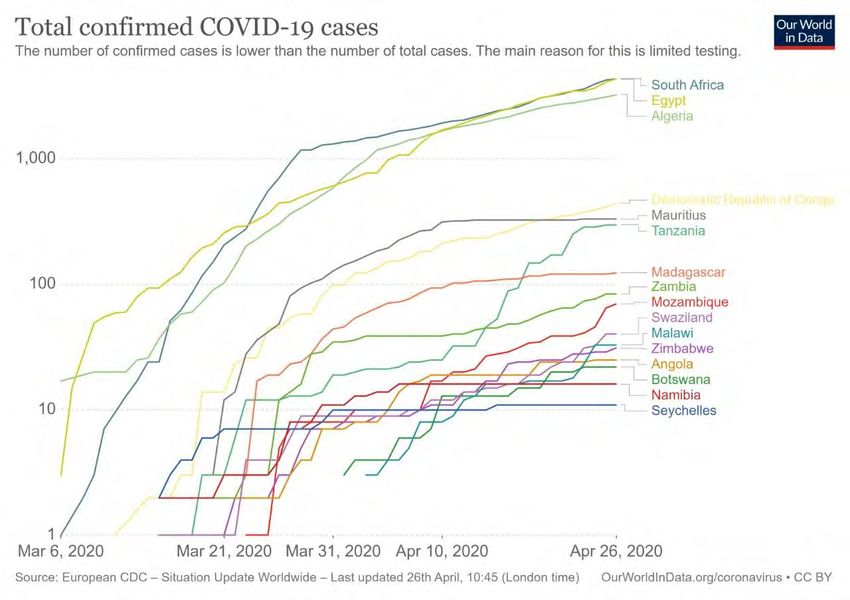
COVID-19: African Region Comparison Cases and Deaths

                                                       4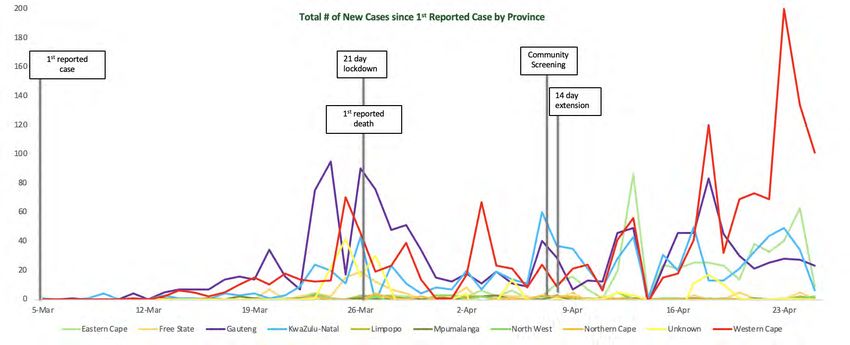
COVID-19: Global Comparison Cases and Deaths

                                               5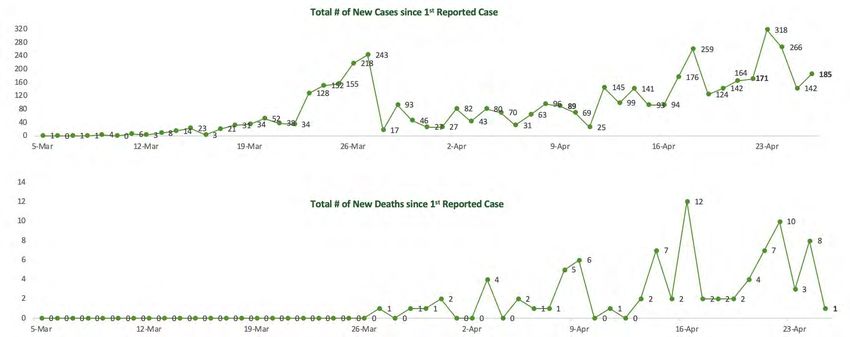
Epidemiology and Surveillance
Through and including cases through 26th of April and deaths through 25th of April
The total cumulative cases reported on 26th April 2020 is 4 546 reflecting a 4,24% increase or 185 new cases from the
25th of April 2020.
The national case fatality rate, based on deaths from 25th April is 1,9%, with the total number of deaths as of the 25th of
April at 87.
Updated Cases Post Case Fatality
Reported Cases New Cases Total Cases Deaths
Province Harmonisation % Total Cases
Rate
25 April 2020 25 April 2020 26 April 2020 26 April 2020 25 April 2020
Eastern Cape 488 489 46 535 11,8% 11 2,1%
Free State 111 110 0 110 2,4% 5 4,5%
Gauteng 1304 1303 28 1331 29,3% 8 0,6%
KwaZulu-Natal 847 847 16 863 19,0% 29 3,4%
Limpopo 30 31 0 31 0,7% 2 6,5%
Mpumalanga 23 23 0 23 0,5% 0 0,0%
North West 28 28 0 28 0,6% 0 0,0%
Northern Cape 16 16 1 17 0,4% 0 0,0%
Western Cape 1514 1514 94 1608 35,4% 32 2,0%
Unknown 0 0 0 0 0,0% 0 0,0%
Total 4361 4361 185 4546 100% 87 1,9%
6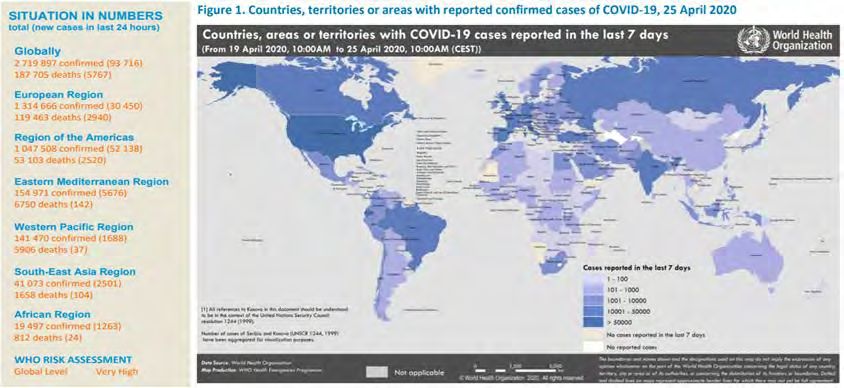
Epidemiology and Surveillance
Through and including cases through 26th of April and deaths through 25th of April

                                                                   Total Cases                          Daily New Cases                  Deaths
                                                                   26 April 2020                          26 April 2020                25 April 2020
                                                                      4546                                    185                           87

                                                                                    Free State                        Limpopo

                                                                           New Cases: 0                    New Cases: 0
                                                                           Total Confirmed Cases: 110      Total Confirmed Cases: 31
                                                                           Total Deaths: 5                 Deaths: 2

                                                                                                                                                   Gauteng
                                                                                   North West                                          New Cases: 28
                                                                                                                                       Total Confirmed Cases: 1331
                                                                           New Cases: 0                                                Total Deaths: 8
                                                                           Total Confirmed Cases: 28

                                                                                                                                                 Mpumalanga
                                           Northern Cape
                                                                                                                                       New Cases: 0
                                    New Cases: 1                                                                                       Total Confirmed Cases: 23
                                    Total Confirmed Cases: 17

                                                                                                                                              KwaZulu-Natal
                                                                                                                                       New Cases: 16
                                                                                                                                       Total Confirmed Cases: 863
                                           Western Cape                                                                                Total Deaths: 29

                                     New Cases: 94                                                                                               Eastern Cape
                                     Total Confirmed Cases: 1608
                                     Total Deaths: 32                                                                                  New Cases: 46
                                                                                                                                       Total Confirmed Cases: 535
                                                                                                                                       Deaths:11

                                                                                                                                                                     7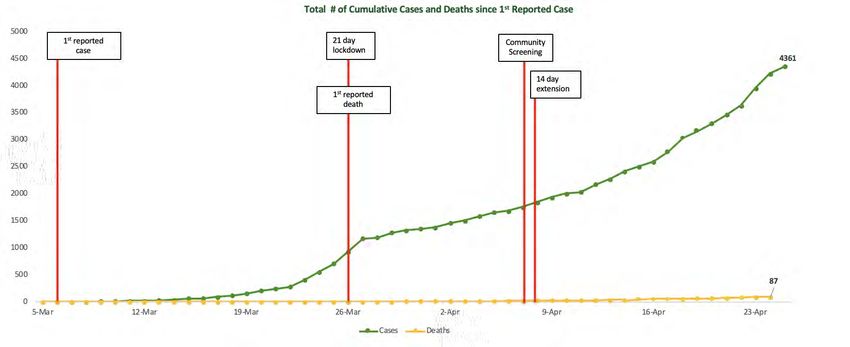
COVID-19 Cases and Deaths since 1st reported case
                                                         Total # of New Cases since 1st Reported Case

Through and including cases through 26th of April and deaths through 25th of April

                                                                                                        8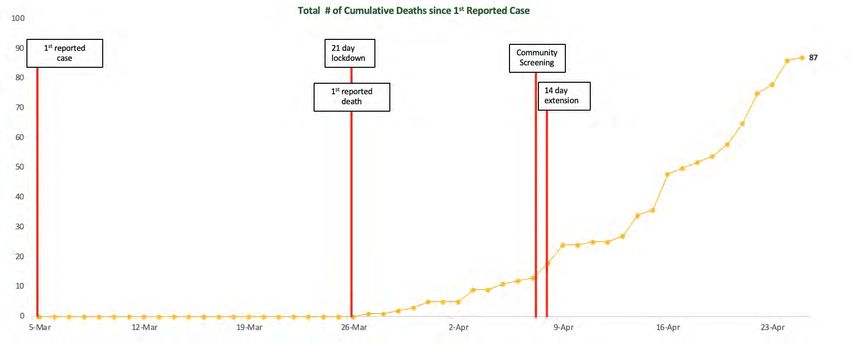
COVID-19 Deaths since 1st reported case
                                                         Total # of New Cases since 1st Reported Case

Through and including cases through 26th of April and deaths through 25th of April

                                                                                                        9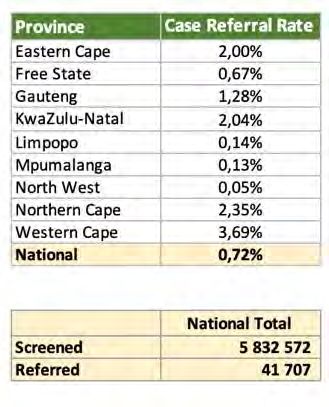
Number of Daily New COVID-19 Cases and Deaths
Through and including cases through 26th of April and deaths through 25th of April

                                                                                     10
Number of Daily New COVID-19 Cases by Province
Through and including cases through 26th of April and deaths through 25th of April
11Laboratory Service
Through and including the 25th of April
A total of 168 643 tests have been conducted
All tests
Sector Total tested New tested
PRIVATE
PUBLIC
101 099
67 544
60%
40%
3 367
4 272
44%
56%
as of 25th April 2020.
Grand Total 168 643 7 639 Of the total number of tests conducted, 7 639
Community Screen and Test new tests were performed (a decline of 975
Case-finding method Total tested New tested
Community screen and test (CST) 22 906 14% 1 854 24% tests from the 24th of April 2020) and of those
Passive case-finding
Grand Total
145 737
168 643
86% 5 785
7 639
76%
1 854 tests came from community screen and
Province Total Tests New tests
test (CST).
Eastern Cape 14054 8.3% 1115 14.6% The number of tests performed in the public
Free State 6317 3.7% 354 4.6%
Gauteng 61830 36.7% 2103 27.5% sector continues to improve and accounts for
KwaZulu-Natal
Limpopo
28265
3691
16.8%
2.2%
1978
207
25.9%
2.7%
40% of overall tests.
Mpumalanga 4385 2.6% 155 2.0%
North West 2544 1.5% 64 0.8%
Northern Cape 1314 0.8% 40 0.5%
Western Cape 33335 19.8% 1211 15.9%
Unkown 12908 7.7% 412 5.4%
Grand Total 168,643 7,639
12Number of COVID-19 tests performed by date reported
Through and including testing through 25th April
The number of new cases has increased despite a decline in test volumes over the past 4 days: 9796, 8820, 8614 and today 7639
Day-to-day fluctuations in new case numbers are difficult to interpret due to testing practices in the field and delays in testing samples.
The overall positivity (new cases/total new tested) increased from 1,6% the day before to 2,4%. Note, this also explains the increase in cases
despite the small drop in total test volumes.
Weekends are often associated with lower test volumes and cases and this is another factor.
Note, the trend over time is more reliable and valuable compared to daily numbers.
The trends in positivity rates are shown below and have been relatively stable.
Total number of new tests and cases by day Total number of new tests and positivity
12000 350 12000 5.0%
4.5%
10000 300
10000
Volumes of New Tests per day
Volumes of New Tests per day
4.0%
Total New Cases per day
250 3.5%
8000 8000
Positivity rate
200 3.0%
6000 6000 2.5%
150
2.0%
4000 4000
100 1.5%
1.0%
2000 50 2000
0.5%
0 0 0 0.0%
6 7 8 9 10 11 12 13 14 15 16 17 18 19 20 21 22 23 24 25 26 6 7 8 9 10 11 12 13 14 15 16 17 18 19 20 21 22 23 24 25 26
Date in April 2020 Date in April 2020
Private Public Cases Public Private Overall Positivity
13No. of samples
0
2000
4000
6000
8000
10000
12000
03/01
03/02
03/03
03/04
03/05
03/06
03/07
03/08
03/09
03/10
03/11
03/12
03/13
03/14
03/15
03/16
Through and including testing through 25th April
03/17
03/18
03/19
03/20
03/21
03/22
03/23
03/24
PRIVATE
03/25
21 day
lockdown
03/26
03/27
03/28
PUBLIC
03/29
Date reported
03/30
03/31
04/01
04/02
04/03
04/04
Cumulative total
04/05
04/06
04/07
04/08
Screening
04/09
Community
04/10
14 day
04/11
extension
04/12
04/13
04/14
04/15
04/16
04/17
04/18
Number of COVID-19 tests performed by date reported
04/19
04/20
04/21
04/22
04/23
04/24
04/25
0
20000
40000
60000
80000
100000
120000
140000
160000
180000
Cumulative no. of samples
14Community Screening
Through and including the 24th of April
As of 24th April, 5 832 572 individuals have been screened nationally and 41 707 have been referred for testing .
3 000 000 Number of Individuals Screened and Referred x Case Referral Rate 4.00%
3589
3.50%
2 500 000
3.00%
2 000 000
2.50%
1 500 000 2.00%
2 604 253
1.50%
1 000 000
304 1.00%
3658
9460 5946 8616
500 000 520
0.50%
546 923 592 844 4304 5310
473 125 464 674 421 538 402 492
182 773 143 950
0 0.00%
Eastern Cape Free State Gauteng KwaZulu-Natal Limpopo Mpumalanga North West Northern Cape Western Cape
# Screened # Referred Case Finding Rate
15Contact Tracing
Through and including the 25th of April
As of 25th April, a total of 19 765 contacts have been identified through contact tracing, which shows an increase of 8% from
the previous day (18 299).
The national coverage rate has increased from 89% to 91% with the Eastern Cape (87%) and the Western Cape (82%) below
the overall coverage rate.
Number of Contacts Reached vs Not Yet Reached
% Reached vs not yet % Completed 14
Province
7000 6525 reached day monitoring
Eastern Cape 87% 6%
Free State 99% 26%
6000 Gauteng 95% 51%
KwaZulu-Natal 95% 54%
5000 Limpopo 95% 66%
Mpumalanga 100% 98%
3829 North West 95% 35%
4000
Northern Cape 100% 95%
Western Cape 82% *
3000 2700
2426 2373 5342 National 91% 30%
1953
2000 3643 1283 National #
2673712 2293 Identified
19,765
1000 2116 555 623 609 484 496
368 250 237 National Total
144 529 623 460170 250 Reached
17,929
0 National Total Not
1,836
yet Reached
Eastern Cape Free State Gauteng KwaZulu-Natal Limpopo Mpumalanga North West Northern Cape Western Cape Total Complete 14
5,972
days monitoring
Total number of identified contacts Number of contacts reached (cumulative) Number of contacts that have completed 14 days’ monitoring
16Hospitalisation
Updated as of 25th of April
Number of Cases, Recoveries and Deaths
1800
1608
1600
National
1400 1331 Case 4546
Recoveries 1637
1200 Deaths 87
1000
855 863
800
600 535
400 359
244
200 110 92
25 10 5 8 29 31 24 2 23 16 0 28 14 0 17 8 0 32
0
Eastern Cape Free State Gauteng KwaZulu-Natal Limpopo Mpumalanga North West Northern Cape Western Cape
Case Recoveries Deaths
17Hospitalisation
Updated as of 25th of April
Hospitalisation Data
160
143 140
140
120
100
80 73
68
60 55
46 45 42
40
20 19 21
20 17
9 8 9 9 11 8 9
4 5 5 7
0 0 0 0 0 0 3 2 1 0 0 0 0 0 0 0 0 0 0 0 0 0 0 0 0 0 0 0 0 0 0
0
Eastern Cape Free State Gauteng KwaZulu-Natal Limpopo Mpumalanga North West Northern Cape Western Cape
Hospitalized Isolation High Care ICU Vents Oxygen
18Quarantine – Sites
Activated and Non Activated Quarantine Sites as of 25th April
Number of Activated and Not Activated Quarantine Sites
350
300
250 Province Total Sites Planned % Activated
Eastern Cape 114 0,00%
Free State 14 7,14%
200
207 Gauteng 20 38,89%
KwaZulu-Natal 50 93,75%
150 Limpopo 13 30,77%
Mpumalanga 18 11,11%
100 North West 10 50,00%
Northern Cape 21 38,10%
4
Western Cape 28 28,57%
50 114 National 288 28,13%
13 16 81
46 5
13 13 20
0 0 1 7 9
4 2 5 8 8
Activated Sites Not Activated
19Quarantine – Beds
Activated and Non Activated Quarantine Beds as of 25th April
Number of Activated and Not Activated Quarantine Beds
25000
20000 Province Total Planned Beds % Activated
Eastern Cape 4547 0,00%
Free State 1180 0,76%
14772 Gauteng 9166 64,50%
KwaZulu-Natal 915 93,41%
15000
Limpopo 921 19,87%
Mpumalanga 1385 11,62%
North West 497 28,46%
Northern Cape 1255 61,23%
10000 Western Cape 3738 48,88%
National 23604 37,42%
4290
5000
8832
1171 4876 62 738 1224 409 1947
384 1791
853 183 161 113 846
0 0 9
Eastern Cape Free State Gauteng KwaZulu-Natal Limpopo Mpumalanga North West Northern Western Cape National
Cape
Activated Beds Not Activated Beds
20Risk-adjusted strategy for economic activity What we know now There is early evidence that the full national lockdown imposed since 26 March 2020 has successfully limited the spread of the coronavirus. However, there are serious risks associated with lifting lockdown restrictions too soon, or in an unsystematic and disorderly manner.
Risk-adjusted strategy for economic activity
The balance between “lives” and “livelihoods”

Evidence from the Spanish Influenza pandemic of 1918 shows that the long-run economic consequences for
cities experiencing a rapid infection rate and high cumulative infections were significantly worse than those for
cities enduring temporary restrictions on economic activity.

"On the one hand, NPIs constrain social interactions while they are in place, and thus necessarily depress any
type of economic activity that relies on such interactions. On the other hand, because the pandemic itself has
severe economic consequences, by reducing the severity of the pandemic, NPIs can mitigate the most severe
economic disruptions. While an interruption of economic activity may be inevitable, this interruption can be
shorter-lived and less extensive with NPIs in place that solve coordination problems." (p. 17)
Risk-adjusted strategy for economic activity
An alert system with levels of restriction

Restrictions on economic activity need to be adapted to epidemiological trends, and may need to be relaxed
and tightened in different periods. An alert system should be created with clearly defined levels of restriction
that can be imposed by the National Command Council as necessary.
• If lockdown regulations are amended to allow some economic activity to resume, it is possible that the
   infection rate will accelerate and that the virus will resurge. In this scenario, it would be necessary to quickly
   revert to more stringent restrictions in order to arrest further transmission.
• An “alert system” with four to five levels would allow for flexibility and responsiveness, and would reduce the
   need to amend regulations in future.
• At each level restrictions would be more or less severe, and sectors and companies would know what activity
   is permitted depending on the level imposed at any time.
• Government would be able to switch between levels with far greater speed, and could use mass
   communications platforms (such as an SMS notification system) to signal this to the public.
• Different levels could be imposed in specific provinces and areas based on the risk of transmission.
• NB: A gradual transition between alert levels can be implemented where necessary.
• Detailed health protocols should be imposed at all levels of alert.
Risk-adjusted strategy for economic activity
    An alert system with levels of restriction

                               Level 1       Low virus spread, high health system readiness
Ongoing feedback
loop informs                   Level 2       Moderate virus spread, with high readiness
decision to remain
at a particular                              Moderate virus spread, with moderate
level, relax                   Level 3
                                             readiness
restrictions further,
or return to a                               Moderate to high virus spread, with low to
higher level of                Level 4
                                             moderate readiness
restriction.
                               Level 5       High virus spread, and/or low readiness
Risk-adjusted strategy for economic activity
Criteria for return to activity
To determine which sectors should be allowed gradually to resume activity, three criteria should be used:
1. Risk of transmission (including the ease of implementing mitigation measures)
2. Expected impact on the sector of continued lockdown (including prior vulnerability)
3. Value of the sector to the economy (e.g. contribution to GDP, multiplier effects, export
earnings)
Sectors that have a low risk of transmission (or where this risk can easily be mitigated), that would suffer most
acutely from a continued lockdown in terms of retrenchments, company failures, or loss of productive capacity
and international market share, and that have a high value to the economy should be prioritised.
These criteria should themselves be subject to an ordinal ranking of priority. Thus, sectors with a high risk of
transmission should not be allowed to resume activity until this risk is reduced, regardless of the potential impact
on their sector or their value to the economy. Among those sectors with a low or manageable risk of
transmission, considerations of impact and value can be used to attribute priority.
Low transmission risk AND severe impact OR high valueRisk-adjusted strategy for economic activity
Economic value of sector
1. GDP output at basic prices.
StatsSA, Supply and Use
Table, 2017. 2. StatsSA,
Quarterly Labour Force Survey,
2017. 3. IFC, 2018. The
Unseen Sector: A Report on
the MSME Opportunity in
South Africa. PPGI Industry
Survey. 4. . StatsSA, Supply and
Use Table, 2017. 5. Self reported
data from PPGI industry
survey. 6. ILO. Accessed from:
https://www.bangkokpost.com/w
orld/1819629/s-africa-still-
hobbled-by-abusive-legacy-of-
domestic-workRisk-adjusted strategy for economic activity
Expected impact of continued lockdown
0 – 20% 61 – 80% Proportion of the pre-crisis industry
Proportion of payroll that is likely to be Proportion of large firms in your Proportion of SMEs in your industry
workforce that is likely to be
21 – 40% 81 – 100% paid at the end of May (%) industry that are likely to close (%) that are likely to close (%)
retrenched (%)
41 – 60%
Agriculture and food supply 75 25 15 35
Automotive 85 5 0 5
Banking 85 5 0 0
Chemicals 85 15 15 45
Construction 15 25 15 35
Creative - arts, music 5 15 5 65
Creative - film 45 55 0 5
Defence industry / Aerospace 55 35 15 25
Fibre optic 65 35 0 45
Fleet management 75 0 0 0
Forestry 75 25 5 25
Gas and oil 85 5 0 5
Global Business Services 55 25 15 25
ICT and digital 75 15 5 25
Long term Insurance 85 5 0 25
Manufacturing 85 5 0 15
Mining 5 15 5 45
Oceans 5 5 0 15
Online Retail 55 35 15 25
Pharmaceutical 85 15 5 15
Professional services 85 5 0 15
Renewable energy 45 25 5 35
Retail (clothing) 55 25 25 55
Retail (Food) 85 5 0 15
Retail (takeaways) 65 15 25 35
Short term insurance 85 5 0 5
Source: Self reported data from PPGI
industry survey, Genesis Analytics 2020 Tourism 5 55 25 75
Transport (Aviation) 35 45 45 65Risk-adjusted strategy for economic activity
Considerations for first phase of easing restrictions
Consideration Description
Low transmission risk Economic activity can resume with low transmission risk
or
Economic activity can resume under conditions whereby transmission risks can be
effectively managed
Regulated and organised Precedent of good compliance and enforcement of regulations in sector
and/or
Industry bodies / unions / lead firms can support coordination of sector response
Localised / low movement Economic activity can resume with no/minimal movement across provincial borders
of people and between rural and urban areas, and movement is limited to low risk geographies
Enabling of other sectors or Resumption of economic activity is crucial for the effective functioning of a sector that
essential services produces, distributes or sells goods / services designated as essential or other sectors
prioritised for openingRisk-adjusted strategy for economic activity Post-lockdown: General exclusions The following restrictions will remain in place after the national lockdown, and regardless of the level of alert at any given time: • Sit-in restaurants and hotels • Bars and shebeens • Conference and convention centres • Entertainment venues, including cinemas, theatres, and concerts • Sporting events • Religious, cultural and social gatherings No gatherings of more than 10 people outside of a workplace will be permitted. Passengers on all modes of transport must wear a cloth mask to be allowed entry into the vehicle. Hand sanitisers must be made available, and all passengers must sanitise their hands before entering. Public transport vehicles must be sanitised on a daily basis.
Risk-adjusted strategy for economic activity
Rules applicable across all levels

 The following rules will be imposed across all sectors and alert levels:

 • Industries are encouraged to adopt a work-from-home strategy where possible, and all staff who can
   work remotely must be allowed to do so.
 • Workers above the age of 60, as well as workers with comorbidities identified by the Department of
   Health should be offered a work-from-home option or allowed to remain on leave with full pay.
 • There should be workplace protocols in place that would include disease surveillance and prevention of
   the spread of infection.
 • All employers to screen staff on a daily basis for symptoms of COVID-19, including a symptom check as
   well as temperature assessment.
 • All employees to use a cloth mask especially where social distancing is not possible.
 • Work environment to have sanitisers available or hand washing facilities with soap.
 • Stringent social distancing measures should be implemented in the workplace.

 The Department of Health will issue a comprehensive guidance note stipulating health and safety
 practices for returning to work.
Risk-adjusted strategy for economic activity
Additional rules pertaining to sectors and firms

 Before any sector resumes activity, the following conditions must be in place:

 • In addition to generally applicable health and safety protocols, each sector must agree upon a COVID-
   19 prevention and mitigation plan with the Minister of Employment and Labour, the Minister of Health
   and any other Minister relevant to the sector.
 • Individual businesses or workplaces must have COVID-19 risk assessments and plans in place, and must
   conduct worker education on COVID-19 and protection measures:
     o Identification and protection of vulnerable employees
     o Safe transport of employees
     o Screening of employees on entering the workplace
     o Prevention of viral spread in the workplace:
     o Cleaning of surfaces and shared equipment
     o Good ventilation
     o Managing sick employees
 • Monitoring systems must be in place to (1) ensure compliance with safety protocols and (2) identify
   infections among employees
Risk-adjusted strategy for economic activity
Governance framework
• Levels of alert (1-5) will be determined by the National Command Council at each meeting, upon a
recommendation from the Minister of Health and the Minister of Trade and Industry. A single national alert
level may be determined, or an alert level may be determined for each province.
• The highest burden of the disease is currently concentrated in Gauteng, Western Cape, KwaZulu-Natal and
Eastern Cape. The remaining provinces have a limited number of cases.
• Within the provinces the infection is concentrated largely in the metro areas.
• Given the disproportionate distribution of infections there is an opportunity to have a differentiated
approach to the lockdown based on the geographic distribution.
• The initial plan is to determine alert levels at a provincial level based on the number of cases in each
province.
• Individual Ministers, upon consultation with and approval from the Minister of Health, may provide for
exceptions and additional directions in sectors within their domain.
• A working committee should be established comprising officials from the Department of Health and the
Department of Trade and Industry to consider changes to the sector restrictions as they are required.You can also read