TOWNSVILLE NORTH QUEENSLAND QUARTERLY ECONOMIC SNAPSHOT - JULY 2021 - AWS

Page created by Sue Anderson
 
CONTINUE READING
TOWNSVILLE NORTH QUEENSLAND QUARTERLY ECONOMIC SNAPSHOT - JULY 2021 - AWS
Townsville North Queensland Economic Snapshot – July 2021

TOWNSVILLE NORTH QUEENSLAND
QUARTERLY ECONOMIC SNAPSHOT

                 JULY 2021

 MAJOR SPONSOR

                                  MAJOR SPONSOR

 1
TOWNSVILLE NORTH QUEENSLAND QUARTERLY ECONOMIC SNAPSHOT - JULY 2021 - AWS
Townsville North Queensland Economic Snapshot – July 2021

TOWNSVILLE NORTH QUEENSLAND                                                                                                JULY 2021
QUARTERLY ECONOMIC SNAPSHOT
The Townsville North Queensland Economic Snapshot provides a regional economic outlook and
commentary with key quarterly statistics including unemployment, business confidence, building
approvals, property, and tourism.

This edition breaks down the Townsville North Queensland region into two Statistical Areas (SA): Townsville SA3
and Charters Towers – Ayr – Ingham SA3.

        1              OUTLOOK FOR NORTH QUEENSLAND

1.1         Key Macroeconomic Trends
It has been roughly a year since COVID-19 was declared a global pandemic, impacting economies on a scale
and nature we have not experienced before. We now have a stronger perception about the recovery, largely
resulting from the global rollout of the COVID-19 vaccine. The International Monetary Fund (IMF) forecasts an
increase in global growth of 6% in 2021 and 4.4% in 2022, which is approximately 0.8 percentage points and 0.2
percentage points higher than what was projected in October 2020 (IMF, 2021)1. This growth is centred around
the considerable economic stimulus measures that are being implemented by governments around the world.

The Australian dollar has been showing sign s of appreciation against the US dollar, with National Australia Bank
and Westpac projecting the Australian dollar to reach $0.80 USD towards the second half of 2021 (Australian
Financial Review, 2020)2. The appreciation of the dollar combined with increasing commodity prices including
iron ore, coal and copper provides a positive outlook for Australia.

The ongoing trade tensions between Australia and China provide some uncertainties for exports, with
restrictions being implemented on beef, barley, wine, timber and coal. However, Australia is the dominant
supplier of iron ore to China and is likely to be necessary for China’s supply into the future. Further, other
significant events in global trade from South America, such as Brazil’s poor export performance and
Argentina’s temporary ban on beef exports (as a measure to reduce domestic prices) and are likely to
benefit Australia’s exporters.

The outlook for Australia is relatively stable, entering a phase of recovery with a decrease in the unemployment
rate, strengthening of the housing market and GDP growth (IMF, 2021).

1
 (2021). World Economic Outlook – April 20210. Retrieved from https://www.imf.org/en/Publications/WEO/Issues/2021/03/23/world-economic-outlook-
april-2021
2
 Financial Review (2020). Australian dollar could surge as high as US 85c. Retrieved from https://www.afr.com/markets/currencies/australian-dollar-to-
surge-as-high-as-us85-20201218-p56om8

                                                                                            MAJOR SPONSOR

    2
TOWNSVILLE NORTH QUEENSLAND QUARTERLY ECONOMIC SNAPSHOT - JULY 2021 - AWS
Townsville North Queensland Economic Snapshot – July 2021

1.2           Regional Outlook
Townsville remains resilient, with a positive outlook regarding economic recovery efforts. Business confidence
still remains high into the June 2021 quarter, even with the ending of the JobKeeper and JobSeeker stimulus
packages. A number of businesses are either looking to remain at current employment numbers or increase
employment over the next quarter. This is positive signs for the Townsville North Queensland labour force,
having the potential to further decrease Townsville North Queensland’s unemployment rate throughout 2021.

Tourism, Hospitality and Events sector continues to feel the greatest impact from the pandemic. From the
December 2019 quarter to the December 2020 quarter, domestic overnight visitor expenditure for the Townsville
North Queensland region has declined by 34.8% and overall visitation declined by 38.6%. Sharp declines were
recorded across all reasons for travel, with Holiday visitation decreasing by 31.8% over the year to 275,000;
visiting friends and relatives decreased by 46.5% to 212,000 and business visitation decreased by 40.5% to
224,000. Post December 2020, the industry started to experience a strong recovery with accommodation
occupancy on a strong growth trajectory. More recent border closures and lockdowns are anticipated to impact
future occupancy and visitation data.

The residential property market in the region remains tight due to regional migration from southern capital
cities, with extremely low vacancy rates and an upward pressure placed on rental prices. As of December
2020, Townsville’s vacancy rate dropped to one of the lowest rental vacancies experienced, 0.7% (REIQ, 2020)3.
It is expected that Townsville will see a slight relief towards the end of 2021, with a supply increase due to the
Government stimulus from the first home builders grant and an increase in investors entering the market
(Herron Todd White, 2021).

3
     EIQ (2021). Brisbane rentals bounce back, Gold Coast hits record lows and 90% regional vacancies tighten further.
    R
    Retrieved from https://www.reiq.com/articles/vacancy-rate-report-dec-20/

                                                                                                MAJOR SPONSOR

       3
Townsville North Queensland Economic Snapshot – July 2021

          1.3                                       Agriculture

          Sugar
          In February 2021, sugar prices rose to $460/Metric Tonne which is higher than the long-term average. These
          prices are also higher than what has been experienced throughout the initial impact of COVID-19 from March
          2020, with prices increasing throughout the back of 2020. The current sugar price is the highest that has been
          experienced over the period of a year, with an upward trend in future prices expected into 2022.

          Currently, sugar prices are being impacted in a number of ways, including:

                                           Strengthening of the Australian dollar which is placing downward pressure on sugar prices
                                           Decreasing ethanol prices in Brazil resulting partially from COVID-19 restrictions. For production in Brazil to
                                           favour sugar, prices need to stay at a more attractive premium to ethanol
                                           Poor rains for Brazil’s 2021 sugarcane crop
                                           Additional lockdowns in India have the potential to decrease domestic sugar demand

          The price outlook is currently not positive for Australian producers as the futures markets driven by a number of
          factors, mainly the strengthening on the Australian dollar.

          Figure 1.1. Raw Sugar Prices (AU$/MT Actual)                                              Source: Index Mundi (2021). 4

                                               700

                                               600
        Raw Sugar Prices (AU$/MT Actual)

                                               500

                                               400

                                               300

                                               200

                                               100

                                                 0
                                                     Aug-19
                                                     Jun-16
                                                     Aug-16

                                                     Jun-17
                                                     Aug-17

                                                     Jun-18
                                                     Aug-18

                                                     Jun-20
                                                     Aug-20
                                                     Oct-15
                                                     Dec-15

                                                     Apr-16

                                                     Oct-16
                                                     Dec-16

                                                     Apr-17

                                                     Oct-17
                                                     Dec-17

                                                     Apr-18

                                                     Oct-18
                                                     Dec-18

                                                     Jun-19
                                                     Apr-19

                                                     Oct-19
                                                     Dec-19

                                                     Apr-20

                                                     Oct-20
                                                     Dec-20
                                                     Feb-16

                                                     Feb-17

                                                     Feb-18

                                                     Feb-19

                                                     Feb-20

                                                     Feb-21

          Beef
           $14,000

          After a period of impacts to the red meat industry with bushfires, drought, floods and a global pandemic, the
            $12,000 cattle herd is expected to increase by 2% in 2021 (MLA, 2021a)5. The projected increase comes due to a
          national
          rebuilding phase throughout 2021 as graziers retain more breeding stock.
Copper Prices (AU$/MT)

                             $10,000

                                           $8,000
          4
                      I ndex Mundi (2021). Sugar Monthly Price – Australian Dollar per Kilogram. Retrieved from https://www.indexmundi.com/
                       commodities/?commodity=sugar&months=60&currency=aud
                                           $6,000
          5
                       LA (2021a). Industry Projections 2021 – Australian Cattle. Meat and Livestock Australia. Retrieved from https://www.mla.com.au/globalassets/mla-
                      M
                      corporate/prices--markets/documents/trends--analysis/cattle-projections/feb2021-mla-australian-cattle-industry-projections.pdf
                                           $4,000

                                                                                                                 MAJOR SPONSOR
                                           $2,000
                                           4
                                               $0
                                                    ul-16

                                                    ul-17

                                                    ul-18

                                                    ul-19

                                                    ul-20
                                                    p-16
                                                     v-16
                                                    n-17

                                                    p-17
                                                     v-17
                                                    n-18

                                                     v-18
                                                    n-19

                                                     v-19
                                                    n-20

                                                     v-20
                                                    n-21
                                                    p-18

                                                    p-19

                                                    p-20
                                                     y-16

                                                     r-17
                                                     y-17

                                                     r-18
                                                     y-18

                                                     r-19
                                                     y-19

                                                     r-20
                                                     y-20

                                                     r-21
Townsville North Queensland Economic Snapshot – July 2021

    The retention of cattle on farms is expected to result in a decrease in slaughter of cattle and calves at 3% and 7%
    respectively (MLA, 2021a). Prices are rather high, reaching approximately 270c/kg lwt in April 2021. These high
    prices have the potential to incentivise graziers to feed for a longer period of time to achieve a higher return per
    head (MLA, 2021a).

    Export levels are also projected to increase by 2% in 2021 with the easing of COVID-19 restrictions in some
    markets. Throughout 2020, the beef cattle industry was impacted by the decrease in the food service industry
    and market access issues with logistical challenges.

    Figure 1.2. Queensland Saleyard Indicators (Sale Price – Medium Cow)                                                                                                                                                                                                                           Source: MLA (2021b).6

                                      350

                                      300
  Price (c/kg lwt)

                                      250

                                      200

                                      150

                                      100

                                       50

                                        0
                                                                Jul-15

                                                                                                    Jul-16

                                                                                                                                        Jul-17

                                                                                                                                                                            Jul-18

                                                                                                                                                                                                                Jul-19

                                                                                                                                                                                                                                                    Jul-20
                                              Jan-15

                                                                                  Jan-16

                                                                                                                      Jan-17

                                                                                                                                                          Jan-18

                                                                                                                                                                                              Jan-19

                                                                                                                                                                                                                                  Jan-20

                                                                                                                                                                                                                                                                      Jan-21
                                                       Apr-15

                                                                         Oct-15

                                                                                           Apr-16

                                                                                                             Oct-16

                                                                                                                               Apr-17

                                                                                                                                                 Oct-17

                                                                                                                                                                   Apr-18

                                                                                                                                                                                     Oct-18

                                                                                                                                                                                                       Apr-19

                                                                                                                                                                                                                         Oct-19

                                                                                                                                                                                                                                           Apr-20

                                                                                                                                                                                                                                                             Oct-20

                                                                                                                                                                                                                                                                               Apr-21

    Figure 1.3. Live Export Trade from Townsville
                                 $3,000
                        400,000

                                 $2,500

                        300,000
                        Ounce)
               Traded (Head)

                                 $2,000
       Prices (AU$/Troy

                        200,000
                         $1,500
  GoldVolume

                                 $1,000
                        100,000

                                     $500
                                          0
                                              Nov-162016

                                              Sep-172017

                                                     2018

                                               Jul-192019

                                              May-202020

                                                                                                                                                                                                                                                                  2021

                                       $0
                                               Jul-16

                                               Jul-17

                                               Jul-18

                                              Jan-20

                                               Jul-20

                                              Jan-21
                                              Jan-17

                                              Nov-17
                                              Jan-18

                                              Nov-18
                                              Jan-19

                                              Nov-19

                                              Nov-20
                                              May-16

                                              Sep-16

                                              Sep-18

                                              Sep-19

                                              Sep-20
                                              Mar-17
                                              May-17

                                              Mar-18
                                              May-18

                                              Mar-19
                                              May-19

                                              Mar-20

                                              Mar-21

                                                                                                               Vietnam                            Indonesia                             Other

     Note: Latest data available until March 2021. Source: Department of Agriculture (2021).7
                    140,000                                                                                                                                                                                                                                           16.8%
    6
             MLA (2021b). Meat Livestock Australia. Retrieved from https://www.mla.com.au/
    7
              epartment of Agriculture (2021). All Livestock Exports. Retrieved from https://www.agriculture.gov.au/export/controlled-goods/live-animals/live-
             D
               120,000                                                                                                   14.4%
             animal-export-statistics/livestock-exports-by-market

                    100,000                                                                                                                                                                                                                                           12.0%
                                                                                                                                                                                                                                                                                        Unemployment Rat

                                                                                                                                                                                                                                  MAJOR SPONSOR
Persons (No.)

                                 80,000                                                                                                                                                                                                                               9.6%
                                 5

                                 60,000                                                                                                                                                                                                                               7.2%
Raw Sugar Prices (AU$/MT A
                                        400

                                                                          Townsville North Queensland Economic Snapshot – July 2021
                                        300

Copper
                                        200
Since May 2020, Copper prices have been increasing exponentially, from approximately $8,000/MT to over
$12,000/MT in April 2021. Demand for copper is high due to a number of reasons including COVID-19 government
       100
stimulus measures and a global transition to cleaner energy technology as countries look to reduce their
emissions. There are also a number of factors influencing the supply of copper, such as logistics and supply chain
         0
disruptions from COVID-19.

                                              Aug-19
                                              Jun-16
                                              Aug-16

                                              Jun-17
                                              Aug-17

                                              Jun-18
                                              Aug-18

                                              Jun-19

                                              Jun-20
                                              Aug-20
                                              Oct-15
                                              Dec-15

                                              Apr-16

                                              Oct-16
                                              Dec-16

                                              Apr-17

                                              Oct-17
                                              Dec-17

                                              Apr-18

                                              Oct-18
                                              Dec-18

                                              Apr-19

                                              Oct-19
                                              Dec-19

                                              Apr-20

                                              Oct-20
                                              Dec-20
                                              Feb-16

                                              Feb-17

                                              Feb-18

                                              Feb-19

                                              Feb-20

                                              Feb-21
Figure 1.4. Copper (Grade A Cathode) Price (per Metric Tonne)                                                     Source: Index Mundi (2021). 8

                         $14,000

                         $12,000
Copper Prices (AU$/MT)

                         $10,000

                                     $8,000

                                     $6,000

                                     $4,000

                                     $2,000

                                        $0
                                               Jul-16

                                               Jul-17

                                               Jul-18

                                               Jul-19

                                               Jul-20
                                              Sep-16
                                              Nov-16
                                              Jan-17

                                              Sep-17
                                              Nov-17
                                              Jan-18

                                              Sep-18
                                              Nov-18
                                              Jan-19
                                              May-16

                                              Mar-17
                                              May-17

                                              Mar-18
                                              May-18

                                              Sep-19
                                              Nov-19
                                              Jan-20

                                              Sep-20
                                              Nov-20
                                              Jan-21
                                              Mar-19
                                              May-19

                                              Mar-20
                                              May-20

                                              Mar-21

8
        I ndex Mundi (2021). Copper – Australian Dollar per Metric Tonne. Retrieved from https://www.indexmundi.com/
         commodities/?commodity=copper&months=60&currency=aud

                                                                                                  MAJOR SPONSOR

                              6
150

                                    100                                                                                                                                 Townsville North Queensland Economic Snapshot – July 2021

 Gold                                50
 Gold prices have been on the rise since the on-set of COVID-19 as a “safe” investment option, compared
 to shares,
         0 bonds and cash. In August 2020, gold prices peaked at $2,735/Troy Ounce, however, has since

                                                            Jul-15

                                                                                                Jul-16

                                                                                                                                    Jul-17

                                                                                                                                                                        Jul-18

                                                                                                                                                                                                            Jul-19

                                                                                                                                                                                                                                                Jul-20
                                          Jan-15

                                                                              Jan-16

                                                                                                                  Jan-17

                                                                                                                                                      Jan-18

                                                                                                                                                                                          Jan-19

                                                                                                                                                                                                                              Jan-20

                                                                                                                                                                                                                                                                  Jan-21
                                                   Apr-15

                                                                     Oct-15

                                                                                       Apr-16

                                                                                                         Oct-16

                                                                                                                           Apr-17

                                                                                                                                             Oct-17

                                                                                                                                                               Apr-18

                                                                                                                                                                                 Oct-18

                                                                                                                                                                                                   Apr-19

                                                                                                                                                                                                                     Oct-19

                                                                                                                                                                                                                                       Apr-20

                                                                                                                                                                                                                                                         Oct-20

                                                                                                                                                                                                                                                                           Apr-21
 experienced a decline, decreasing to 42,286/Troy Ounce in April 2021 as global markets have steadied.

 Figure 1.5. Gold Price (per Troy Ounce)                                                                                                                         Source: Index Mundi (2021). 9

                               $3,000

                               $2,500
Gold Prices (AU$/Troy Ounce)

                               $2,000

                               $1,500

                               $1,000

                                   $500

                                     $0
                                           Jul-16

                                           Jul-17

                                           Jul-18

                                           Jul-19

                                          Jan-20

                                           Jul-20

                                          Jan-21
                                          Nov-16
                                          Jan-17

                                          Nov-17
                                          Jan-18

                                          Nov-18
                                          Jan-19

                                          Nov-19

                                          Nov-20
                                          May-16

                                          Sep-16

                                          Sep-17

                                          Sep-20
                                          Mar-17
                                          May-17

                                          Mar-18
                                          May-18

                                          Sep-18

                                          Mar-19
                                          May-19

                                          Sep-19

                                          Mar-20
                                          May-20

                                          Mar-21

 Recent reporting also indicated that Australian gold output has increased to levels comparable with China (the
 world’s largest gold producer). In the March 2021 quarter, it was estimated that China produced 74.44 tonnes of
 gold while Australia recorded a production of 74 tonnes (ABC, 2021). 10

 9
           Index mundi (2021). Gold Monthly Price. Retrieved from https://www.indexmundi.com/commodities/?commodity=gold&months=60&currency=aud
 10
                 BC (2021). Australia gives China a run as world’s biggest gold producer, with top spot up for grabs. Retrieved from https://www.abc.net.au/
                A
                news/2021-05-31/australia-challenging-china-as-world-s-biggest-gold-producer/100178322

                                                                                                                                                                                                                              MAJOR SPONSOR

                               7
Townsville North Queensland Economic Snapshot – July 2021

                         2                           KEY QUARTERLY INDICATORS

2.1                           Labour Market
                 400,000
Since June 2020, Queensland have been experiencing an increase in their unemployment rate while both
the Townsville and Charters Towers – Ayr – Ingham SA3 have been experiencing a decline in unemployment.
Queensland’s
   300,000     unemployment rate grew from 6.4% in June 2020 to 7.1% in December 2020, while Townsville
  Volume Traded (Head)

experienced a decline of 1-percentage points and Charters Towers – Ayr – Ingham experienced a 2-percentage
point decline.
   200,000
This highlights the resilience of the labour market in the Townsville North Queensland region compared to the
overall State. To date, the region has weathered the impacts of COVID-19 well, it has even been outperforming
our pre-COVID-19 unemployment levels. This is a testament to the resilience of the region and our ability to
   100,000
bounce back after significant economic hits (i.e., the Townsville floods and the COVID-19 pandemic).

Business confidence surveying highlights positive signs for the regional labour market. The survey highlights
that 94% 0
         of respondents will either remain at current employment levels or will look to expand in the next three
                                                     2016

                                                                                        2017

                                                                                                                        2018

                                                                                                                                                         2019

                                                                                                                                                                                           2020

                                                                                                                                                                                                                               2021
months from June 2021.
                                                                                             Vietnam                        Indonesia                       Other

Figure 2.1. Labour Force Activity                                                                                    Source: DoESE (2020). 11

               140,000                                                                                                                                                                                                         16.8%

               120,000                                                                                                                                                                                                         14.4%

               100,000                                                                                                                                                                                                         12.0%   Unemployment Rate (%)
Persons (No.)

                         80,000                                                                                                                                                                                                9.6%

                         60,000                                                                                                                                                                                                7.2%

                         40,000                                                                                                                                                                                                4.8%

                         20,000                                                                                                                                                                                                2.4%

                             0                                                                                                                                                                                                 0.0%
                                                                                                                                                                                                                      Dec-20
                                  Dec-10
                                           Jun-11
                                                    Dec-11
                                                             Jun-12
                                                                      Dec-12
                                                                               Jun-13
                                                                                        Dec-13
                                                                                                 Jun-14
                                                                                                          Dec-14
                                                                                                                   Jun-15
                                                                                                                            Dec-15
                                                                                                                                     Jun-16
                                                                                                                                              Dec-16
                                                                                                                                                       Jun-17
                                                                                                                                                                Dec-17
                                                                                                                                                                         Jun-18
                                                                                                                                                                                  Dec-18
                                                                                                                                                                                           Jun-19
                                                                                                                                                                                                    Dec-19
                                                                                                                                                                                                             Jun-20

                                                                               Charters Towers - Ayr - Ingham SA3 Labour Force
                                                                               Townsville SA3 Labour Force
                                                                               Townsville SA UR

11
       DoESE (2020). Small Area Labour Markets Publication - September Quarter 2020. Department of Education, Skills and Employment

                                                                                                                                                                                              MAJOR SPONSOR

                    8
Townsville North Queensland Economic Snapshot – July 2021

2.2         Property
The property market in Townsville continues to remain strong with residential building value up by 54% on levels
last year. Residential building approvals were strong in the month of February 2021, reaching Townsville’s highest
number of dwellings recorded for a single month since June 2015. Non-residential building value on the other
hand has experienced a decline since January 2021, reaching $7.5 million for the month of February 2021. This is
the lowest monthly value experienced since March 2020.

Building activity in the Charters Towers – Ayr – Ingham SA3 is down from levels last year, however, has shown
strong signs of recovery in the last quarter. From December 2020 to February 2021, residential building value
increased by 65% while residential building volume experienced and 22% increase. There has also been a slight
increase in non-residential building activity in the region, increasing by over 550% from January to February 2021
(approximately $0.4 million).

A property market report from Herron Todd White12 have indicated that throughout 2020, the residential market
in Townsville tightened to a point of shortage compared to the level of demand. This resulted in extremely low
vacancy rates and an upward pressure placed on rental prices. It is expected that Townsville will see a slight
relief towards to end of 2021, with a supply increase due to the Government stimulus from the first home
builders grant and an increase in investors entering the market (Herron Todd White, 2021).

The report also highlights the mining industry activity is supporting the industrial market in the Townsville
region, with strong demand for southern investor interest in purpose built facilities (Herron Todd White, 2021).

Table 1.1. Building Approval Activity –
Movement from Year Ending Feb 2019 to Year Ending Feb 2021

                                                         Residential                     Residential                 Non-Residential
   Indicators
                                                      Dwelling Units (No.)           Building Value ($'M)           Building Value ($'M)

   Townsville

   Townsville 12 Months to Feb 21                                832                             $298                         $232

   Townsville 12 Months % Change                                 68%                              54%                         -42%

   Charters Towers - Ayr - Ingham

   Charters Towers - Ayr - Ingham                                 73                              $35                          $19

   12 Months to Feb 21                                           -6%                               2%                         -39%

   Queensland

   Queensland 12 Month % Change                                  12%                              13%                         -16%

Notes: (a) 12 Months to February 2021. (b) 12 Months % Change. Source: QGSO (2021).

   Herron Todd White (2021). March 2021 Property Report. Retrieved from https://static.htw.com.au/HTW-month-in-review-March-2021-Residential.pdf
12 

                                                                                          MAJOR SPONSOR

       9
Townsville North Queensland Economic Snapshot – July 2021

                Figure 2.2. Building Approvals (Townsville SA3) – Mar 2019 to Feb 2021                                                                                                                                                                                                         Source: QGSO (2021). 13
                $120                                                                                                                                                                                                                                   120

                $100                                                                                                                                                                                                                                   100

                                                                                                                                                                                                                                                             Residential Volume (No.)
                     $80                                                                                                                                                                                                                               80
$ Million

                     $60                                                                                                                                                                                                                               60

                $120
                 $40                                                                                                                                                                                                                                   120
                                                                                                                                                                                                                                                       40

                $100
                 $20                                                                                                                                                                                                                                   100
                                                                                                                                                                                                                                                       20

                                                                                                                                                                                                                                                             Residential Volume (No.)
                     $80
                      $0                                                                                                                                                                                                                               80
                                                                                                                                                                                                                                                       0
$ Million

                                                                 Jul-19

                                                                                                                                                                             Jul-20
                                                        Jun-19

                                                                                                     Nov-19
                                                                                                              Dec-19
                                                                                                                       Jan-20

                                                                                                                                                                    Jun-20

                                                                                                                                                                                                                 Nov-20
                                                                                                                                                                                                                          Dec-20
                                                                                                                                                                                                                                   Jan-21
                                                                                            Oct-19

                                                                                                                                                                                      Aug-20
                                                                                                                                                                                               Sep-20
                                                                                                                                                                                                        Oct-20
                                      Apr-19

                                                                          Aug-19
                                                                                   Sep-19

                                                                                                                                                  Apr-20

                                                                                                                                                                                                                                            Feb-21
                             Mar-19

                                               May-19

                                                                                                                                Feb-20
                                                                                                                                         Mar-20

                     $60                                                                                                                                   May-20                                                                                      60

                         Non-Residential Building Value ($M)                                                                                                    Residential Building Value ($M)
                     $40 Residential Dwelling Units (Number)                                                                                                                                                                                           40

                     $20                                                                                                                                                                                                                               20
                       $9                                                                                                                                                                                                                               18

                      $0$8                                                                                                                                                                                                                             016
                                                                 Jul-19

                                                                                                                                                                             Jul-20
                                                        Jun-19

                                                                                                     Nov-19
                                                                                                              Dec-19
                                                                                                                       Jan-20

                                                                                                                                                                    Jun-20

                                                                                                                                                                                                                 Nov-20
                                                                                                                                                                                                                          Dec-20
                                                                                                                                                                                                                                   Jan-21
                                      Apr-19
                             Mar-19

                                               May-19

                                                                          Aug-19
                                                                                   Sep-19
                                                                                            Oct-19

                                                                                                                                                  Apr-20

                                                                                                                                                                                      Aug-20
                                                                                                                                                                                               Sep-20
                                                                                                                                                                                                        Oct-20
                                                                                                                                Feb-20
                                                                                                                                         Mar-20

                                                                                                                                                           May-20

                                                                                                                                                                                                                                            Feb-21
                       $7                                                                                                                                                                                                                              14

                                                                                                                                                                                                                                                                    Residential Volume (No.)
                       $6                                                                                                                                                                                                                              12
                        Non-Residential Building Value ($M)                                                                                                     Residential Building Value ($M)
                Figure 2.3. Building Approvals (Charters Towers – Ayr - Ingham SA3) – Mar 2019 to Feb 2021
    $ Million

                   $5      Residential Dwelling Units (Number)                   10
                Source: QGSO (2021)9.9
                       $4                                                                                                                                                                                                                              8
                       $9
                       $3                                                                                                                                                                                                                              18
                                                                                                                                                                                                                                                       6
                       $8
                       $2                                                                                                                                                                                                                              16
                                                                                                                                                                                                                                                       4
                       $7
                       $1                                                                                                                                                                                                                              14
                                                                                                                                                                                                                                                       2
                                                                                                                                                                                                                                                                    Residential Volume (No.)

                       $6
                       $0                                                                                                                                                                                                                              12
                                                                                                                                                                                                                                                       0
    $ Million

                                                                   Jul-19

                                                                                                                                                                               Jul-20
                                                          Jun-19

                                                                                                       Nov-19
                                                                                                                Dec-19
                                                                                                                         Jan-20

                                                                                                                                                                      Jun-20

                                                                                                                                                                                                                   Nov-20
                                                                                                                                                                                                                            Dec-20
                                                                                                                                                                                                                                     Jan-21
                                        Apr-19
                               Mar-19

                                                 May-19

                                                                            Aug-19
                                                                                     Sep-19
                                                                                              Oct-19

                                                                                                                                                    Apr-20

                                                                                                                                                                                                          Oct-20
                                                                                                                                  Feb-20
                                                                                                                                           Mar-20

                                                                                                                                                             May-20

                                                                                                                                                                                        Aug-20
                                                                                                                                                                                                 Sep-20

                                                                                                                                                                                                                                              Feb-21

                       $5                                                                                                                                                                                                                              10

                       $4                                                                                                                                                                                                                              8
                              Non-Residential Building Value ($M)                                                                                                     Residential Building Value ($M)
                       $3 Residential Dwelling Units (Number)                                                                                                                                                                                          6

                       $2                                                                                                                                                                                                                              4

                       $1                                                                                                                                                                                                                              2

                       $0                                                                                                                                                                                                                              0
                                                                   Jul-19

                                                                                                                                                                               Jul-20
                                                          Jun-19

                                                                                                       Nov-19
                                                                                                                Dec-19
                                                                                                                         Jan-20

                                                                                                                                                                      Jun-20

                                                                                                                                                                                                                   Nov-20
                                                                                                                                                                                                                            Dec-20
                                                                                                                                                                                                                                     Jan-21
                                        Apr-19
                               Mar-19

                                                 May-19

                                                                            Aug-19
                                                                                     Sep-19
                                                                                              Oct-19

                                                                                                                                                    Apr-20

                                                                                                                                                                                        Aug-20
                                                                                                                                                                                                 Sep-20
                                                                                                                                                                                                          Oct-20
                                                                                                                                  Feb-20
                                                                                                                                           Mar-20

                                                                                                                                                             May-20

                                                                                                                                                                                                                                              Feb-21

                              Non-Residential Building Value ($M)                                                                                                     Residential Building Value ($M)
                              Residential Dwelling Units (Number)

                13
                     QGSO (2021). Building Approvals, Australia. Queensland Government Statisticians Office.

                                                                                                                                                                                                                    MAJOR SPONSOR

                       10
Townsville North Queensland Economic Snapshot – July 2021

2.3          Business Confidence
Townsville business confidence has remained strong throughout the June 2021 quarter, staying above 12 index
points. The strong businesses confidence since the COVID-19 indicates signs of positivity and economic activity in the
region.

With the end of JobKeeper and JobSeeker in March, business confidence still remains relatively high. Nearly 50% of
the respondents have highlighted that they expect some adverse impacts on the regional economy due to the end of
government stimulus packages, however business confidence still remained positive (PVW Partners, 2021).

There are still positive signs for the regional labour market, with 94% of respondents highlighting that they will
either remain at current employment levels or will look to expand in the next three months. Although this is a slight
downward revision from the March survey, optimism is still high under the current circumstances.

Not only are businesses looking to increase employment levels, approximately one third are looking to increase
investment throughout the next quarter (PVW Partners, 2021). This increase in investment will provide a stimulus to
the regional economy, generating additional revenues for local businesses.

Figure 2.4. Business Confidence Change Index – Townsville                                       Source: PVW Partners (2021). 14

14
      VW Partners (2021). Business Confidence Survey. Retrieved from
     P
     https://www.pvwpartners.com/townsville-business-confidence-continues-to-fly-high/

                                                                                         MAJOR SPONSOR

       11
Townsville North Queensland Economic Snapshot – July 2021

2.4     Tourism
Whilst the international tourism sector continues to be significantly impacted by the pandemic enforced travel
restrictions, the Tourism Research Australia data highlights that Australians are embracing the opportunity to
explore their own backyard.

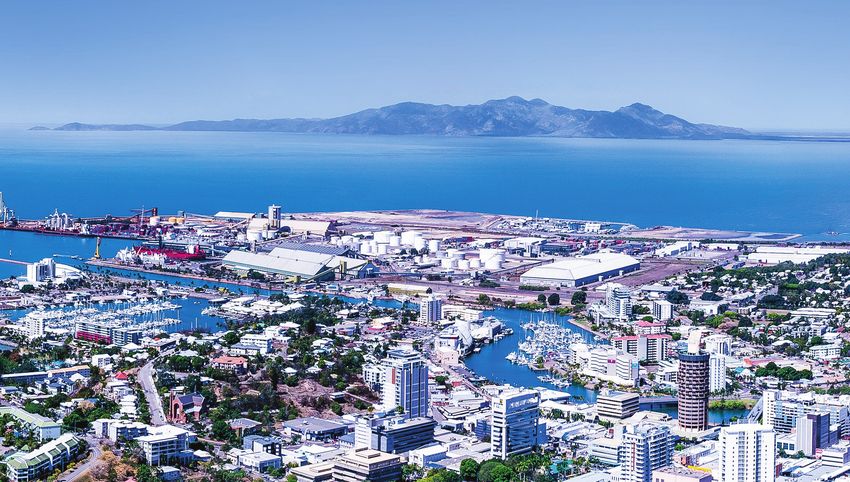
Regional destinations, particularly those located within a few hours drive of capital city markets, have
experienced growth in the domestic overnight visitor market from the December 2019 quarter to the December
2020 quarter. Domestic tourism growth has been particularly strong in Queensland, with a number of Local
Government Areas experiencing an increase in domestic tourism.

There has been a push in domestic tourism throughout 2021, with flight subsidies for key tourism destinations.

These schemes have been designed to support and further grow the tourism industry throughout Queensland.

Figure 2.5. Domestic Tourism (December 2019 Quarter to December 2020 Quarter)

Source: TRA (2020) DataAU.

                                                                     MAJOR SPONSOR

   12
Townsville North Queensland Economic Snapshot – July 2021

From the December 2019 quarter to the December 2020 quarter, domestic overnight visitor expenditure for
the Townsville North Queensland region has declined by 34.8% and overall visitation declined by 38.6%. Sharp
declines were recorded across all reasons for travel, with Holiday visitation decreasing by 31.8% over the year to
275,000; visiting friends and relatives decreased by 46.5% to 212,000 and business visitation decreased by 40.5%
to 224,000.

                                                                                                          Expenditure
                                   Visitors          Holiday            VFR                  Business
                                                                                                             ($M)

 Domestic Overnight                797,000           275,000          212,000                224,000           $515.2

 Annual % change                   ▼ -38.6%          ▼ -31.8%         ▼ -46.5%               ▼ -40.5%          ▼ -34.8%

 3yr trend & change                ▼ -7.7%           ▼ -6.2%           ▼ -5.8%               ▼ -11.7%          ▼ -10.5%

 International Overnight           23,000            17,000             n/p                    n/p               n/p

 Annual % change                   ▼ -81.7%          ▼ -83.5            n/p                    n/p               n/p

 3yr trend % change                ▼ -30.1%          ▼ -29.7%           n/p                    n/p               n/p

 Total                             820,000           292,000            n/p                    n/p               n/p

 Annual % change                   ▼ -42.4%          ▼ -42.4%           n/p                    n/p               n/p

 3yr trend % change                ▼ -9.9%           ▼ -11.3%           n/p                    n/p               n/p

Source: TRA, 2020

Within this reporting period, the industry was subject to ongoing and significant COVID-19 travel restrictions and
border closures including:

• Queensland’s borders closed on 3 April and all non-essential travel was banned soon after.
• Intrastate overnight travel was permitted within Queensland from 1 June
• Interstate borders were reopened to all states except Victoria on 10 July but were reclosed to New South
  Wales and ACT a month after.
• Borders reopened to ACT as of 25 September, all regional NSW by 3 November and Victoria and Greater
  Sydney on 1 December.
• Restrictions were put in place on Greater Sydney again on 20 December

Accommodation occupancy across the last twelve months has experienced mixed results across, directly
correlating to the pandemic environment at any point in time. Growth throughout the winter months (peak
tourism season) where looking positive with average occupancy in both May and June sitting at above 77%.
However, impacts from Townsville’s recent lockdown (30 June – 3 July) and the subsequent border closures
across the country is anticipated to impact accommodation results for July and August.

  YEAR     JAN      FEB     MAR       APR     MAY       JUNE    JULY       AUG          SEP       OCT     NOV          DEC

   2021    56.5     66.4    64.2      69.7    77.5      77.7      -           -          -           -     -            -

   2020    53.6     60.7    46.4      20.1    25.9      36.2    58.3       65.5         71.6         68   66.3         71.4

   2019    50.6     80.4    81.3      72.3    76.2      82.6    89.3       79.4         75.5      75.1    70.8         62.1

Source: STR Global, 2021

                                                                        MAJOR SPONSOR

   13
Townsville North Queensland Economic Snapshot – July 2021

                                    Townsville Enterprise Limited                        Phone: +61 7 4726 2728
                                    380 Flinders Street, Townsville                      Email: tel@tel.com.au
                                    Queensland, 4810 Australia                           Web: www.townsvilleenterprise.com.au

                                    The Townsville North Queensland Quarterly Economic Snapshot is a joint initiative of Townsville Enterprise and AEC Group Limited.

Disclaimer: Whilst all care and diligence has been exercised in the preparation of this report, AEC Group Pty Ltd does not warrant the accuracy of
the information contained within and accepts no liability for any loss or damage that may be suffered as a result of reliance on this information,
whether or not there has been any error, omission or negligence on the part of AEC Group Pty Ltd or their employees. Any forecasts or projections
used in the analysis can be affected by a number of unforeseen variables, and as such no warranty is given that a particular set of results will in
fact be achieved.

                                                                                                     MAJOR SPONSOR

    14
You can also read