PERILS OF PERCEPTION Environmental Perils - April 2021 - Ipsos
←
→
Page content transcription
If your browser does not render page correctly, please read the page content below
PERILS OF
PERCEPTION
Environmental Perils
April 2021

© Ipsos | Environmental Perils of Perception 2021 | Public

These are the latest findings from Ipsos’ Perils of
Perception survey. The survey was conducted in 30
markets and asked people about what individuals can
do to tackle climate change.

    For the purpose of this study, the main sources of ‘actual’ data
    for impacts of individual actions on climate change can be
    found at the end of the report.

2     © Ipsos | Perils of Perception 2021 | April 2021 | PUBLIC
Summary
    Despite high concern and high confidence that we know what to do in our
    own lives to combat climate change, misperceptions are rife and many often
    just don’t know.

    Across markets, people                                         Awareness of the           Climate action
    on average                                                     climate change impacts     messaging can confuse:
    underestimate the most                                         we are already seeing is   many think it’s better to
    impactful climate actions                                      low. Few knew how          eat local meat rather
    they can take, and                                             warm recent years have     than imported plants,
    overestimate the least                                         been, or how many lives    when the reverse is true:
    impactful ones                                                 are already impacted by    vegetarianism is far
                                                                   climate change             more impactful

3      © Ipsos | Perils of Perception 2021 | April 2021 | PUBLIC
A Global Market Average of 7 in 10 agree:

    “I understand what action I need to take to
     play my part in tackling climate change.”

                                                                But do we really?

4   © Ipsos | Perils of Perception 2021 | April 2021 | PUBLIC
5
Q. Market Agree Disagree
Global Market Average 69% 8%
To what extent do you agree Peru 85% 7%
Colombia 83% 4%
or disagree with the Mexico 82% 7%
following: Chile 82% 5%
I understand what action I South Africa 77% 7%
Hungary 76% 6%
need to take to play my part Sweden 76% 8%
in tackling climate change Argentina 76% 7%
Turkey 75% 9%
India 73% 11%
France 72% 7%
Great Britain 71% 9%
Spain 71% 6%
Malaysia 71% 4%
Belgium 70% 6%
Italy 69% 10%
In almost every market, a Switzerland 69% 10%
majority agree they Netherlands 69% 8%
Brazil 68% 6%
understand what action they Poland 67% 10%
need to take to tackle climate Australia 66% 8%
change. Germany 66% 8%
Canada 65% 9%
But do we really? United States 65% 8%
China 64% 8%
South Korea 63% 6%
Hong Kong 63% 9%
Saudi Arabia 53% 11%
Russia 41% 18%
Japan 40% 17%
Base: 21,011 online adults aged 16-74 across 30 markets, 19 Feb – 5 Mar 2021
© Ipsos | Perils of Perception 2021 | April 2021 | PUBLIC6 Behavioural perceptions How do we reduce our climate change impact? © Ipsos | Perils of Perception 2021 | April 2021 | PUBLIC
Looking at well-known ‘green’ actions, how
    does the public rank potential greenhouse
             gas savings from each?

7   © Ipsos | Perils of Perception 2021 | April 2021 | PUBLIC
8
CO2
Actual
Q. Global Market Average rank
saved
(tonnes)
From this list of options, Recycling as much as possible 59% 7 0.2
which three do you think
would most reduce the Buying energy only from renewable sources (e.g. wind power, hydro- 4 1.5
greenhouse gas emissions electric) 49%
of an individual living in one
of the world’s richer Replacing a typical car with an electric car or hybrid 41% 5 1.1
countries?
Replacing traditional incandescent lightbulbs with low energy
36% 9 0.1
compact fluorescent (CFL) or LED lightbulbs
Global Market Averages
While all actions can make a Hang-drying their clothes, instead of using an electric or gas dryer 26% 8 0.2
difference, the most
impactful actions are ranked 3 1.6
Avoiding one long-distance flight (lasting six hours or more) 21%
too low, and the least
impactful actions ranked too
high in the public’s Not having a car 17% 2 2.4
estimations of carbon
savings. Eating a plant-based diet 14% 6 0.8
Having one fewer child 11% 1 58.6*
Base: 21,011 online adults aged 16-74 across 30 markets, 19 Feb – 5 Mar 2021
*Source: Institute of Physics, 2017. The most effective individual steps to tackle climate change aren't being discussed. Available here:
https://phys.org/news/2017-07-effective-individual-tackle-climate-discussed.html
© Ipsos | Perils of Perception 2021 | April 2021 | PUBLIC
NB: Emissions saved from having one fewer child is calculated by quantifying future emissions of descendants based on historical rates, based on heredity9
CO2
Actual
Q. Global Market Average rank
saved
(tonnes)
From this list of options, Having one fewer child 11% 1 58.6*
which three do you think
would most reduce the 2 2.4
greenhouse gas emissions Not having a car 17%
of an individual living in one
of the world’s richer Avoiding one long-distance flight (lasting six hours or more) 21% 3 1.6
countries?
Buying energy only from renewable sources (e.g. wind power, hydro-
49% 4 1.5
electric)
Global Market Averages
The difference is clear when Replacing a typical car with an electric car or hybrid 41% 5 1.1
ranked by actual order –
actions like recycling, hang- 6 0.8
Eating a plant-based diet 14%
drying and using low energy
light bulbs are over-
estimated compared with not Recycling as much as possible 59% 7 0.2
having a car at all or
avoiding long-distance flights Hang-drying their clothes, instead of using an electric or gas dryer 26% 8 0.2
Replacing traditional incandescent lightbulbs with low energy 9 0.1
compact fluorescent (CFL) or LED lightbulbs 36%
Base: 21,011 online adults aged 16-74 across 30 markets, 19 Feb – 5 Mar 2021
*Source: Institute of Physics, 2017. The most effective individual steps to tackle climate change aren't being discussed. Available here:
https://phys.org/news/2017-07-effective-individual-tackle-climate-discussed.html
© Ipsos | Perils of Perception 2021 | April 2021 | PUBLIC
NB: Emissions saved from having one fewer child is calculated by quantifying future emissions of descendants based on historical rates, based on heredityMarket summary – three most effective actions for
10
reducing an individual’s greenhouse gas emissions Top three actions:
#1 action in market
#2 action in market
From this list of options, which three do you think would most reduce the greenhouse gas emissions of an #3 action in market
individual living in one of the world’s richer countries?
TOT ARG AUS BEL BRA CAN CH CHL CHN COL ESP FRA GB GER HK HUN IND ITA JAP KSA KOR MAL MEX NLD PER POL RUS SAF SE TUR USA
Recycling as much as possible 59% 66% 58% 60% 63% 59% 56% 64% 48% 64% 67% 70% 55% 49% 59% 61% 55% 64% 62% 47% 63% 61% 66% 45% 62% 56% 68% 66% 51% 59% 54%
Buying energy only from renewable
sources (e.g. wind power, hydro- 49% 70% 45% 44% 49% 40% 41% 72% 39% 64% 58% 34% 45% 42% 39% 64% 43% 49% 39% 50% 43% 48% 64% 38% 62% 59% 42% 59% 38% 47% 43%
electric)
Replacing a typical car with an electric
41% 48% 31% 24% 51% 40% 29% 54% 49% 54% 45% 27% 39% 20% 39% 36% 42% 42% 42% 45% 54% 44% 44% 29% 46% 40% 50% 42% 27% 60% 42%
car or hybrid
Replacing traditional incandescent
lightbulbs with low energy compact 36% 37% 32% 32% 43% 34% 31% 28% 39% 36% 39% 37% 21% 29% 44% 37% 40% 41% 46% 43% 42% 42% 37% 30% 43% 47% 39% 41% 25% 25% 37%
fluorescent (CFL) or LED lightbulbs
Hang-drying their clothes, instead of
26% 20% 32% 25% 25% 26% 29% 23% 26% 25% 27% 40% 20% 27% 26% 14% 29% 30% 24% 26% 31% 33% 32% 21% 31% 22% 21% 25% 24% 26% 18%
using an electric or gas dryer
Avoiding one long-distance flight
21% 14% 17% 39% 13% 23% 29% 13% 19% 10% 22% 33% 29% 42% 21% 27% 21% 22% 9% 20% 14% 13% 15% 33% 14% 17% 10% 17% 42% 22% 15%
(lasting six hours or more)
Not having a car 17% 16% 19% 23% 15% 17% 28% 12% 6% 16% 14% 16% 24% 23% 29% 21% 13% 10% 14% 11% 16% 11% 11% 25% 16% 17% 23% 14% 30% 19% 15%
Eating a plant-based diet 14% 11% 18% 16% 10% 12% 17% 9% 17% 6% 5% 7% 21% 19% 15% 13% 24% 12% 12% 20% 14% 16% 7% 23% 4% 9% 11% 16% 21% 14% 14%
Having one fewer child 11% 8% 14% 14% 8% 11% 15% 10% 5% 16% 5% 9% 19% 9% 11% 7% 18% 5% 5% 10% 6% 7% 12% 22% 14% 6% 4% 11% 21% 8% 10%
Base: 21,011 online adults aged 16-74 across 30 markets, 19 Feb – 5 Mar 2021
© Ipsos | Perils of Perception 2021 | April 2021 | PUBLICGoing beyond the (more) obvious, what
other actions could we take, and do we
understand what impact they would have?
11 © Ipsos | Perils of Perception 2021 | April 2021 | PUBLIC12
Q. Global Market Average True rank
Which of the following Less packaging 52% 38th
actions do you think appear
in the top 30 ways of Buying fewer items, or more durable items 46% 46th
reducing our personal
climate change impact? More energy-efficient cooking equipment, using cleaner fuel or 9th
renewable energy 46%
Please select up to five.
Growing or producing your own food 37% 23rd
Global Market Averages
Car pooling/sharing 36% 27th
Respondents were generally Refurbishing and renovating housing for efficiency 35% 6th
more accurate in selecting
Fuel efficient driving practices (e.g. using the correct gear, and
actions in the top ways to driving more slowly) 33% 34th
reduce our climate impact.
However, half believed less Green roofs - partially or completely covered with vegetation 26% 57th
packaging (52%) and buying
less (46%) were in the top Having smaller living spaces / or co-housing to fill empty rooms 13% 31st
thirty, more than, for
example, renovating or Not having pets 5% 25th
refurbishing housing for
Base: 21,011 online adults aged 16-74 across 30 markets, 19 Feb – 5 Mar 2021
efficiency (35%).
*Source: Ivanova et al., 2020. Quantifying the potential for climate change mitigation of consumption options. Available here:
© Ipsos | Perils of Perception 2021 | April 2021 | PUBLIC https://iopscience.iop.org/article/10.1088/1748-9326/ab8589/pdf13
Q. Global Market Average True rank
Which of the following Refurbishing and renovating housing for efficiency 35% 6th
actions do you think appear
in the top 30 ways of More energy-efficient cooking equipment, using cleaner fuel or
46% 9th
renewable energy
reducing our personal
climate change impact? 23rd
Growing or producing your own food 37%
Please select up to five.
Not having pets 5% 25th
Global Market Averages
Car pooling/sharing 36% 27th
The difference is clearer Having smaller living spaces / or co-housing to fill empty rooms 13% 31st
when ranked by actual order
– actions such as buying Fuel efficient driving practices (e.g. using the correct gear, and
driving more slowly) 33% 34th
products with less packaging
and buying fewer or more Less packaging 52% 38th
durable items are over-
estimated compared with Buying fewer items, or more durable items 46% 46th
refurbishing homes for
energy efficiency. Green roofs - partially or completely covered with vegetation 26% 57th
Base: 21,011 online adults aged 16-74 across 30 markets, 19 Feb – 5 Mar 2021
*Source: Ivanova et al., 2020. Quantifying the potential for climate change mitigation of consumption options. Available here:
© Ipsos | Perils of Perception 2021 | April 2021 | PUBLIC https://iopscience.iop.org/article/10.1088/1748-9326/ab8589/pdfMarket summary – top three actions perceived to be
14
in the top thirty ways to reduce climate change impact Top three actions:
#1 action in market
#2 action in market
Which of the following actions do you think appear in the top 30 ways of reducing our personal climate change #3 action in market
impact?
TOT ARG AUS BEL BRA CAN CH CHL CHN COL ESP FRA GB GER HK HUN IND ITA JAP KSA KOR MAL MEX NLD PER POL RUS SAF SE TUR USA
Less packaging
52% 44% 51% 58% 61% 58% 65% 45% 44% 40% 59% 59% 61% 65% 72% 59% 32% 56% 55% 70% 18% 55% 32% 52% 38% 61% 48% 48% 50% 58% 40%
Buying fewer items, or more durable
items 46% 49% 41% 44% 46% 46% 51% 53% 38% 50% 37% 50% 50% 49% 68% 44% 32% 43% 50% 60% 27% 29% 42% 45% 50% 60% 37% 36% 67% 44% 39%
More energy-efficient cooking
equipment, using cleaner fuel or 46% 50% 44% 31% 43% 31% 24% 57% 56% 51% 44% 17% 43% 18% 64% 61% 47% 29% 48% 63% 46% 51% 46% 50% 55% 53% 48% 62% 30% 69% 37%
renewable energy
Growing or producing your own food
37% 61% 43% 31% 33% 43% 26% 51% 28% 57% 19% 32% 44% 25% 34% 27% 35% 30% 24% 21% 42% 48% 46% 15% 41% 36% 40% 65% 38% 44% 40%
Car pooling/sharing
36% 33% 37% 37% 21% 48% 31% 48% 39% 51% 43% 42% 39% 28% 46% 24% 39% 22% 23% 26% 25% 53% 50% 28% 34% 21% 21% 42% 53% 22% 50%
Refurbishing and renovating housing for
efficiency 35% 29% 32% 61% 21% 39% 51% 30% 9% 23% 50% 56% 40% 48% 20% 68% 33% 52% 20% 36% 23% 29% 26% 56% 26% 22% 24% 25% 20% 28% 43%
Fuel efficient driving practices (e.g.
using the correct gear, and driving more 33% 29% 29% 25% 24% 30% 27% 31% 36% 30% 31% 31% 36% 32% 25% 30% 45% 26% 48% 53% 43% 31% 33% 26% 36% 30% 23% 44% 27% 38% 39%
slowly)
Green roofs - partially or completely
covered with vegetation 26% 20% 19% 18% 27% 20% 32% 18% 34% 24% 17% 18% 17% 31% 49% 30% 42% 21% 22% 18% 55% 29% 22% 29% 23% 27% 23% 43% 11% 27% 21%
Having smaller living spaces / or co-
housing to fill empty rooms 13% 14% 17% 17% 9% 15% 12% 9% 16% 10% 8% 9% 9% 9% 12% 7% 23% 11% 11% 14% 17% 10% 13% 11% 14% 7% 9% 13% 13% 26% 14%
Not having pets
5% 2% 6% 5% 4% 5% 4% 2% 8% 3% 3% 5% 5% 5% 11% 5% 8% 7% 7% 12% 13% 5% 4% 8% 2% 4% 3% 2% 6% 4% 4%
Base: 21,011 online adults aged 16-74 across 30 countries/markets, 19 Feb – 5 Mar 2021
© Ipsos | Perils of Perception 2021 | April 2021 | PUBLIC15 Impacts of climate change © Ipsos | Perils of Perception 2021 | April 2021 | PUBLIC
Climate change already displaces more
     people than conflict, but only a minority
                   know this.

16   © Ipsos | Perils of Perception 2021 | April 2021 | PUBLIC
© Ipsos | Perils of Perception 2021 | April 2021 | PUBLIC 17
Q.
Global Market Average
In 2020, do you think more
people suffered internal
displacement as a result of True causes of new
conflict (such as war, displacements (million
criminal and political people), first half of 2020*
violence) or as a result of
25% 32%
climate and weather-related
disasters (such as
hurricanes, storms and
flooding)?
14.6M
Global Market Averages
9,8
Two in five (43%) believe
conflict to be the greater 43%
cause of internal 4,8
displacement, while a third
(32%) chose climate and Internal displacement due to climate
Conflict Climate
weather-related disasters.
Internal displacement due to conflict
The true cause (climate and
weather) accounted for two Don't know
Base: 21,011 online adults aged 16-74 across 30 markets, 19 Feb – 5 Mar 2021
thirds (67%) of new
*Source: GRID, 2020. 2020 Mid-Year Update. Available here: https://www.internal-
displacements in the first six
© Ipsos | Perils of Perception 2021 | April 2021 | PUBLIC displacement.org/sites/default/files/publications/documents/2020%20Mid-year%20update.pdf
months of 2020.18
Q. Market Conflict Climate/weather-related
In 2020, do you think more Global Market Average 43% 32%
Turkey 68% 24%
people suffered internal Colombia 67% 22%
displacement as a result of Chile 58% 28%
Hong Kong 57% 27%
conflict (such as war, Saudi Arabia 55% 20%
criminal and political Mexico 54% 33%
violence) or as a result of Peru 51% 37%
Hungary 49% 31%
climate and weather-related Germany 47% 25%
disasters (such as Sweden 44% 34%
India 44% 40%
hurricanes, storms and Malaysia 44% 38%
flooding)? Switzerland 43% 32%
Argentina 43% 33%
Spain 43% 26%
In most markets, respondents South Korea 42% 39%
South Africa 40% 41%
perceived conflict as being Netherlands 40% 24%
the greater cause of internal Brazil 39% 39%
displacement, although with Great Britain 39% 32%
Italy 38% 29%
some exceptions – such as Australia 37% 30%
the US, France, China and Belgium 37% 30%
Japan Canada 34% 31%
Poland 33% 31%
Russia 31% 35%
United States 31% 43%
France 29% 39%
China 26% 40%
Japan 23% 41%
© Ipsos | Perils of Perception 2021 | April 2021 | PUBLIC Base: 21,011 online adults aged 16-74 across 30 markets, 19 Feb – 5 Mar 2021Feeling hot, hot, hot? Only one in
twenty-five of the public know that all of
the last six years were among the
hottest on record.
19 © Ipsos | Perils of Perception 2021 | April 2021 | PUBLIC20
Q. Global Market Average
The World Meteorological
Organization collects annual
global temperatures, to see
whether they are rising or 4%
Average response
falling across the world. 9%
among those giving
3%
Records begin in 1850.Since an answer: 5%
2015, how many years have 4%
1%
been the warmest year on Since 2015, 4 years
record? have been the
warmest on record
Global Market Averages 96%
Actual data:
Nearly all respondents either 73%
underestimated (22%) or Since 2015, 6 years
were unsure (73%) of how have been the
many years since 2015 have warmest on record
been the warmest on record.
Only one in twenty-five (4%)
correctly stated that the 6
years since 2015 have been 6 5 4 3 2 1 0 Don't know
the warmest on record.
Base: 21,011 online adults aged 16-74 across 30 markets, 19 Feb – 5 Mar 2021
*Source: The World Meteorological Organisation, 2021. 2020 was one of three warmest years on record. Available here:
© Ipsos | Perils of Perception 2021 | April 2021 | PUBLIC https://public.wmo.int/en/media/press-release/2020-was-one-of-three-warmest-years-record21 Climate change and diet © Ipsos | Perils of Perception 2021 | April 2021 | PUBLIC
Going plant-based makes more of a
       difference to your carbon footprint than
     eating local, but the public guess this is the
                   other way around.

22    © Ipsos | Perils of Perception 2021 | April 2021 | PUBLIC
23
Q. Global Market Average
And which of these two
actions do you think would
most reduce an individual's
greenhouse gas emissions? 20%
23% Eating a
Global Market Averages vegetarian diet
with some
imported
Eating local does not products
necessarily mean eating
greener, as switching to a Eating a locally
vegetarian diet including produced diet
some imported fruit and including meat
and dairy
vegetables more effectively
products
reduces an individual’s
greenhouse gas emissions.
Don't know
However, three in five (57%)
perceived eating a locally 57%
produced diet that includes
some animal foodstuffs as
being the more
Base: 21,011 online adults aged 16-74 across 30 markets, 19 Feb – 5 Mar 2021
environmentally friendly diet.
*Source: Our World in Data, 2020. You want to reduce the carbon footprint of your food? Focus on what you eat, not whether
© Ipsos | Perils of Perception 2021 | April 2021 | PUBLIC your food is local. Available here: https://ourworldindata.org/food-choice-vs-eating-local24
Q. Market Locally produced Vegetarian
And which of these two Global Market Average 57% 20%
Hungary 77% 11%
actions do you think would Switzerland 73% 15%
most reduce an individual's France 70% 7%
Belgium 68% 14%
greenhouse gas emissions: Sweden 66% 18%
Germany 64% 14%
Eating a diet that is mostly Great Britain 62% 18%
Canada 62% 10%
locally produced, including Mexico 62% 19%
locally produced meat and South Africa 62% 22%
Japan 62% 10%
dairy products? Australia 60% 17%
Italy 60% 18%
Eating a vegetarian diet, Spain 59% 14%
Netherlands 59% 23%
even if some of the fruit and Hong Kong 56% 29%
vegetables have been Turkey 56% 16%
imported from other Saudi Arabia 55% 24%
United States 55% 13%
countries? South Korea 53% 18%
Russia 52% 12%
In most markets, respondents Poland 51% 11%
perceived a locally produced China 51% 20%
diet to have lower emissions Peru 51% 29%
Malaysia 50% 25%
than a vegetarian one with Argentina 50% 26%
some imported produce. Chile 46% 30%
Colombia 45% 37%
India was the exception, with India 44% 47%
respondents more evenly Brazil 41% 31%
split.
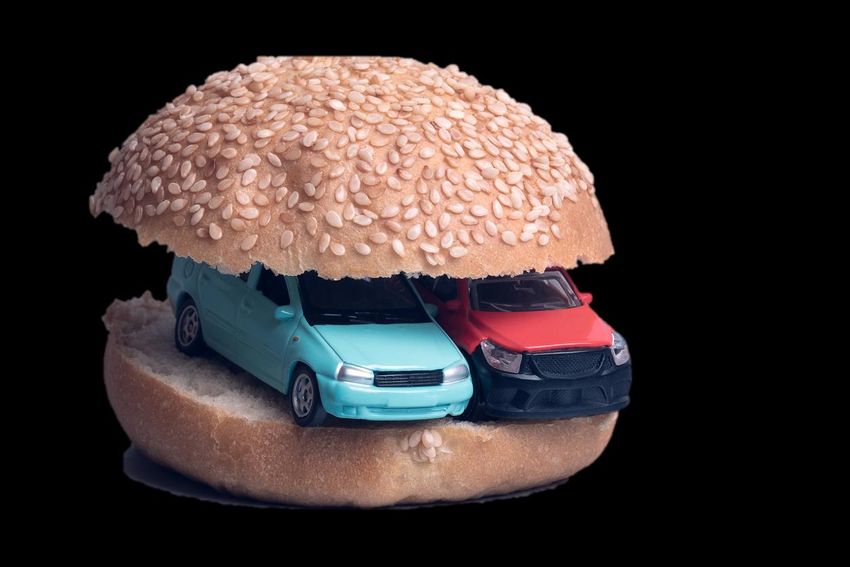
© Ipsos | Perils of Perception 2021 | April 2021 | PUBLIC Base: 21,011 online adults aged 16-74 across 30 markets, 19 Feb – 5 Mar 2021The true meaning of food miles? Public
understanding of relative impact of meat
and miles is low. We have little idea of how
burgers compare to carbon emissions from
driving.
25 © Ipsos | Perils of Perception 2021 | April 2021 | PUBLIC© Ipsos | Perils of Perception 2021 | April 2021 | PUBLIC 26
Q.
Global Market Average
The amount of carbon
dioxide released into the
atmosphere as a result of
making one beef burger is
equivalent to driving how far
Mean: 43km
in a car?
Global Market Averages –
mean in km
The majority of respondents
(86%) could not say how
many km of driving a beef
burger was equivalent to. Of
those who answered, one in 86% 10% 2% 1% 1%
ten (10%) believed this to be
50km or less. Don't know 0-50 51-100 101-150 151+
The true journey range is
between 38 and 119km,
Range*: 38 – 119km
depending on car efficiency. Base: 21,011 online adults aged 16-74 across 30 markets, 19 Feb – 5 Mar 2021
The average answer (43km) *Source: Our World in Data, 2020. You want to reduce the carbon footprint of your food? Focus on what you eat, not whether
your food is local. Available here: https://ourworldindata.org/food-choice-vs-eating-local ; IEA 2021. Tracking Transport 2020.
came at the lower end of this Available here: https://www.iea.org/reports/tracking-transport-2020/rail#abstract . Quarter pounder burger patty weight of 113.4g
range.
© Ipsos | Perils of Perception 2021 | April 2021 | PUBLIC is assumed.These are the findings of the Global Advisor wave 152 (GA 152)
an Ipsos survey conducted between February 19 and March 5, 2021.
The survey instrument is conducted Colombia, Hong Kong, Hungary, India, The samples in Brazil, Chile, mainland
monthly in 30 markets around the world via Malaysia, Mexico, the Netherlands, Peru, China, Colombia, Hong Kong, India,
the Ipsos Online Panel system. Poland, Russia, Saudi Arabia, South Africa, Malaysia, Mexico, Peru, Russia, Saudi
The markets reporting herein are South Korea, Sweden, Switzerland and Arabia, South Africa and Turkey are more
Argentina, Australia, Belgium, Brazil, Turkey, where each have a sample urban & educated, and/or more affluent
Canada, China, Chile, Colombia, France, approximately 500+. The precision of Ipsos than the general population. We refer to
Great Britain, Germany, Hungary, Hong online polls are calculated using a credibility these respondents as “Upper Deck
Kong, India, Italy, Japan, Malaysia, Mexico, interval with a poll of 1,000 accurate to +/- Consumer Citizens”. They are not
the Netherlands, Peru, Poland, Russia, 3.5 percentage points and of 500 accurate nationally representative of their market.
Saudi Arabia, South Africa, South Korea, to +/- 5.0 percentage points. For more
Spain, Sweden, Switzerland, Turkey and information on the Ipsos use of credibility
the United States of America. intervals, please visit the Ipsos website.
For the results of the survey presented 17 of the 30 markets surveyed online
herein, an international sample of 21,011 generate nationally representative samples
adults aged 18-74 in the US, Canada, Hong in their countries (Argentina, Australia,
Kong, Malaysia, South Africa, and Turkey, Belgium, Canada, France, Germany, Great
and age 16-74 in all other markets, were Britain, Hungary, Italy, Japan, the
interviewed. Approximately 1000+ Netherlands, Poland, South Korea, Spain,
individuals participated on a market by Sweden, Switzerland and United States).
market basis via the Ipsos Online Panel
with the exception of Argentina, Chile,
© Ipsos | Perils of Perception 2021 | April 2021 | PUBLIC
27 ‒Summary of sources for actual data
A range of data sources were used to derive the ‘true’ values referenced in this deck. Details of
each source and any assumptions made are included on the relevant slides. The full list of sources
is included below:
GRID, 2020. 2020 Mid-Year Update. Available here: https://www.internal-
displacement.org/sites/default/files/publications/documents/2020%20Mid-year%20update.pdf
;IEA 2021. Tracking Transport 2020. Available here: https://www.iea.org/reports/tracking-transport-2020/rail#abstract
Institute of Physics, 2017. The most effective individual steps to tackle climate change aren't being discussed. Available
here: https://phys.org/news/2017-07-effective-individual-tackle-climate-discussed.html
Ivanova et al., 2020. Quantifying the potential for climate change mitigation of consumption options. Available here:
https://iopscience.iop.org/article/10.1088/1748-9326/ab8589/pdf
Our World in Data, 2020. You want to reduce the carbon footprint of your food? Focus on what you eat, not whether your
food is local. Available here: https://ourworldindata.org/food-choice-vs-eating-local
The World Meteorological Organisation, 2021. 2020 was one of three warmest years on record. Available here:
https://public.wmo.int/en/media/press-release/2020-was-one-of-three-warmest-years-record
© Ipsos | Perils of Perception 2021 | April 2021 | PUBLIC
28 ‒For more information
Gideon Skinner
Managing Director
gideon.skinner@ipsos.com
Sophie Thompson
Research Executive
sophie.thompson2@ipsos.com
Ruth Townend
Research Manager
ruth.townend@ipsos.com
29 ‒ © Ipsos | Perils of Perception 2021 | April 2021 | PUBLIC
© Ipsos | Perils of Perception 2021 | April 2021 | PUBLICABOUT IPSOS GAME CHANGERS
Ipsos is the third largest market research company in the world, In our world of rapid change, the need for reliable information
present in 90 markets and employing more than 18,000 people. to make confident decisions has never been greater.
Our research professionals, analysts and scientists have built At Ipsos we believe our clients need more than a data supplier,
unique multi-specialist capabilities that provide powerful they need a partner who can produce accurate and relevant
insights into the actions, opinions and motivations of citizens, information and turn it into actionable truth.
consumers, patients, customers or employees. Our 75
business solutions are based on primary data coming from our This is why our passionately curious experts not only provide
surveys, social media monitoring, and qualitative or the most precise measurement, but shape it to provide True
observational techniques. Understanding of Society, Markets and People.
“Game Changers” – our tagline – summarises our ambition to To do this we use the best of science, technology
help our 5,000 clients to navigate more easily our deeply and know-how and apply the principles of security, simplicity,
changing world. speed and substance to everything we do.
Founded in France in 1975, Ipsos is listed on the Euronext So that our clients can act faster, smarter and bolder.
Paris since July 1st, 1999. The company is part of the SBF 120 Ultimately, success comes down to a simple truth:
and the Mid-60 index and is eligible for the Deferred Settlement You act better when you are sure.
Service (SRD).
ISIN code FR0000073298, Reuters ISOS.PA, Bloomberg
IPS:FP
www.ipsos.com
30 ‒ © Ipsos | Perils of Perception 2021 | April 2021 | PUBLICYou can also read