Population Density (2019 Edition) - Senatsverwaltung für ...
←
→
Page content transcription
If your browser does not render page correctly, please read the page content below
06.06 Population Density (2019 Edition)
Overview
The term population density is a measure of how many people live in a given area. Population density
as used here is the number of inhabitants per hectare (1 hectare is an area about 86 yards on a side.
1 hectare = 2.47 acres, or 1 acre = 0.4047 hectare. 640 acres = 1 sq. mile). The population density of
Berlin's entire urban area is 42 people/hectare (p/ha). This figure is in the middle range for German
and European cities. Hamburg has an average of 39 % fewer people per hectare. In the inner city of
Paris, the population density on the same area is almost twice as high. As the city of Paris developed,
                                                 2
however, within a limited area of around 105 km , these numbers are only somewhat comparable (cf.
Fig. 1).

Fig. 1: Population density of Berlin compared to other cities, in people per hectare
(data from 2013-2016)

Data status: Berlin / Munich: 31/12/2016; Hamburg / London: 31/12/2015; Frankfurt: 30/06/2016; Paris:
Inner City, Unité urbaine: 01/01/2013; Warsaw: 30/06/2015. See notes on Fig. 2 for definition of Berlin inner
city.
In Paris, the inner city and the municipal border of the city area overlap. For comparison purposes with the
other urban areas, the geographical unit “ Unité urbaine” , encompassing 10,601,122 inhabitants on 2,845 km²,
is used as a reference value for the entire city.

The population density of Berlin’s inner-city, i.e. within the so-called City Rail Circle Line (S-Bahn-Ring),
lies above average at 117 p/ha and even exceeds that of London.

The Map of Population Density depicts population density in terms of statistical blocks or block
segments (cf. Methodology). Therefore, this presentation is directly comparable to the previous edition
from 2018.

High population density causes great environmental stresses, especially in close proximity to the road,
such as noise and air pollution caused by traffic. Residents frequent public green areas for relaxation.

                                                      1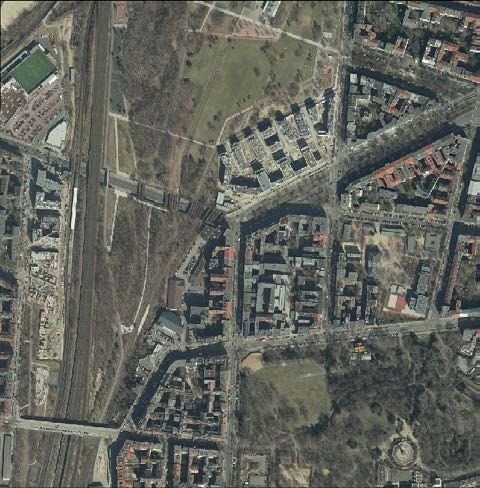
These areas are, however, heavily visited, often overused, and loud. Private green areas exist only to a
limited extent. Some densely populated areas of Berlin are attractive residential areas in spite of this.
Some block-style constructions from the Wilhelminian period are especially attractive when they have
living quarters of generous size, and are complemented by a good infrastructure of small businesses,
restaurants, cultural facilities, services, and an extensive public transportation system. Rich urban life
flourishes here. This urbanity is missed by many living in the purely residential areas at the edge of the
city. These areas have a relatively low population density, a high ratio of open space, and less air and
noise pollution.

The inner city boroughs of Mitte, Tiergarten, Wedding, Prenzlauer Berg, Friedrichshain and Kreuzberg
reached their greatest population density in 1910 with 312 p/ha. Today, the population density of these
boroughs has dropped to 118 p/ha, one-third of the peak value (cf. Fig. 2).

Fig. 2: Development of population density for selected Berlin boroughs (people/hectare within Berlin
boroughs), as of December 31, 2018

For the years 1871 and 1900, only aggregated population numbers were available for the inner city boroughs.
Between 1949 and 1975, no population data was available for the eastern city boroughs. Hence, the population
density of the inner city boroughs could not be determined for these years.

In contrast, the population in the outer boroughs rose continuously, except for a general drop in 1945,
caused by war-time conditions.

While in 1996 a continuous growth in population of up to 300,000 people was expected by 2010, a
more complex development took place: After a peak in 1993 with nearly 3.48 Million inhabitants, the
number decreased to 3.38 Million in 2000. Since then, the number has increased quite continuously to
3.75 Million inhabitants (relating to mandatorily registered residents who have stated Berlin to be their
main place of residence, as of December 31, 2018, Statistical Office of Berlin-Brandenburg, only in
German).

Lower population density results not only from high proportions of green and open spaces and lesser
degrees of development. Lower density can also be due to a large amount of small business, trade and
service use, as well as public facilities, etc. These property areas are included in calculations of
population density, as long as they are not separated in an own block segment.

Detailed and current data bases of population density in specific urban areas are useful for the
planning of various public departments. The Department of Urban Planning, for example, uses these
figures as a basis for planning such infrastructure facilities as schools, businesses and playgrounds.

                                                     2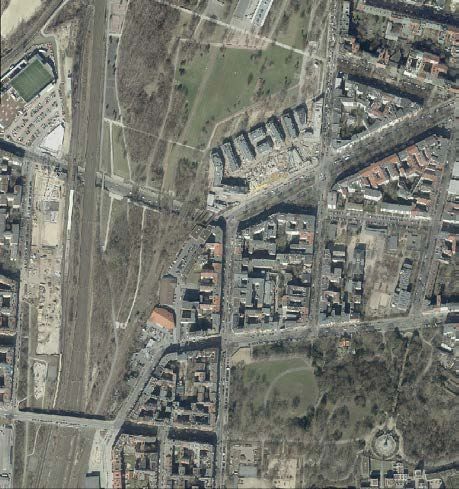
Landscape Planning uses these figures for analyzing the number and accessibility of green spaces
near to residential areas (cf. Map 06.05, SenStadt 2017a). Knowledge of population density also allows
conclusions to be drawn regarding environmental stresses, such as calculating the number of persons
exposed to road traffic noise in their dwellings as part of the analysis of the Strategic Noise Maps (cf.
Map 07.05, SenStadtUm 2017b).

Statistical Base
The present map is based on the file “Inhabitants Legally Registered at the Places of their Main
Residence in Berlin”, as of December 31, 2018, of the Statistical Office of Berlin-Brandenburg. The
statistical system of the Residents’ Registration Office evaluates the data on all legally registered
residents. As state-specific statistics, they primarily serve to provide small-scale demographic data,
and to certify foreign residents according to their citizenships. It supplements the Official Population
Extrapolation, which was provided with an updated statistical base with the 2011 Census (valid as of
May 9, 2011), and is used primarily for statistical purposes, for instance to calculate the size of the
federal-state revenue equalization. However, due to the different systems they use, there are
deviations between the statistics of the Residents’ Registration Office (as of December 31, 2018:
3,747,936) and those of the Official Population Extrapolation (as of December 31, 2018: 3,644,826).
The latter is continued biannually on the basis of census data and of new registrations/ de-
registrations).
As an administrative register, the Residents’ Registration Office cannot fully meet the precision
requirements necessary for statistical accuracy. Thus, for example, the correction to account for
registration deadlines with regard to residents’ moves, births or deaths currently still involves inevitable
imprecision.
As a result of the issuance of uniform tax ID numbers, a particularly large number of foreigners who
were no longer present at their legally registered addresses have been officially removed from the
registry. The current results are therefore only comparable to a limited degree to those of previous
years.
For the present map, all of the 398,000 Berlin address data as of December 31, 2018 was assigned to
the block and block segment areas of the land-use file of the Urban and Environmental Information
System (ISU), ISU 2015. That made it possible to aggregate resident data not only at the level of
statistical blocks, but also at that of the so-called block segments of the ISU. The current presentation
for the reference period December 31, 2018 can only be directly compared with the previous year (cf.
2018 Edition, SenStadtUm 2018), since the population data of December 31, 2016 was the first to be
based on the block and block segments map ISU5, as of December 31, 2015 (cf. also Chapter
“Population density development between 2017 and 2018”).

Several factors that influence the precision of the data stock presented:
    •   For reasons of statistical confidentiality, cases with only one or two examples may not be
        presented with their real values. Therefore, in the case of block and block segment
        evaluations, these confidential cases (values “1” or “2”) are changed in such a way that they
        occur either at least three times or not at all. For this reason, no absolute resident values of
        less than “3” occur.
    •   Combinations of characteristics with an occurrence of “1” or “2” are reassigned in such a way
        that ultimately, only combinations are present which occur either not at all or at least three
        times. The automatic confidentiality procedure used can not only prevent table values of less
        than “3” from occurring, but can also ensure that all evaluations lead to identical marginal total
        results. This procedure, optimized for both such issues, means that distortions are inevitable
        even for more frequently occurring fields in the table.
    •   Moreover, the administrative register cannot completely fulfill the precision requirements for
        statistics of a population register. For instance, the deadline date excerpt contains listings of
        noncurrent residents and cases of non-registration of actual residents, due to moves, births
        and deaths.
These limitations have to be taken into account when interpreting the figures.
The sizes of the particular blocks and block segments have been calculated directly from the block
map ISU5 1:5,000, as of December 31, 2015.

                                                     3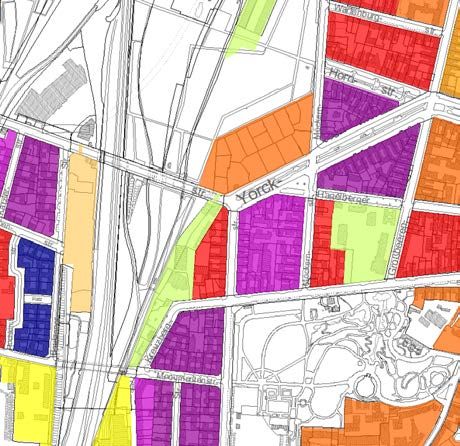
Methodology
The spatial reference system was provided by the digital block map 1:5,000 (ISU5), as of December
31, 2015. This working map contains the individual statistical blocks. Blocks with more than one use
are divided into block segments. The numbering and street limit lines of blocks correspond to those
used by the Statistical Office of Berlin-Brandenburg.

The population density, the quotient of the number of inhabitants by the area size, was determined for
each reference area. The size of each statistical block, needed for the calculation of population density,
was calculated using the ISU5 1:5,000 equal-area map. Figures for the number of inhabitants were
assigned to statistical blocks and block segments according to the ISU spatial reference system.

Map Description
Berlin is characterized by a grown multi central structure with two main centers beside the specific
district centers: the areas "Zoologischer Garten" and "Mitte".
As a rule, population density increases from the city edge toward the city center, however, there are
some focal points in the borough centers like Spandau, Tegel and Köpenick. Particularly the region of
the central area Mitte, i.e. the area around the eastern Greater Tiergarten and in the north and south of
the boulevard Unter den Linden, is predominantly formed by its functions as the governmental area
and as a supra regional and significant center for services and commerce. Today, only some blocks
remain with more than 70 p/ha. Leipziger Straße and the new residence units on Wilhelmstraße are
densely populated and are conspicuous exceptions to general conditions in the eastern city center.
In contrast, the second important city center, located around the Zoologischer Garten and along the
Kurfürstendamm, has been preserved largely as a residential area, contributing significantly to the
liveliness of the cityscape. Here, a considerable number of blocks still count more than 150-200 p/ha.
The Wilhelminische Ring stands out with a predominately high population density of 351 and more
p/ha. The area has a block structure from the Wilhelminian period and is located within and on the
edge of the City Rail Circle Line. Maximum values with more than 700 p/ha occur only in 50 of the
overall 14,700 blocks and block segments in Berlin. These areas are predominantly located in the
boroughs of Neukölln, Kreuzberg and Lichtenberg.
Outside the City Rail Circle Line, the relatively high population density continues south into the
Schöneberg, Friedenau, and Steglitz boroughs. A population distribution similar to that within the inner
City Rail Circle Line is found in older development areas of Spandau, and is similar to areas such as
Tegel, Schöneweide, Adlershof, and Tempelhof, which were developed around the turn of the century,
then on the edge of Berlin.
The high-rise and industrially-prefabricated settlements at the edge of the city are relatively densely
populated with 151 to more than 350 p/ha in large block areas. These are Märkisches Viertel,
Hohenschönhausen, Marzahn, Hellersdorf, and Gropiusstadt.
Smaller settlements in Spandau, Lichterfelde, Marienfelde, Waidmannslust, Bohnsdorf and Köpenick,
with their post-war high-rise development, stand out with predominantly 151 to 250 p/ha in the
generally more sparsely populated city edges. Some locations in this population density class are
settlements with block-edge and row development, however. Examples are Haselhorst, Siemensstadt,
Zehlendorf, and Plänterwald.
Typical for the city edge, and the most numerous, are relatively thinly populated settlements with 5 to
70 p/ha. These blocks are mainly characterized by structure type 10 ("Low buildings with yards"),
extending along the city boundary like a ribbon, excluding undeveloped forest areas or areas of other
green uses.
Compared with the Population Density map of 1994 (SenStadtUmTech 1996), an interesting
development can be observed at the eastern city border today, almost 25 years later. Because of
divisions of real estates in the areas of Biesdorf/Mahlsdorf/Kaulsdorf and in the consequence
constructional compressions, the predominant number of blocks are nowadays in the density category
of 31-70 p/ha, whereas for the data from December 31, 1994 blocks with less than 30 p/ha are in the
majority. Therefore, the eastern border of Berlin is now generally no longer characterized by a lower
population density than the western border.
The distribution of population density correlates quite clearly with the Environmental Atlas Map Urban
Structure (06.07) (SenStadt 2016). It is apparent that area types can be assigned a certain range of
population density. Table 1 shows the average population density for the individual area types with

                                                    4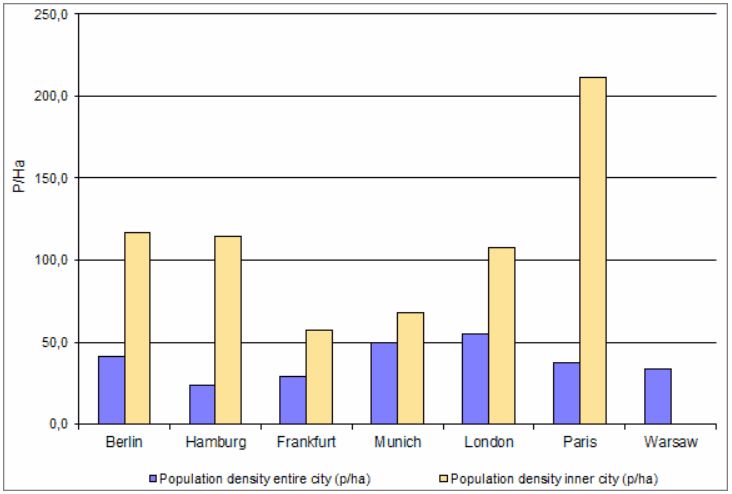
predominantly residential use (share > 75 %) or a share of trade, services and commerce fluctuating
between 25-50 %. These calculations apply to areas, both blocks and block segments, of uniform use.
Tab. 1: Average population density per area type and use, as of December 31, 2018
For blocks which are used for multiple purposes, the population density can be displayed with relatively
high precision in reference to block segments with uniform use.
Instancing the block north of the Innsbrucker Platz between Belziger Straße / Dominicusstraße and
Eisenacher Straße has several block segments, including a cemetery of 1.8 ha and a park of 2.5 ha.
By transferring the population data to the remaining segments of the block, the population density of 88
p/ha recorded for the entire block in 1994 increased to 340 p/ha in 2018, thus displaying a much more
accurate picture of the situation.
Nevertheless, there are also undivided blocks with different uses, for all cases where these differing
uses do not reach a size of one ha. For example, the western part of the block at the corner of Gothaer
Str. and Belziger Str. also has a larger utilities area, which was not indicated separately. In light of its
inner city location, with only 182 p/ha, it is a rather sparsely populated block. Further blocks with similar
population numbers are assigned to the use category “Public service and other special uses”.
Population density development between 2017 and 2018
The population growth Berlin has seen over the last few years has led to a substantial increase in the
number of inhabitants within the state. According to the population register, 3,747,936 people were
recorded on December 31, 2018; thus exceeding the previous year’s population count by approx.
36,000 people. Overall, most of the inhabited blocks (approx. 14,800 in total) were affected by
population changes, compared with the previous year. Relevant changes, both in terms of increased
and decreased population values, were observed in about 1,185 blocks and block segment areas.
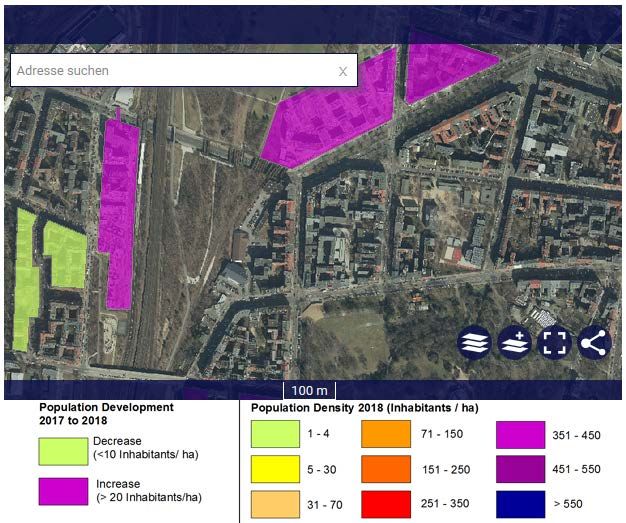
5Fig. 4: Map of Changes in Population Density between 2017 and 2018. Use the layer control to switch
the levels "population density 2018" and "population development between 2017 and 2018". (The result
is also available as a map in the Geoportal Berlin).
Areas displaying more substantial changes in population density (p/ha) within the year – increases of
more than 20 p/ha or decreases of more than 10 p/ha – are not distributed evenly across the individual
districts or even the whole city. The inner city area (the environmental zone within the City Rail Circle
Line), however, was identified as a key area:
- A total of 457 blocks or block segment areas saw an increase in population density of more
than 20 p/ha. A disproportionately high 40 % (269) of those is located within the area of the
City Rail Circle Line, which only accounts for about 11 % of the total city area.
- Also located within the area of the City Rail Circle Line is a large share (~37%, 269 of 728
areas) of the blocks / block segment areas whose population density decreased considerably
(by more than 10 p/ha each).
Figure 4 illustrates how the affected blocks and block segment areas are distributed across this region.
Blocks with above-average population increases and decreases appear clustered at times. What
caused these drastic changes within the period of one year could not be determined in detail. Thus,
converting buildings from residential to commercial use may lead to population reductions locally, in
the same way that new constructions may increase population numbers, due to gap closures and
densification within existing developments.
6New construction activity across the entire block plays an important role, leading to considerable
population increases, even in as short a period as one year. This is exemplified by the residential
construction projects: " “Park am Gleisdreieck” (southern part).
Fig. 5: Increase in population density (p/ha) by more than 230 people between 2017 and 2018
following new construction activity around the “Park am Gleisdreieck” (southern part),
top: map section (for legend, see Fig. 4), bottom left: section from orthophoto 2017 (DOP 2017),
bottom right: section from orthophoto 2018 (DOP 2018),
Source of orthophotos: Geoportal Berlin
Changes should generally be mapped and studied over a longer period of time. For this purpose, the
developments shall be continually recorded and updated here, while annually comparing them to the
reference year (2016).
Literature
[1] Amt für Statistik Berlin-Brandenburg [Statistical Office of Berlin-Brandenburg] (Ed.) 2019:
Melderechtlich registrierte Einwohner am Ort der Hauptwohnung in Berlin am 31.12.2018, Berlin
[Inhabitants Legally Registered at the Places of their Main Residence in Berlin, as of 31.12.2018,
Berlin].
7Internet:
https://www.statistik-berlin-brandenburg.de/service/welcome.asp
(Accessed on 31 May 2019)
[2] SenStadtUm (Senate Department for Urban Development and Environmental Protection)
(Ed.) 1990:
Räumliche Entwicklung in der Region Berlin - Planungsgrundlagen, Berlin [Spatial development
in the Berlin region – a basis for planning, Berlin].
[3] SenStadt (Senate Department for Urban Development) (Ed.) n.d.:
Bevölkerungsentwicklung in der Metropolregion Berlin 2002-2020, Erläuterungsbericht, Berlin
[Population development in the conurbation area of Berlin 2002-2020, Explanatory report,
Berlin].
Internet:
https://www.stadtentwicklung.berlin.de/planen/bevoelkerungsprognose/ [only in German]
(Accessed on 31 May 20189)
Links (Data Sources, Figure 1)
[4] Stadt Frankfurt [City of Frankfurt]
Internet:
https://www.frankfurt.de/sixcms/detail.php?id=437171&_ffmpar[_id_inhalt]=258871
(Accessed on 31 May 2019)
[5] Stadt München [City of Munich]
Download:
https://www.muenchen.de/rathaus/dam/jcr:370fe775-89d2-4a81-b7ca-
464ddb514549/jt170102.pdf [only in German]
(Accessed on 31 May 2019)
[6] Stadt Warschau [City of Warsaw]
Download:
http://warszawa.stat.gov.pl/download/gfx/warszawa/en/defaultaktualnosci/806/3/28/1/komunikat_
ang_01_waw_2016.pdf
(Accessed on 31 May 2019)
[7] Statistisches Amt für Hamburg und Schleswig Holstein [Statistical Office of Hamburg and
Schleswig-Holstein]
Download:
http://www.statistik-
nord.de/fileadmin/Dokumente/Statistische_Berichte/bevoelkerung/A_I_1_j_H/A_I_1_j15_HH
a.xlsx [only in German]
(Accessed on 31 May 2019)
[8] Land Area and Population Density London
Internet:
http://data.london.gov.uk/dataset/land-area-and-population-density-ward-and-borough
(Accessed on 31 May 2019)
[9] Institut National de la Statistique et des Études Économiques: INSEE [The National
Institute of Statistics and Economic Studies of France]
Internet:
https://www.insee.fr/en/statistiques?debut=0&categorie=2
(Accessed on 31 May 2019)
Maps
[10] SenStadtUmTech (Senate Department for Urban Development, Environmental Protection
and Technology, Berlin) (Ed.) 1996:
Berlin Environmental Atlas, extended and revised edition, Map 06.06 Population Density,
1:50,000, Berlin.
Internet:
https://www.stadtentwicklung.berlin.de/umwelt/umweltatlas/ei606.htm
8[11] SenStadtUm (Senate Department for Urban Development and the Environment) (Ed.)
2016:
Berlin Environmental Atlas, extended and revised Edition, Map 06.07 Urban Structure, 1:50,000,
Berlin.
Internet:
https://www.stadtentwicklung.berlin.de/umwelt/umweltatlas/eie607.htm
[12] SenStadtWohn (Senate Department for Urban Development and Housing) (Ed.) 2017a:
Berlin Environmental Atlas, extended and revised Edition, Map 06.05 Availability of Public, Near-
Residential Green Space, 1:50,000, Berlin.
Internet:
https://www.stadtentwicklung.berlin.de/umwelt/umweltatlas/eib605.htm
[13] SenStadtWohn (Senate Department for Urban Development and Housing) (Ed.) 2017b:
Berlin Environmental Atlas, extended and revised Edition, Map 07.05 Strategical Noise Maps,
1:50,000, Berlin.
Internet:
https://www.stadtentwicklung.berlin.de/umwelt/umweltatlas/eib705.htm
[14] SenStadtWohn (Senate Department for Urban Development and Housing) (Ed.) 2018:
Berlin Environmental Atlas, extended and revised Edition, Map 06.06 Population Density,
1:50,000, Berlin.
Internet:
https://www.stadtentwicklung.berlin.de/umwelt/umweltatlas/ein606.htm
9You can also read